Abstract
Background
Currently the only function of the resting electrocardiogram (ECG) in patients referred for exercise testing is to determine whether imaging is mandated. It is unknown if subtle ECG findings in those patients with clinically normal resting ECGs have prognostic significance.
Methods
We performed a single-center cohort study of 18,964 patients without known CVD, who had a clinically normal resting ECG and who underwent treadmill exercise testing for evaluation of suspected CAD. Eleven quantitative ECG measures related to heart rate, conduction, left ventricular mass, or repolarization were collected digitally. The primary outcome was all-cause mortality. The prognostic importance of a composite ECG score was assessed by measuring its impact on the c-index (analogous to area under ROC curve), and by measures of reclassification.
Results
During a median follow-up of 10.7 years 1,585 patients died. The four most predictive digital ECG variables were higher ventricular rate, more left-ward QRS axis, and more downward ST segment deviation, and longer QT interval. The ECG score was independently associated with mortality (75th vs. 25th percentile HR 1.36, 95% CI [1.25 to 1.49], P<.0001). The ECG score had modest impact on discrimination (change in c-index 0.04) and reclassification of risk (3.0% decrease of relative integrated discrimination improvement, P<.001).
Conclusions
Subtle ECG findings relating to heart rate, conduction, left ventricular mass, or repolarization in patients with clinically normal ECGs referred for exercise testing may provide modest additional prognostic information over and above clinical and exercise measures.
Introduction
The primary purpose of the resting electrocardiogram (ECG) prior to exercise stress testing is to identify patients who have baseline abnormalities that preclude interpretation of exercise-induced ST-segment changes.1 It is unknown whether, among these patients who have clinically normal ECGs, more precise ECG measures may improve estimation of prognosis.
Prior studies demonstrated that subtle ECG findings relating to heart rate (ventricular rate), conduction (P wave duration, PR interval, QRS duration), left ventricular mass (Sokolow-Lyon voltage, Cornell voltage, QRS axis), and repolarization (ST segment deviation, ST segment slope, QT interval, T wave amplitude) have prognostic significance in observational cohorts,2-6 patients with hypertension7 or heart failure,8 patients resuscitated after cardiac arrest,9 patients referred for coronary artery bypass grafting,10 and in patients enrolled in clinical trials7, 11, 12. Data are sparse regarding the potential importance of subtle ECG findings in patients referred for exercise testing, especially those with clinically normal ECGs.
Exercise testing is widely recognized as a powerful yet simple prognostic tool. We previously published and externally validated a prognostic model13 composed of twelve demographic (age, gender, history of current or recent smoking), clinical (history of non-insulin treated diabetes mellitus, insulin-treated diabetes mellitus, hypertension, and typical angina), and exercise test (exercise capacity, ST-segment depression during test, test angina, abnormal heart rate recovery, frequent ventricular ectopy in recovery) measures that performed well in predicting mortality. In the current study we examine in a subset of the same cohort, whether subtle ECG measures can augment this model’s performance.
We prospectively studied patients without known cardiovascular disease (CVD) who were referred for treadmill exercise testing. We hypothesized that (1) subtle ECG findings as identified by digital electrocardiography portend a worse prognosis, and (2) identification of these findings may improve risk stratification beyond twelve established demographic, clinical, and exercise test risk factors13 previously shown to predict all-cause mortality.
Methods
Study population
We performed a single-center (Cleveland Clinic, Cleveland, Ohio) cohort study. Between September 1990 and December 2002, 46,966 patients without known cardiovascular disease (CVD) or end-stage renal disease, 30 years of age or older, were referred for symptom-limited treadmill exercise stress testing at our institution (Figure 1). None of the patients had known coronary disease (as defined by a history of myocardial infarction, percutaneous coronary intervention, or coronary artery bypass grafting), heart failure, documented left ventricular systolic dysfunction, cardiomyopathy, valvular or congenital disease, previous organ transplantation, atrial fibrillation, digitalis use, pacemaker or defibrillator placement, or end-stage renal disease. All patients had a U.S. Social Security number. Only the first test performed for patients who had more than one stress test was included.
Figure 1.
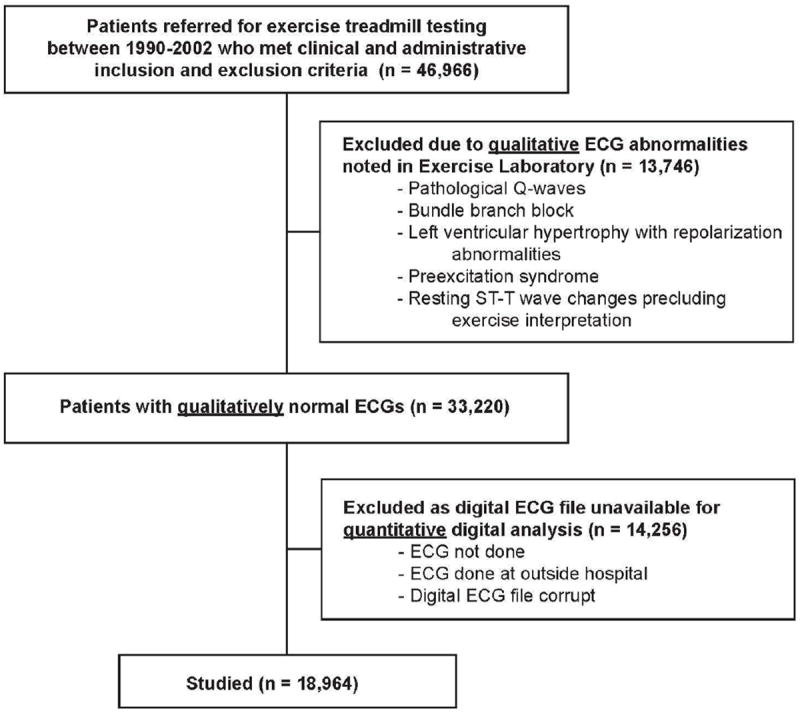
Flow diagram of patient recruitment and participation.
At our institution board-certified cardiologists and trained exercise physiologists qualitatively review ECGs prior to the start of stress testing. Based on their interpretation we excluded 13,746 patients with the following qualitative baseline abnormalities: pathological Q-waves, bundle branch block, left ventricular hypertrophy (LVH) with ST segment deviation, preexcitation syndrome, or resting ST-T wave changes unrelated to LVH precluding exercise interpretation (≥1mm of horizontal or down-sloping ST segment deviation) (Figure 1).
From the remaining 33,220 patients we excluded 14,256 who did not have a digital 12-lead resting ECG file performed outside the stress lab with standard lead placement within 3 months prior to referral for exercise testing (Figure 1). All ECGs in our hospital are standard 10 second recordings obtained with the Marquette General Electric MUSE system. Our ECG laboratory has standardized quality improvement protocols for assuring that lead placement errors and motion artifact are minimized. This resulted in 18,964 patients who had an ECG file that was analyzed digitally. Patients who had digital ECG files available were somewhat more likely to be male and less likely to have hypertension as compared to those excluded; otherwise there were no major differences (Appendix Table). Furthermore, when stratified according to risk groups based on our previously validated prognostic model, there were no differences in mortality among those who did and did not have digital ECG files available (Figure 2).
Figure 2.
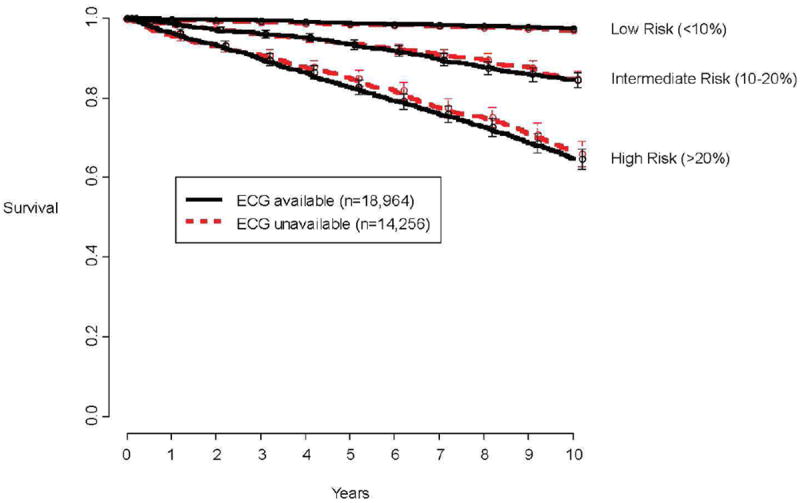
To address possible selection bias, plotted is observed mortality according to availability of digital ECG data and categories of predicted risk by our previously validated prognostic model13 that did not include ECG variables.
Digital electrocardiography
Eleven quantitative ECG measures were extracted for each patient that are commonly considered predictors of poor outcomes 2-12, and are believed to be correlates of heart rate, conduction, hypertrophy, or repolarization. These have not been previously scrutinized in patients with clinically normal ECGs undergoing exercise testing.
Digital ECGs were analyzed with General Electric’s Magellan Software System (Menomonee Falls, Wisconsin), which provided detailed data on the duration and amplitudes of all segments of the P wave, QRS complex, ST segment, and T wave in all 12 leads, with amplitudes recorded to the nearest 100th of a millivolt and times recorded to the nearest millisecond.
In this study the P wave duration, PR interval, QRS duration, and uncorrected QT interval were the median values from all 12 leads. ST segment deviation was measured at the end of the segment in lead V5, as this lead has been identified as a superior marker of coronary artery disease.14 In an analogous manner we measured T wave amplitude was the highest value measured in lead V5. Sokolow-Lyon voltage was calculated by adding S wave amplitude in lead V1 to that of the maximum R wave in lead V5 or V6.15 Cornell voltage was calculated by adding R wave amplitude in lead AVL to that of the S wave in lead V3.15, 16 ST slope was calculated as the difference between ST segment deviation at the end of the segment and at the J point in lead V5.10, 14
Clinical Data
Descriptions of prospectively collected demographic and clinical data, as well as details of exercise stress testing protocols in our laboratory, have been published.13, 17-19 Briefly, heart rate recovery was considered to be abnormal if after the first minute of exercise the heart rate fell ≤12 beats/minute in patients undergoing an upright cool-down period, or ≤18 beats/minute in patients undergoing stress echocardiography. Frequent ventricular ectopy during recovery was defined by the presence of ≥7 premature ventricular beats per minute, ventricular couplets or triplets, ventricular bigeminy or trigeminy, ventricular tachycardia, ventricular flutter, torsade de pointes, or ventricular fibrillation.20
The study was approved by Cleveland Clinic’s institutional review board, and because all data were collected and recorded as part of routine clinical care, requirement for informed consent was waived. This project was funded by National Heart, Lung, and Blood Institute CAN# 8324207. The authors are solely responsible for the design and conduct of this study, all study analyses, the drafting and editing of the paper and its final contents.
Outcome
All-cause mortality, a clinically relevant and unbiased end-point,21 was ascertained by the Social Security Death Index.22, 23 Patients were followed until a common closing date of January 1, 2008. Previously we have shown that among our patients this method has a sensitivity of 97% for accurately detecting death.19
Statistical analyses
We constructed Kaplan-Meier plots24 for each ECG variable, and tested mortality differences by using the log-rank chi-square statistic.
Modeling
We previously published a non-parsimonious prognostic model composed of twelve demographic, clinical, and exercise test variables that performed well in predicting all-cause mortality in patients with a qualitatively normal resting ECG referred for treadmill exercise testing.13 In an analogous manner we constructed a non-parsimonious Cox proportional mortality hazards model including all eleven quantitative ECG variables and the twelve traditional risk factor variables listed in Table 1 (including gender). Nonlinear associations were tested with restricted cubic splines.25 We tested for interactions. The proportional hazards assumption was tested by scaled Schoenfeld residuals and inspection of hazard ratio plots.26
Table 1.
Baseline, exercise, and electrocardiographic characteristics of 18,964 patients undergoing treadmill exercise testing according to gender.
| Women n=6,486 |
Men n=12,478 |
Entire cohort n=18,964 |
|
|---|---|---|---|
|
| |||
| Demographic and clinical | |||
| Age, y | 53 (46, 62) | 50 (43, 58) | 51 (44, 60) |
| Current or recent smoking, n (%) | 1,142 (18%) | 2,109 (17%) | 3,251 (17%) |
| Non-insulin treated diabetes mellitus, n (%) | 372 (6%) | 549 (4%) | 921 (5%) |
| Insulin-treated diabetes mellitus, n (%) | 153 (2%) | 194 (2%) | 347 (2%) |
| Hypertension, n (%) | 3,000 (46%) | 5,491 (44%) | 8,491 (45%) |
| Typical angina, n (%) | 85 (1%) | 72 (1%) | 157 (1%) |
| Exercise | |||
| Predicted Metabolic Equivalents Achieved *, % | 103% (88%, 120%) | 103% (90%, 116%) | 103% (90%, 117%) |
| ST-segment depression (10th, 90th percentiles), mm | 0 (0, 1) | 0 (0, 1) | 0 (0, 1) |
| Test angina, n (%) | 131 (2%) | 125 (1%) | 256 (1%) |
| Abnormal heart rate recovery, n (%) | 1,264 (19%) | 1,930 (15%) | 3,194 (17%) |
| Frequent ventricular ectopy in recovery, n (%) | 219 (3%) | 468 (4%) | 687 (4%) |
| Electrocardiographic | |||
| Ventricular rate, bpm | 69 (61, 77) | 64 (57, 73) | 66 (58, 74) |
| P wave duration, ms | 104 (96, 112) | 112 (104, 116) | 108 (100, 116) |
| PR interval, ms | 156 (140, 168) | 160 (148, 176) | 160 (144, 176) |
| QRS duration, ms | 84 (80, 92) | 96 (88, 100) | 92 (84, 100) |
| Sokolow-Lyon voltage, mV | 2.0 (1.6, 2.4) | 2.2 (1.8, 2.7) | 2.1 (1.8, 2.6) |
| Cornell voltage, mV | 1.1 (0.8, 1.5) | 1.4 (1.1, 1.8) | 1.3 (1.0, 1.7) |
| ST segment deviation in lead V5, mV | 0.29 (0.04, 0.53) | 0.92 (0.48, 1.41) | 0.63 (0.24, 1.17) |
| ST segment slope in lead V5, mV | 0.29 (0.10, 0.44) | 0.78 (0.44, 1.17) | 0.54 (0.29, 0.93) |
| QT interval, ms | 396 (372, 416) | 400 (376, 420) | 396 (376, 420) |
| QRS axis, degrees | 31 (8, 55) | 27 (3, 52) | 29 (4, 53) |
| T wave amplitude in lead V5, mV | 0.22 (0.13, 0.30) | 0.31 (0.20, 0.43) | 0.28 (0.17, 0.40) |
Continuous variables are medians (25th to 75th percentiles), unless otherwise indicated.
Predicted metabolic equivalents (METS) achieved was calculated with previously validated models17: for men – observed METS / (18 − [0.15 × age]) × 100, and for women – observed METS / (14.7 − [0.13 × age]) × 100.
Constructing a composite ECG score
From this analysis a composite ECG score was generated: ECG score = (β1 × ECG measure 1) + (β2 × ECG measure 2) + … (β11 × ECG measure 11), where βn denoted the confounder-adjusted parameter coefficients. We constructed a second Cox proportional hazards model that included the ECG score along with the 12 traditional risk factors to determine the hazard ratio of this score.
Evaluation of prognostic importance
To assess the prognostic contribution of the ECG variables individually and as a cluster (i.e., the ECG score) we used the following approaches: calculation of a bootstrapped concordance index (c-index), calculation of prediction error using out-of-bagging10, evaluation of reclassification27, 28, and calculation of integrated discrimination improvement29, 30.
Model discrimination was assessed by calculating out-of-bag estimates of the c-index for time to event outcomes.26 This method is similar to calculating the area under an ROC curve, but by bootstrapping there is adjustment for over-optimism.
The out-of-bag (OOB) method involves obtaining bootstrap samples from the original cohort and using each sample to compute a prediction model that incorporated the ECG variables and potential confounders. Each bootstrap sample left out, on average, ~ 37% of the patients, which was the OOB sample. The prediction model including the ECG variables was applied to the OOB sample to calculate the OOB c-index. The value of this technique is in its ability to effectively perform valid external validations of the model without an unrelated external dataset.10, 18
To determine the change in prediction error (equivalent to change in area under an ROC curve) attributed to each variable (i.e., the ‘variable importance’), we recalculated the prediction error after random permutation of that variable in the OOB sample (effectively converting the variable’s value into completely uninformative noise); an important variable would be expected to yield a greater degradation in the OOB c-index. The process was repeated 100 times for each variable.
To assess calibration, we performed 100 bootstrap resamplings in which patients were divided into quintiles of predicted risk. Within each quintile, actual versus predicted survival rates were calculated, and the differences were averaged to calculate a weighted calibration error. Using this technique we found the calibration of both Cox models to be excellent.
To address clinical utility we constructed a risk reclassification plot,27, 28, 31 comparing the 10-year risk of all-cause mortality predicted by the model with the ECG score and established risk factors against risk predicted by model containing only the established risk factors. We used an objective way of quantifying improvement in classification of risk: integrated discrimination improvement (IDI).29, 30
Presentation
Continuous variables are summarized by medians, and categorical variables by frequency and percentage. Kaplan-Meier and risk adjusted plots are presented with error bars or bands indicating 95% confidence intervals. Life expectancy data from the Human Mortality Project (http://www.mortality.org) were used to produce a United States age-and sex-matched reference population mortality curve that was super-imposed on a plot of ECG score quartiles.
Computational methods
Data assembly was performed with SAS version 9.1.3 (SAS Institute Inc., Cary, NC). Analyses were performed using R version 2.6.2 (www.r-project.org). We used Harrell’s Design and Hmisc libraries26 for model construction and assessment, an R macro written by one of us (H.I.) for the OOB and change in prediction error analyses10, another macro written by Kattan13 for constructing the reclassification table, and the Relative Survival library for constructing the population reference plot.32, 33 We used a SAS macro written by Pencina29 for calculating improvement in classification of risk.
Results
Patient Characteristics
There were 18,964 patients with both a qualitatively normal ECG and a digital 12-lead resting ECG file available for quantitative analysis, their characteristics are shown in Table 1.
Among these 18,964 patients, 3,441 (18%) were on aspirin, 1,178 (6%) were on statins, 217 (1%) were on other antihypelipidemic medications, 1,529 (8%) on thiazide diuretics, 1,968 (10%) on beta-blockers, 1,635 (9%) on calcium-channel blockers, and 1,447 (8%) on angiotensin-converting enzyme inhibitors. During exercise testing, 1,917 (10%) developed between 1 mm and 2 mm of horizontal or downsloping ST-segment depression, and an additional 325 (2%) developed ST-segment depression greater than 2 mm. Digital ECG variables that were correlated with abnormal ST segment depression during exercise included ventricular rate, P wave duration and PR interval, Sokolow-Lyon voltage, ST segment deviation in lead V5, QT interval, and QRS axis (all P<0.0001).
ECG Findings and Mortality
During a median follow-up of 10.7 years (range for survivors 5-17 years), 1,585 patients (8%) died. The following quantitative ECG findings were most strongly associated (log-rank chi squared > 100) with increased mortality in an unadjusted analysis: more downward ST segment deviation, more left-ward QRS axis, more downward ST slope, lower T-wave amplitude, faster ventricular rate, longer PR interval, greater Cornell voltage, and longer P-wave duration were all associated with higher mortality (Figure 3).
Figure 3.
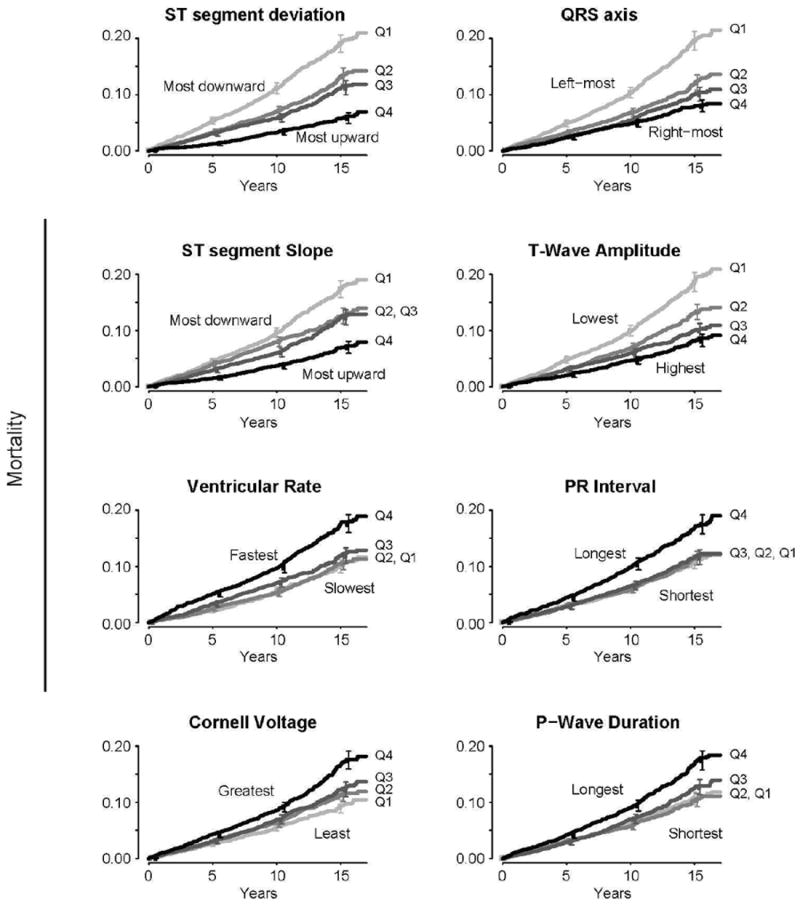
Mortality risk according to quartiles of quantitative ECG measures. Only shown are measures with χ2> 50. Log-rank P-value for all <.001. Quartile values: ST segment deviation (Q1: <0.29 mV, Q2: 0.29-0.68, Q3: 0.68-1.2, Q4: ≥1.2), QRS axis (Q1: <5 degrees, Q2: 5-30, Q3: 30-54, Q4: ≥54), ST segment slope (Q1: <30 mV, Q2: 30-58, Q3: 58-97, Q4: ≥97), T-wave amplitude (Q1: <0.18 mV, Q2: 0.18-0.28, Q3: 0.28-0.40, Q4: ≥0.40), ventricular rate (Q1: <59 bpm, Q2: 59-67, Q3: 67-75, Q4: ≥75), PR interval (Q1: <148 ms, Q2: 148-164, Q3: 164-180, Q4: ≥180), Cornell voltage (Q1: <0.98 mV, Q2: 0.98-1.31, Q3: 1.31-1.68, Q4: ≥1.68), and P-wave duration (Q1: <104 ms, Q2: 104-112, Q3: 112-120, Q4: ≥120). Error bars indicate 95% confidence intervals.
The OOB c-index of the Cox model containing the 12 established risk factors13 and all 11 quantitative ECG measures was 0.84. Among the ECG variables, those that contributed most to improved prediction were: higher ventricular rate (decrease in OOB c-index=0.004 [0.5% decrease]), more left-ward QRS axis (0.003 [0.4%]), more downward ST segment deviation (0.003 [0.4%]), longer QT interval (0.002 [0.2%]), more downward ST-segment slope (0.0007 [0.08%]), lower T-wave amplitude (0.0006 [0.07%]), greater Cornell voltage (0.0003 [0.04%]), longer PR interval (0.0003 [0.04%]), longer P-wave duration (0.0001 [0.01%]), and longer QRS duration (0.0001 [0.01%]).
ECG Score and Mortality
The adjusted ECG score (Appendix Formula), a non-parsimonious cluster of the ECG variables, was predictive of death (Figure 4), even after multivariable adjustment (75th vs. 25th percentile, adjusted HR 1.36, 95% CI [1.25 to 1.49], P<.0001). There was a significant interplay between age and the adjusted ECG score (P for interaction=0.005) whereby the younger the patient the higher the predicted utility of the adjusted ECG score.
Figure 4.
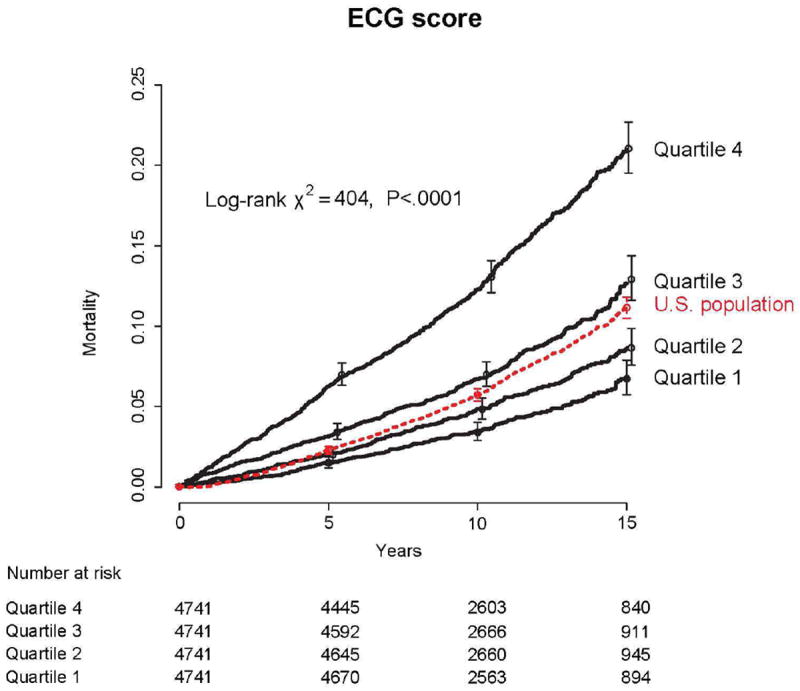
Mortality risk according to quartiles of ECG score (Q1: <22.4, Q2: 22.4-23.4, Q3: 23.4-24.5, Q4: ≥24.5). See appendix for ECG score equation. Error bars indicate 95% confidence intervals. Dashed line is predicted mortality based on US vital statistics and the age and sex distribution of our cohort.
The OOB c-index of the model with the adjusted ECG score was 0.84. Adjusted ECG score was the third most important contributor to accuracy of predicting mortality (decrease in OOB c-index=0.04 [4.8% decrease]) after percent predicted METS (0.24 [28.6%]) and age (0.22 [26.2%]) (Figure 5).
Figure 5.
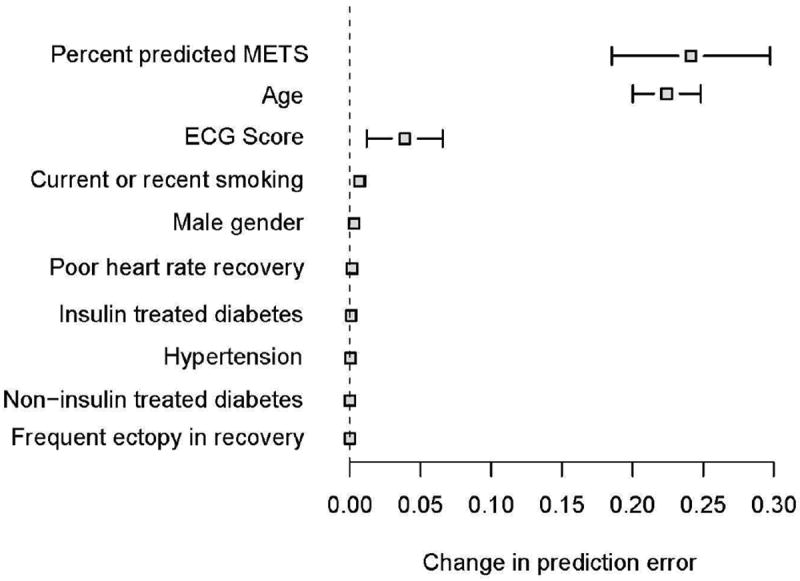
Change in prediction error by out-of-bagging. Only variables that contribute to predictive discrimination are shown. Results are based on 100 bootstrap samples. Error bars indicate 95% confidence intervals.
To assess whether the association of adjusted ECG score with mortality differed over time, we performed a supplementary analysis in two subsets of the cohort. In 6,797 patients who had the exercise test between 1990-1995 and censored at five years, adjusted ECG score was at least as predictive of death (75th vs. 25th percentile, adjusted HR 1.38, 95% CI [1.22 to 1.57], P<.0001) as in 7,558 patients who had the test between 1995-2000 and censored at five years (75th vs. 25th percentile, adjusted HR 1.58, 95% CI [1.32 to 1.88], P<.0001).
Figure 6 shows 10-year risk of mortality predicted by the model containing the ECG score and established risk factors against risk predicted by the model containing only the established risk factors. Each point represents an individual patient. The integrated discrimination improvement, a measure of improvement in model performance, was 0.006 (95% CI, 0.003-0.008, P-value<0.0001). This corresponds to a relative IDI of 3%, meaning there was a 3% improvement in model performance due to the addition of ECG score. Despite this value being statistically significant, it’s absolute value is small and suggests only limited utility of adding ECG score to the prognostic model. The modest effect of ECG score is also reflected by the minimal spread observed around the 45 degree line of identity.
Figure 6.
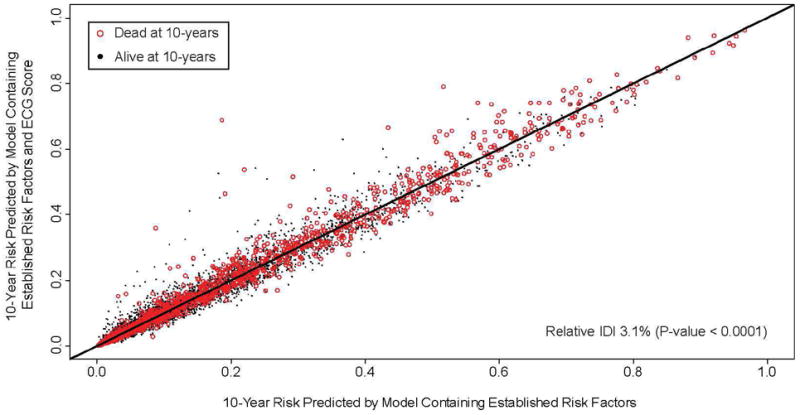
Ten-year risk of all-cause mortality predicted by the model containing the ECG score and established risk factors against risk predicted by model containing only the established risk factors. If a variable adds no predictive value to the model, all points fall on the line of identity. Spread around the line indicates modulation of predicted risk; if the variable correctly modulates predicted risk, there should be a greater preponderance of events (red circles) above the line of identity. Improvement of classification is expressed as relative integrated discrimination improvement (IDI), demonstrating as a 3% improvement in model performance with the ECG score.
Subset analysis
To assess how ECG score performed in different subsets of the cohort we compared mortality risk in the highest ECG score quartile versus the lower three quartiles in subsets of sex, diabetes, smoking, history of hypertension, and age. ECG scores within the highest quartile portended increased risk in all subsets of patients (Figure 7), with a significantly higher utility in males, and those without history of diabetes or hypertension.
Figure 7.
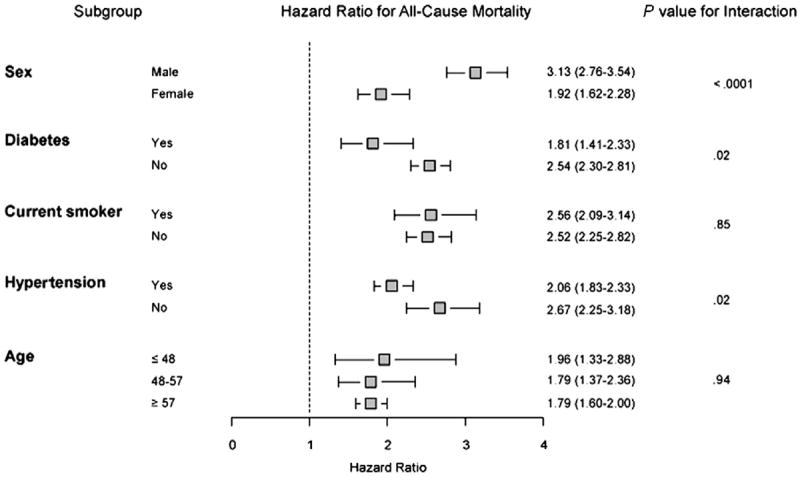
Subset analysis comparing highest ECG score quartile to bottom quartiles.
Discussion
In this study of 18,964 patients without known CVD, who were referred for exercise testing and who had a clinically normal resting ECG, we found that a number of digitally measured ECG findings reflective of heart rate, conduction, left ventricular mass, and repolarization, were predictive of long-term mortality individually and as a composite. However, the increased risk associated with a composite ECG score led to a small change in the OOB c-index (4.8%), which suggested that adding information from quantitative ECG measures to established risk factors only modestly improved discrimination for prediction of 10-year mortality. Further, a prediction model with ECG score yielded only modest reclassification of risk (3% increase in model performance) beyond the standard prediction model, which was based on easily obtained demographic, clinical, and exercise test measures.
Our findings are consistent with prior studies demonstrating the predictive utility of subtle ECG measures for long-term mortality4, 7, 11, 34-40. Denes and colleagues11 recently demonstrated that “minor” ECG abnormalities (defined as first or second degree atrioventricular block, borderline prolonged ventricular excitation, prolonged ventricular repolarization, isolated minor Q and ST-T abnormalities, left ventricular hypertrophy without ST-T abnormalities, left atrial enlargement, frequent atrial or ventricular premature beats, or fascicular blocks) added incremental prognostic information to established risk factors in asymptomatic postmenopausal women. Consistent with this we found that in a relatively healthy stress testing population with clinically normal ECGs, quantitative ECG measures added incremental prognostic value beyond established risk factors, but the increment of improvement was modest. This may be because unlike previous investigations, we accounted for systematic measures of exercise capacity, which have consistently been shown to be one of the most powerful predictors of mortality.
Based on our analysis health care providers utilizing exercise testing for assessment of prognosis will gain little from incorporating ECG measures into their current risk assessment algorithm. It remains unknown though if ECG measures can have greater clinical utility in non-stress testing populations, where the powerful prognostic value of functional capacity is not assessed objectively.
Limitations
Our study population was derived from Cleveland Clinic, a single tertiary referral-center, and as such our results can only be generalized to exercise test patients in similar settings. We did not have an external dataset on which to validate our findings. As we are not aware of any other cohorts who have had these types of detailed clinical, stress testing, and quantitative ECG information collected, we opted instead to use out-of-bagging for validation.10 With this internal validation approach our prediction estimates were not based on one dataset alone but on 100 bootstrapped segments of the larger cohort.
Potential for selection bias exists. We only studied patients who had resting ECGs collected with standard lead placement, in addition to pre-test resting ECGs with modified torso leads. Some physicians did not refer patients for standard 12-lead ECGs if they were available from prior visits or from outside institutions, or if they felt that the stress laboratory modified lead ECGs were adequate. Other reasons for missing digital ECGs included those patients who had a resting ECG done at a satellite of the hospital where central storage is not available, and a small fraction whose digital file was corrupted. To assess for potential selection bias we examined the excluded patient’s baseline characteristics and their outcomes. There were few major differences between included and excluded patients, particularly for the two major clinical predictors of risk, namely age and predicted metabolic equivalents achieved (Appendix Table). Further, the mortality rate of the excluded subset closely mirrored that of the studied subset (Figure 2).
The ECG measurements were performed digitally from surface ECGs. Intra-cardiac measurements done in the electrophysiology lab might provide even more precise measures.
Summary and conclusions
We found that the resting ECG done prior to exercise testing may provide incremental prognostic value beyond determining validity of ST-segment interpretation. Subtle ECG findings relating to heart rate, conduction, left ventricular mass, and repolarization portend a worse long-term prognosis, but only modestly improve discrimination and clinical risk stratification for all-cause mortality.
Appendix Table.
Comparison of patients who were (‘“With resting ECGs”) and were not (“Without resting ECGs”) included in the study.
| Characteristic | Value | |||
|---|---|---|---|---|
| With resting ECGs (n=18,964) |
Without resting ECGs (n=14,256) |
|||
| Demographic and clinical | ||||
| Age, y | 52 | (44, 60) | 54 | (45, 62) |
| Male, n (%) | 12,478 | (66) | 8,004 | (56) |
| Current or recent smoking, n (%) | 3,251 | (17) | 2,426 | (17) |
| Non-insulin treated diabetes mellitus, n (%) | 921 | (5) | 899 | (6) |
| Insulin-treated diabetes mellitus, n (%) | 347 | (2) | 318 | (2) |
| Hypertension, n (%) | 8,491 | (45) | 7,659 | (54) |
| Typical angina, n (%) | 157 | (1) | 201 | (1) |
| Exercise | ||||
| Predicted Metabolic Equivalents Achieved *, % | 103 | (90, 117) | 102 | (88, 116) |
| ST-segment depression (10th, 90th percentiles), mm | 0 | (0, 1) | 0 | (0, 1) |
| Test angina, n (%) | 256 | (1) | 230 | (2) |
| Abnormal heart rate recovery, n (%) | 3,194 | (17) | 2,441 | (17) |
| Frequent ventricular ectopy in recovery, n (%) | 687 | (4) | 515 | (4) |
Continues variables are medians (25th to 75th percentiles), unless otherwise indicated.
Predicted metabolic equivalents (METS) achieved was calculated with previously validated models17: for men -- observed METS / (18 − [0.15 × age]) × 100, and for women – observed METS / (14.7 − [0.13 × age]) × 100. See text for details.
Appendix Formula
The equation of the ECG score:
** pmax: Pick maximum of the two possible values. For example, pmax(QRS axis + 15,0) means that if (QRS axis + 15) is greater than zero that value is chosen; if (QRS axis + 15) is less than zero than the value zero is chosen.
Footnotes
Publisher's Disclaimer: This is a PDF file of an unedited manuscript that has been accepted for publication. As a service to our customers we are providing this early version of the manuscript. The manuscript will undergo copyediting, typesetting, and review of the resulting proof before it is published in its final citable form. Please note that during the production process errors may be discovered which could affect the content, and all legal disclaimers that apply to the journal pertain.
Contributor Information
Eiran Z. Gorodeski, Email: gorodee@ccf.org, Heart and Vascular Institute, Cleveland Clinic, Cleveland, OH.
Hemant Ishwaran, Department of Quantitative Health Sciences, Cleveland Clinic, Cleveland, OH.
Eugene H. Blackstone, Heart and Vascular Institute, Cleveland Clinic, Cleveland, OH.
References
- 1.Klocke FJ, Baird MG, Lorell BH, et al. ACC/AHA/ASNC guidelines for the clinical use of cardiac radionuclide imaging--executive summary: a report of the American College of Cardiology/American Heart Association Task Force on Practice Guidelines (ACC/AHA/ASNC Committee to Revise the 1995 Guidelines for the Clinical Use of Cardiac Radionuclide Imaging) Circulation. 2003;108(11):1404–18. doi: 10.1161/01.CIR.0000080946.42225.4D. [DOI] [PubMed] [Google Scholar]
- 2.Kannel WB, Anderson K, McGee DL, et al. Nonspecific electrocardiographic abnormality as a predictor of coronary heart disease: the Framingham Study. Am Heart J. 1987;113(2 Pt 1):370–6. doi: 10.1016/0002-8703(87)90280-8. [DOI] [PubMed] [Google Scholar]
- 3.Levy D, Salomon M, D’Agostino RB, et al. Prognostic implications of baseline electrocardiographic features and their serial changes in subjects with left ventricular hypertrophy. Circulation. 1994;90(4):1786–93. doi: 10.1161/01.cir.90.4.1786. [DOI] [PubMed] [Google Scholar]
- 4.Okin PM, Devereux RB, Kors JA, et al. Computerized ST depression analysis improves prediction of all-cause and cardiovascular mortality: the strong heart study. Ann Noninvasive Electrocardiol. 2001;6(2):107–16. doi: 10.1111/j.1542-474X.2001.tb00094.x. [DOI] [PMC free article] [PubMed] [Google Scholar]
- 5.Sigurdsson E, Sigfusson N, Sigvaldason H, et al. Silent ST-T changes in an epidemiologic cohort study--a marker of hypertension or coronary heart disease, or both: the Reykjavik study. J Am Coll Cardiol. 1996;27(5):1140–7. doi: 10.1016/0735-1097(95)00614-1. [DOI] [PubMed] [Google Scholar]
- 6.Knutsen R, Knutsen SF, Curb JD, et al. The predictive value of resting electrocardiograms for 12-year incidence of coronary heart disease in the Honolulu Heart Program. J Clin Epidemiol. 1988;41(3):293–302. doi: 10.1016/0895-4356(88)90134-5. [DOI] [PubMed] [Google Scholar]
- 7.Okin PM, Devereux RB, Nieminen MS, et al. Electrocardiographic strain pattern and prediction of cardiovascular morbidity and mortality in hypertensive patients. Hypertension. 2004;44(1):48–54. doi: 10.1161/01.HYP.0000132556.91792.6a. [DOI] [PubMed] [Google Scholar]
- 8.Iuliano S, Fisher SG, Karasik PE, et al. QRS duration and mortality in patients with congestive heart failure. Am Heart J. 2002;143(6):1085–91. doi: 10.1067/mhj.2002.122516. [DOI] [PubMed] [Google Scholar]
- 9.Haissaguerre M, Derval N, Sacher F, et al. Sudden cardiac arrest associated with early repolarization. N Engl J Med. 2008;358(19):2016–23. doi: 10.1056/NEJMoa071968. [DOI] [PubMed] [Google Scholar]
- 10.Lauer MS, Martino D, Ishwaran H, et al. Quantitative measures of electrocardiographic left ventricular mass, conduction, and repolarization, and long-term survival after coronary artery bypass grafting. Circulation. 2007;116(8):888–93. doi: 10.1161/CIRCULATIONAHA.107.698019. [DOI] [PubMed] [Google Scholar]
- 11.Denes P, Larson JC, Lloyd-Jones DM, et al. Major and minor ECG abnormalities in asymptomatic women and risk of cardiovascular events and mortality. Jama. 2007;297(9):978–85. doi: 10.1001/jama.297.9.978. [DOI] [PubMed] [Google Scholar]
- 12.Prineas RJ, Grandits G, Rautaharju PM, et al. Long-term prognostic significance of isolated minor electrocardiographic T-wave abnormalities in middle-aged men free of clinical cardiovascular disease (The Multiple Risk Factor Intervention Trial [MRFIT]) Am J Cardiol. 2002;90(12):1391–5. doi: 10.1016/s0002-9149(02)02881-3. [DOI] [PubMed] [Google Scholar]
- 13.Lauer MS, Pothier CE, Magid DJ, et al. An externally validated model for predicting long-term survival after exercise treadmill testing in patients with suspected coronary artery disease and a normal electrocardiogram. Ann Intern Med. 2007;147(12):821–8. doi: 10.7326/0003-4819-147-12-200712180-00001. [DOI] [PubMed] [Google Scholar]
- 14.Miranda CP, Liu J, Kadar A, et al. Usefulness of exercise-induced ST-segment depression in the inferior leads during exercise testing as a marker for coronary artery disease. Am J Cardiol. 1992;69(4):303–7. doi: 10.1016/0002-9149(92)90224-m. [DOI] [PubMed] [Google Scholar]
- 15.Sundstrom J, Lind L, Arnlov J, et al. Echocardiographic and electrocardiographic diagnoses of left ventricular hypertrophy predict mortality independently of each other in a population of elderly men. Circulation. 2001;103(19):2346–51. doi: 10.1161/01.cir.103.19.2346. [DOI] [PubMed] [Google Scholar]
- 16.Casale PN, Devereux RB, Alonso DR, et al. Improved sex-specific criteria of left ventricular hypertrophy for clinical and computer interpretation of electrocardiograms: validation with autopsy findings. Circulation. 1987;75(3):565–72. doi: 10.1161/01.cir.75.3.565. [DOI] [PubMed] [Google Scholar]
- 17.Cole CR, Blackstone EH, Pashkow FJ, et al. Heart-rate recovery immediately after exercise as a predictor of mortality. N Engl J Med. 1999;341(18):1351–7. doi: 10.1056/NEJM199910283411804. [DOI] [PubMed] [Google Scholar]
- 18.Kim ES, Ishwaran H, Blackstone E, et al. External prognostic validations and comparisons of age-and gender-adjusted exercise capacity predictions. J Am Coll Cardiol. 2007;50(19):1867–75. doi: 10.1016/j.jacc.2007.08.003. [DOI] [PubMed] [Google Scholar]
- 19.Nishime EO, Cole CR, Blackstone EH, et al. Heart rate recovery and treadmill exercise score as predictors of mortality in patients referred for exercise ECG. Jama. 2000;284(11):1392–8. doi: 10.1001/jama.284.11.1392. [DOI] [PubMed] [Google Scholar]
- 20.Frolkis JP, Pothier CE, Blackstone EH, et al. Frequent Ventricular Ectopy after Exercise as a Predictor of Death. N Engl J Med. 2003;348(9):781–790. doi: 10.1056/NEJMoa022353. [DOI] [PubMed] [Google Scholar]
- 21.Lauer MS, Blackstone EH, Young JB, et al. Cause of death in clinical research: time for a reassessment? J Am Coll Cardiol. 1999;34(3):618–20. doi: 10.1016/s0735-1097(99)00250-8. [DOI] [PubMed] [Google Scholar]
- 22.Newman TB, Brown AN. Use of commercial record linkage software and vital statistics to identify patient deaths. J Am Med Inform Assoc. 1997;4(3):233–7. doi: 10.1136/jamia.1997.0040233. [DOI] [PMC free article] [PubMed] [Google Scholar]
- 23.Curb JD, Ford CE, Pressel S, et al. Ascertainment of vital status through the National Death Index and the Social Security Administration. Am J Epidemiol. 1985;121(5):754–66. doi: 10.1093/aje/121.5.754. [DOI] [PubMed] [Google Scholar]
- 24.Kaplan EL, M P. Nonparametric estimation from incomplete observations. J Am Stat Assn. 1958;(53):457–481. [Google Scholar]
- 25.Harrell FE, Jr, Lee KL, Mark DB. Multivariable prognostic models: issues in developing models, evaluating assumptions and adequacy, and measuring and reducing errors. Stat Med. 1996;15(4):361–87. doi: 10.1002/(SICI)1097-0258(19960229)15:4<361::AID-SIM168>3.0.CO;2-4. [DOI] [PubMed] [Google Scholar]
- 26.Harrell FE., Jr . Regression Modeling Strategies with Applications to Linear Models, Logistic Regression, and Survival Analysis. New York, NY: Springer-Verlag; 2001. [Google Scholar]
- 27.Cook NR. Use and misuse of the receiver operating characteristic curve in risk prediction. Circulation. 2007;115(7):928–35. doi: 10.1161/CIRCULATIONAHA.106.672402. [DOI] [PubMed] [Google Scholar]
- 28.McGeechan K, Macaskill P, Irwig L, et al. Assessing new biomarkers and predictive models for use in clinical practice: a clinician’s guide. Arch Intern Med. 2008;168(21):2304–10. doi: 10.1001/archinte.168.21.2304. [DOI] [PubMed] [Google Scholar]
- 29.Pencina MJ, D’Agostino RB, Sr, D’Agostino RB, Jr, et al. Evaluating the added predictive ability of a new marker: from area under the ROC curve to reclassification and beyond. Stat Med. 2008;27(2):157–72. doi: 10.1002/sim.2929. discussion 207-12. [DOI] [PubMed] [Google Scholar]
- 30.Pencina MJ, D’Agostino RB, Sr, D’Agostino RB, Jr, et al. Rejoinder: Comments on ‘Integrated discrimination and net reclassification improvements -- Practical advice’. Stat Med. 2008;27(2):207–12. [Google Scholar]
- 31.Cook NR, Buring JE, Ridker PM. The effect of including C-reactive protein in cardiovascular risk prediction models for women. Ann Intern Med. 2006;145(1):21–9. doi: 10.7326/0003-4819-145-1-200607040-00128. [DOI] [PubMed] [Google Scholar]
- 32.Pohar M, Stare J. Relative survival analysis in R. Comput Methods Programs Biomed. 2006;81(3):272–8. doi: 10.1016/j.cmpb.2006.01.004. [DOI] [PubMed] [Google Scholar]
- 33.Therneau TM, O J. Expected Survival Based on Hazard Rates. [July 3, 2008];1999 Feb; http://mayoresearch.mayo.edu/mayo/research/biostat/upload/63.pdf.
- 34.Cullen K, Stenhouse NS, Wearne KL, et al. Electrocardiograms and 13 year cardiovascular mortality in Busselton study. Br Heart J. 1982;47(3):209–12. doi: 10.1136/hrt.47.3.209. [DOI] [PMC free article] [PubMed] [Google Scholar]
- 35.De Bacquer D, De Backer G, Kornitzer M, et al. Prognostic value of ECG findings for total, cardiovascular disease, and coronary heart disease death in men and women. Heart. 1998;80(6):570–7. doi: 10.1136/hrt.80.6.570. [DOI] [PMC free article] [PubMed] [Google Scholar]
- 36.Cedres BL, Liu K, Stamler J, et al. Independent contribution of electrocardiographic abnormalities to risk of death from coronary heart disease, cardiovascular diseases and all causes. Findings of three Chicago epidemiologic studies. Circulation. 1982;65(1):146–53. doi: 10.1161/01.cir.65.1.146. [DOI] [PubMed] [Google Scholar]
- 37.Greenland P, Xie X, Liu K, et al. Impact of minor electrocardiographic ST-segment and/or T-wave abnormalities on cardiovascular mortality during long-term follow-up. Am J Cardiol. 2003;91(9):1068–74. doi: 10.1016/s0002-9149(03)00150-4. [DOI] [PubMed] [Google Scholar]
- 38.Okin PM, Devereux RB, Lee ET, et al. Electrocardiographic repolarization complexity and abnormality predict all-cause and cardiovascular mortality in diabetes: the strong heart study. Diabetes. 2004;53(2):434–40. doi: 10.2337/diabetes.53.2.434. [DOI] [PubMed] [Google Scholar]
- 39.Okin PM, Malik M, Hnatkova K, et al. Repolarization abnormality for prediction of all-cause and cardiovascular mortality in American Indians: the Strong Heart Study. J Cardiovasc Electrophysiol. 2005;16(9):945–51. doi: 10.1111/j.1540-8167.2005.40808.x. [DOI] [PubMed] [Google Scholar]
- 40.Oikarinen L, Nieminen MS, Viitasalo M, et al. QRS duration and QT interval predict mortality in hypertensive patients with left ventricular hypertrophy: the Losartan Intervention for Endpoint Reduction in Hypertension Study. Hypertension. 2004;43(5):1029–34. doi: 10.1161/01.HYP.0000125230.46080.c6. [DOI] [PubMed] [Google Scholar]


