

Abstract
Background:
Low urine pH is related to obesity and insulin resistance, which are components of metabolic syndrome (MS). The aim of this study was to identify the relation between a low urine pH and MS after controlled for other covariates including demographic and lifestyle factors in adult Korean population.
Materials and Methods:
We analyzed data from the 2010 Korea National Health and Nutrition Examination Survey, a cross-sectional and nationally representative survey and 1960 men and 2702 women were included in this study. Study subjects were divided into the group with urine pH <5.5 and the group with urine pH ≥5.5 refer to literature. We then evaluated the association between low urine pH and MS.
Results:
After adjusting for age, sex, smoking status, drinking status, regular exercise, and blood urea nitrogen level, the odds ratio (OR) for the presence of MS in the group with urine pH <5.5 was 1.350 (95% confidence interval [95% CI]: 1.158-1.573) using the American Heart Association/National Heart, Lung, and Blood Institute criteria or 1.304 (95% CI: 1.082-1.572) using the International Diabetes Federation criteria. Among MS components, elevated fasting glucose (OR: 1.231, 95% CI: 1.058-1.433, P = 0.007) and elevated triglyceride (TG) (OR: 1.389, 95% CI: 1.189-1.623, P < 0.001) showed a significantly high OR.
Conclusion:
The findings confirmed that low urine pH is associated with MS in the Korean population. Among MS components, elevated fasting glucose and elevated TG showed a significantly high OR.
Keywords: Association, insulin resistance, metabolic syndrome, urine
INTRODUCTION
Metabolic syndrome (MS) is a combined expression of the characteristics of metabolic disorders including hypertension, insulin resistance, obesity, dyslipidemia,[1] which increase the risk of developing type 2 diabetes mellitus, renal diseases, and cardiovascular disease.[2,3] Adult MS is prevalent, with an incidence rate of 20-30% in most countries.[4]
Among various biologic markers, the homeostatic model assessment insulin resistance index (HOMA-IR) and gamma-glutamyl transferase (GGT) levels are the most strongly related to MS;[5] levels of high-sensitivity C-reactive protein,[6] cystatin C,[7] uric acid,[8] and alanine aminotransferase (ALT)[9] have also been associated with MS. In addition, some studies have reported a relationship of unduly acidic urine (pH <5.5) with obesity, diabetes mellitus, and insulin resistance, which are components of MS.[10,11,12] Another study reported an inverse correlation between urine pH and the number of MS components,[13] and a recent cohort study proposed a low level of urine pH as both a causative factor and a predictive factor for the development of MS.[14] However, in these studies, influential factors affecting metabolic disease, such as smoking, alcohol consumption, and exercise, were not considered.
Therefore, the aim of this study was to identify the relation between a low urine pH and MS after controlled for other covariates including demographic and lifestyle factors in adult Korean population using a nationally representative sample.
MATERIALS AND METHODS
Study subjects
The subjects and data were obtained from the fifth Korea National Health and Nutrition Examination Surveys (KNHANES V-1), a cross-sectional and nationally representative survey with a stratified, multistage, probability sampling design conducted by the Korea Centers for Disease Control and Prevention in 2010. The KNHANES consisted of the Health Interview Survey, Health Examination, and Nutrition Survey. Detailed information regarding the design of the survey has been reported previously.[15] In brief, the fifth (2010-2012) KNHANES were conducted annually using a rolling sampling design. The target population of the survey was noninstitutionalized civilians older than 1-year in South Korea. Sampling units were defined based on geographic area, gender, and age group using the household registries from the National Census Registry. A total of 10,938 people from 3840 households in 192 national districts were randomly sampled and 8473 (77.5% of the target population) participated in the survey, respectively.
Among adults aged >19 years who fasted for >8-h before undergoing a urine test, those with a known history of renal failure, those with a serum creatinine level ≥1.2 mg/dL, and those who were pregnant were excluded from the survey. A total of 4662 adults (1960 men and 2702 women) were included in this study.
Measurements
Sociodemographic characteristics, medical and surgical histories, medication history, anthropometric data, blood and urine tests and nutritional data were examined. Smoking status was subcategorized into “never smoker,” “former smoker,” and “current smoker,” and drinking status was subcategorized into “drinking alcohol” and “not.” Alcohol drinking was indicated as “yes” for participants who consumed at least one glass of alcohol every month over the last year. Regular exercise was defined as moderate occupational or physical activities (slow-paced swimming; playing doubles tennis, volleyball, badminton, or table tennis; and carrying light objects for >30 min 5 times/week) or vigorous occupational or physical activities (jogging, climbing a mountain, fast-paced cycling or swimming, playing football or basketball, jumping rope, playing squash, playing singles tennis, and carrying heavy objects for >20 min 3 times/week). The exercise group was defined as subjects who had been performing regular exercise. Regular walking was defined as walking for >30 min 5 times/week.
Height and weight were measured down to the first decimal place, and body mass index (BMI) was calculated as body weight (kg) divided by the square of height (m). Using a tape measure waist circumference (WC) was measured from the half-way point between the lower line of the last rib and the upper line of the iliac crest when a subject exhaled and was measured down to the first decimal place. Blood pressure (BP) was measured 3 times with an interval of 30 s after resting for 5 min in a sitting position. The final BP was defined as the average BP of the second and third BP measurements.
Blood samples were collected from the antecubital vein following an 8-h fasting period. The samples were kept in a refrigerator once they were processed and delivered to the central laboratory in Seoul. The analysis of all samples was performed within 24-h. Measurement of fasting glucose, total cholesterol, triglyceride (TG), high-density lipoprotein cholesterol (HDL-C), low-density lipoprotein cholesterol (LDL-C), ALT, and GGT levels was performed using an enzyme technique (Hitachi Automatic Analyzer 7600, Hitachi, Japan). Blood urea nitrogen (BUN) was measured with a kinetic ultraviolet method and creatinine was measured with a colorimetric method. Insulin level was measured with a radioimmunoassay using a 1470 WIZARD gamma-counter (PerkinElmer, Finland). Creatinine clearance was calculated using Cockcroft-Gault equation.[16] HOMA-IR was calculated as (fasting plasma insulin [μU/mL] × fasting plasma glucose [FPG] [mg/dL])/(22.5 × 18.182).[17] The quantitative insulin-sensitivity check index (QUICKI) was calculated as 1/(log fasting insulin [μU/mL] + log fasting blood sugar [mg/dL]).[18]
The early morning midstream urine was collected for urine chemistry following an 8-h fasting period and analyzed using an automated urine dipstick analyzer (Urisys 2400, Roche, Germany). Urine specimen was immediately refrigerated after collection and analyzed in 24-h. The analysis of nutritional values, including total calories, protein, fat, fiber, and sodium was performed by trained dietitians on the basis of the individuals’ 24-h dietary recall method.
Definition of metabolic syndrome
Metabolic syndrome was defined according to the 2005 American Heart Association/National Heart, Lung, and Blood Institute (AHA/NHLBI)[19] and International Diabetes Federation (IDF) criteria.[20] The WC thresholds for the definition of abdominal obesity in Koreans were determined as 90 cm for men and 85 cm for women.[21]
Statistical analysis
Taking into account the complex sampling design of the KNHANES, to minimize selection errors, the results were estimated with consideration for the primary sampling unit and stratification variables and sampling weights.
Descriptive data were expressed as the mean value (standard error) or number (%). The independent t-test was employed for analysis of continuous variables and the Chi-square test for analysis of categorical variables. The differences in general characteristics, sociodemographic parameters, dietary parameters, anthropometric parameters, general characteristics of the group with urine pH <5.5 and the group with urine pH ≥5.5, biochemical results, and risk factors for MS were analyzed according to variables using the independent t-test and Chi-square test. Multiple logistic regression was used for the analysis of relative risk factors of those with urine pH <5.5 compared with those with urine pH ≥5.5. Age and sex were primarily adjusted, and BUN, smoking status, drinking status, and regular exercise were secondarily adjusted for the analysis. Statistical significance was defined as a P < 0.05. Data were analyzed using SPSS version 18.0 for Windows (SPSS Inc., Chicago, IL, USA).
RESULTS
Baseline characteristics
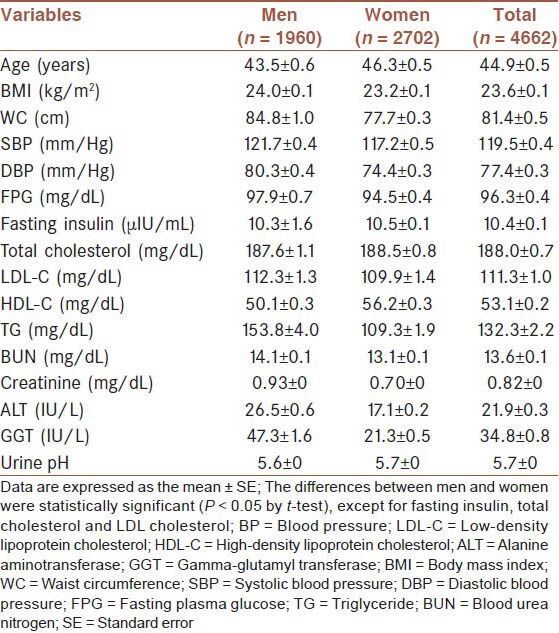
The general characteristics of the subjects are shown in Table 1. In total, 1960 men and 2702 women were included in the analysis. The average age was 44.9 years and the mean BMI was 23.6 kg/m2. The mean FPG was 96.3 mg/dL and the mean urine pH was 5.7. Fasting insulin, total cholesterol, and LDL-C levels were not statistically different between men and women (P > 0.05).
Table 1.
Baseline characteristics of study subjects
Characteristics of study variables by urine pH
The group with urine pH <5.5 and the group with urine pH ≥5.5 were compared for multiple parameters including sociodemographic, dietary, anthropometric, kidney function, and metabolic parameters [Table 2]. No statistically significant difference in age and sex was observed between those with urine pH <5.5 and those with urine pH ≥5.5. No differences in alcohol consumption, regular walking, as well as calories, protein, fat, fiber, and sodium consumption were observed between the groups. Conversely, significant differences in smoking and regular exercise were observed between the groups (P = 0.001 and P = 0.032, respectively).
Table 2.
Characteristics of study variables by urine pH
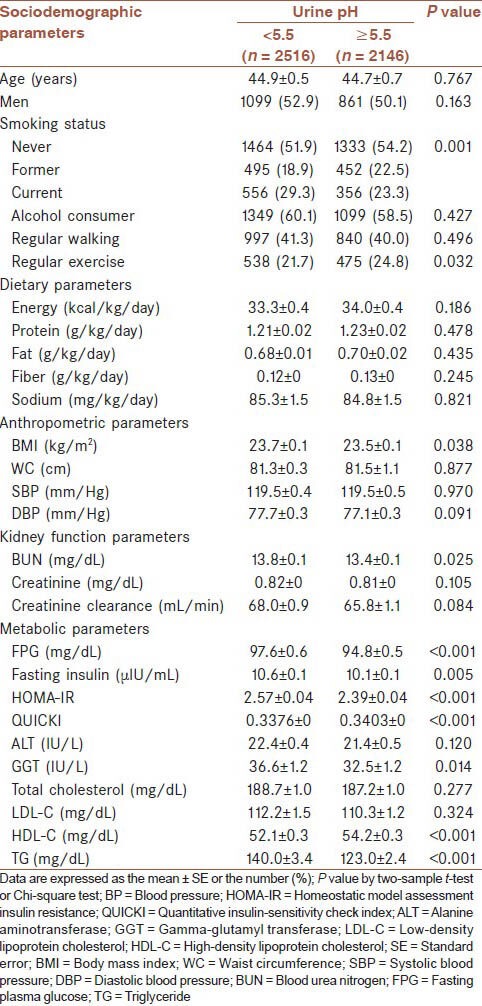
The BMI of those with urine pH <5.5 was higher than that of those with urine pH ≥5.5 (P = 0.038); however, no difference in abdominal circumference and BP was observed. BUN levels differed significantly between the groups; however, no significant difference in creatinine levels and creatinine clearance were observed between the groups. The fasting glucose level, insulin level, and HOMA-IR of subjects with urine pH <5.5 were higher than subjects with urine pH ≥5.5 (P < 0.001, P = 0.005, and P < 0.001, respectively), but the QUICKI was significantly lower (P < 0.001). The group with urine pH <5.5 showed a high GGT level (P = 0.014). No significant difference in LDL-C level was observed between the groups; however, the HDL-C level was lower and the TG level was higher in the group with urine pH <5.5 (P < 0.001 and P < 0.001, respectively).
Prevalence of metabolic syndrome and its components by urine pH
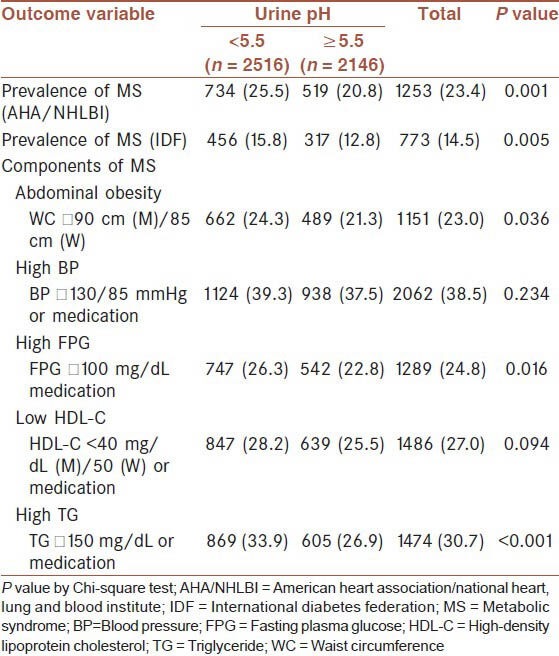
Applying both AHA/NHLBI and IDF criteria, MS was more prevalent in subjects with urine pH <5.5 than subjects with urine pH ≥5.5 (P = 0.001 and P = 0.005, respectively) [Table 3]. In the group with urine pH <5.5, 24.3% had abdominal obesity, which was more than the percentage of the group with urine pH ≥5.5 (21.3%; P = 0.036), and 26.3% of those with urine pH <5.5 had an abnormal fasting glucose level (fasting glucose ≥100 mg/dL or medication), which was more than the percentage of the group with urine pH ≥5.5 (22.8%; P = 0.016). The percentage with high TG levels was also significantly higher in the group with urine pH <5.5, with 33.9% having an abnormal value (P < 0.001). No differences in metabolic components for elevated BP and low HDL-C were observed between the groups.
Table 3.
Prevalence of MS and its components by urine pH
Odds ratio of metabolic syndrome and its components by urine pH
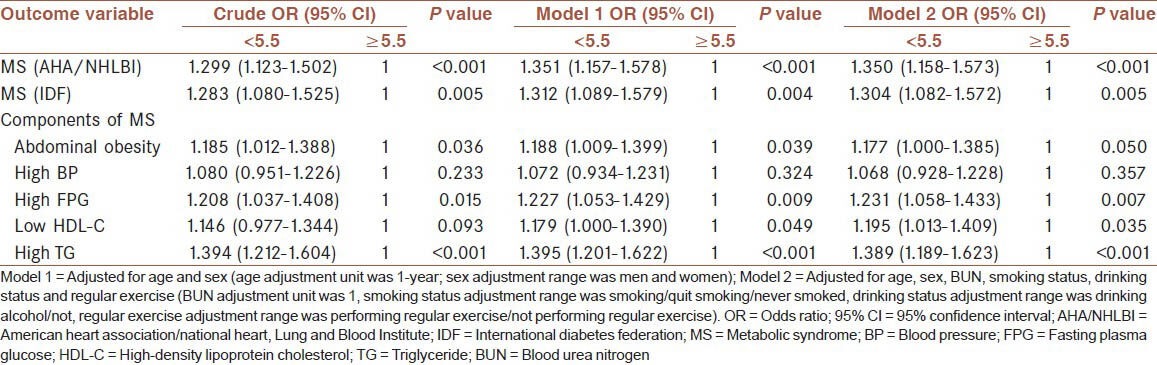
The crude odds ratio (ORs), age-and sex-adjusted ORs (model 1), and multivariable-adjusted ORs (model 2) for MS and the components of MS by urine pH status are shown in Table 4. After adjusting for age, sex, smoking status, drinking status, regular exercise, and BUN level, the OR for the presence of MS in the group with urine pH <5.5 was 1.350 (95% confidence interval [95% CI], 1.158-1.573, P < 0.001) using AHA/NHLBI criteria or 1.304 (95% CI, 1.082-1.572, P = 0.005) using the IDF criteria. Among MS components, elevated fasting glucose (OR = 1.231, 95% CI: 1.058-1.433, P = 0.007), reduced HDL-C (OR = 1.195, 95% CI: 1.013-1.409, P = 0.035), and elevated TG level (OR = 1.389, 95% CI: 1.189-1.623, P < 0.001) showed significantly high ORs.
Table 4.
OR of MS and its components by urine pH
DISCUSSION
In this cross-sectional study, we suggested that urine pH <5.5 is associated with MS. Among MS components, elevated fasting glucose and elevated TG showed a significantly high OR.
It is known that urine pH decreases with aging,[22] with a high protein diet and low fiber diet,[23,24] and when renal function is deteriorated.[25] In addition, another study showed that increased fatty acid provision associated with low urine pH.[26] However, the results of this study show that age, protein intake, lipid intake, and fiber intake did not affect urine pH, although smoking status and the regular exercise did affect urine pH. Considering the difference of serum BUN levels between the groups, we believed that our failure to present the influence of a high protein diet resulted from our failure to perform an accurate assessment of eating habits because we used a 24-h recollection survey for diet assessment.
The acid-base balance of urine is regulated according to production and excretion of NH3, a urinary buffer. In patients with insulin resistance, production of NH3 from proximal tubules is reduced and ammonia excretion is also reduced accordingly, resulting in low urine pH.[27] In addition, in patients with insulin resistance, sodium absorption is increased because of hyperinsulinemia, which also lowers urine pH.[24] Insulin resistance in subjects with MS is believed to be associated with a lower urine pH; this is supported by the strong relation between hyperglycemia and urine pH presented in this study.
The current findings are consistent with those from previous studies.[13,14,28] In a study of 148 people who did not have urolithiasis or renal failure, using 24-h urine collection, a negative correlation was observed between blood glucose, systolic BP, triglyceridemia, and urine pH, and a positive correlation was observed between serum HDL-C level and urine pH.[13] In another study conducted in 1503 male subjects, a low urine pH showed an association with greater WC; insulin resistance; and levels of fasting glucose, glycosylated hemoglobin, serum TG, and HDL-C.[28] In the above-mentioned study, BP was not associated with a low urine pH value, and this result was reconfirmed in this study. In this study, WC did not show a statistically significant OR value. This was believed to be due to various unmeasured confounding factors affecting urine pH that were modified before the results were deducted. A recent retrospective cohort study conducted in Japan[14] reported that a low urine pH is a causative factor for the development of MS. However, important confounding variables related to the prevalence of MS, such as smoking habit, alcohol intake, and dietary habit, were not investigated in this study.
To the best of our knowledge, this is the only study examining the association between urine pH and MS after controlled for other covariates including demographic and lifestyle factors. The urine pH test, using a urine dipstick, is regarded as a relatively simple and noninvasive method, and risk factors for MS should be assessed if urine pH <5.5.
This study has a few limitations that need to be addressed. The first is that the nutritional assessment was performed using a 24-h dietary recall method. In this study, daily protein intake was not associated with urine pH. After review of the results of another study examining changes in urine pH according to diet,[23] we believe that the relation between diet and urine pH should be examined using a more accurate nutritional assessment. The second limitation is the absence of information regarding urolithiasis. The third limitation is that spot urine samples were used instead of 24-h urine samples. However, it is known that spot urine pH was correlated with 24-h urine pH[29] and fasting early morning samples were used in this study. We identified urinary pH using urine dipstick analyzers, and it is another limitation because this test method is limited to determine the exact level of urine pH. However, there were prior studies that measured urine pH using urine dipstick test.[14,28] The final limitation is that this study was conducted as a cross-sectional study; therefore, the order of the incidence between a low urine pH and MS cannot be clearly identified. Despite these limitations, our findings are significant because this is a large-scale study including representative Korean adults.
CONCLUSION
This large scale cross-sectional study confirmed the association between low urine pH and MS in the Korean population.
AUTHORS’ CONTRIBUTIONS
All authors have contributed in designing and conducting the study. All authors have assisted in preparation of the first draft of the manuscript or revising it critically for important intellectual content. All authors have read and approved the content of the manuscript and confirmed the accuracy or integrity of any part of the work.
Footnotes
Source of Support: Nil
Conflict of Interest: None declared.
REFERENCES
- 1.Eckel RH, Alberti KG, Grundy SM, Zimmet PZ. The metabolic syndrome. Lancet. 2010;375:181–3. doi: 10.1016/S0140-6736(09)61794-3. [DOI] [PubMed] [Google Scholar]
- 2.Wilson PW, D’Agostino RB, Parise H, Sullivan L, Meigs JB. Metabolic syndrome as a precursor of cardiovascular disease and type 2 diabetes mellitus. Circulation. 2005;112:3066–72. doi: 10.1161/CIRCULATIONAHA.105.539528. [DOI] [PubMed] [Google Scholar]
- 3.Locatelli F, Pozzoni P, Del Vecchio L. Renal manifestations in the metabolic syndrome. J Am Soc Nephrol. 2006;17:S81–5. doi: 10.1681/ASN.2005121332. [DOI] [PubMed] [Google Scholar]
- 4.Grundy SM. Metabolic syndrome pandemic. Arterioscler Thromb Vasc Biol. 2008;28:629–36. doi: 10.1161/ATVBAHA.107.151092. [DOI] [PubMed] [Google Scholar]
- 5.Lee JG, Lee S, Kim YJ, Jin HK, Cho BM, Kim YJ, et al. Multiple biomarkers and their relative contributions to identifying metabolic syndrome. Clin Chim Acta. 2009;408:50–5. doi: 10.1016/j.cca.2009.07.006. [DOI] [PubMed] [Google Scholar]
- 6.Rutter MK, Meigs JB, Sullivan LM, D’Agostino RB, Sr, Wilson PW. C-reactive protein, the metabolic syndrome, and prediction of cardiovascular events in the Framingham Offspring Study. Circulation. 2004;110:380–5. doi: 10.1161/01.CIR.0000136581.59584.0E. [DOI] [PubMed] [Google Scholar]
- 7.Servais A, Giral P, Bernard M, Bruckert E, Deray G, Isnard Bagnis C. Is serum cystatin-C a reliable marker for metabolic syndrome? Am J Med. 2008;121:426–32. doi: 10.1016/j.amjmed.2008.01.040. [DOI] [PubMed] [Google Scholar]
- 8.Onat A, Uyarel H, Hergenç G, Karabulut A, Albayrak S, Sari I, et al. Serum uric acid is a determinant of metabolic syndrome in a population-based study. Am J Hypertens. 2006;19:1055–62. doi: 10.1016/j.amjhyper.2006.02.014. [DOI] [PubMed] [Google Scholar]
- 9.Marchesini G, Brizi M, Bianchi G, Tomassetti S, Bugianesi E, Lenzi M, et al. Nonalcoholic fatty liver disease: A feature of the metabolic syndrome. Diabetes. 2001;50:1844–50. doi: 10.2337/diabetes.50.8.1844. [DOI] [PubMed] [Google Scholar]
- 10.Maalouf NM, Sakhaee K, Parks JH, Coe FL, Adams-Huet B, Pak CY. Association of urinary pH with body weight in nephrolithiasis. Kidney Int. 2004;65:1422–5. doi: 10.1111/j.1523-1755.2004.00522.x. [DOI] [PubMed] [Google Scholar]
- 11.Taylor EN, Curhan GC. Body size and 24-hour urine composition. Am J Kidney Dis. 2006;48:905–15. doi: 10.1053/j.ajkd.2006.09.004. [DOI] [PubMed] [Google Scholar]
- 12.Cameron MA, Maalouf NM, Adams-Huet B, Moe OW, Sakhaee K. Urine composition in type 2 diabetes: Predisposition to uric acid nephrolithiasis. J Am Soc Nephrol. 2006;17:1422–8. doi: 10.1681/ASN.2005121246. [DOI] [PubMed] [Google Scholar]
- 13.Maalouf NM, Cameron MA, Moe OW, Adams-Huet B, Sakhaee K. Low urine pH: A novel feature of the metabolic syndrome. Clin J Am Soc Nephrol. 2007;2:883–8. doi: 10.2215/CJN.00670207. [DOI] [PubMed] [Google Scholar]
- 14.Hara S, Tsuji H, Ohmoto Y, Amakawa K, Hsieh SD, Arase Y, et al. High serum uric acid level and low urine pH as predictors of metabolic syndrome: A retrospective cohort study in a Japanese urban population. Metabolism. 2012;61:281–8. doi: 10.1016/j.metabol.2011.06.026. [DOI] [PubMed] [Google Scholar]
- 15.Lee BK, Kim Y. Iron deficiency is associated with increased levels of blood cadmium in the Korean general population: Analysis of 2008-2009 Korean National Health and Nutrition Examination Survey data. Environ Res. 2012;112:155–63. doi: 10.1016/j.envres.2011.10.013. [DOI] [PubMed] [Google Scholar]
- 16.Gault MH, Longerich LL, Harnett JD, Wesolowski C. Predicting glomerular function from adjusted serum creatinine. Nephron. 1992;62:249–56. doi: 10.1159/000187054. [DOI] [PubMed] [Google Scholar]
- 17.Valsamakis G, Chetty R, Anwar A, Banerjee AK, Barnett A, Kumar S. Association of simple anthropometric measures of obesity with visceral fat and the metabolic syndrome in male Caucasian and Indo-Asian subjects. Diabet Med. 2004;21:1339–45. doi: 10.1111/j.1464-5491.2004.01361.x. [DOI] [PubMed] [Google Scholar]
- 18.Lee S, Choi S, Kim HJ, Chung YS, Lee KW, Lee HC, et al. Cutoff values of surrogate measures of insulin resistance for metabolic syndrome in Korean non-diabetic adults. J Korean Med Sci. 2006;21:695–700. doi: 10.3346/jkms.2006.21.4.695. [DOI] [PMC free article] [PubMed] [Google Scholar]
- 19.Grundy SM, Cleeman JI, Daniels SR, Donato KA, Eckel RH, Franklin BA, et al. Diagnosis and management of the metabolic syndrome: An American Heart Association/National Heart, Lung, and Blood Institute Scientific Statement. Circulation. 2005;112:2735–52. doi: 10.1161/CIRCULATIONAHA.105.169404. [DOI] [PubMed] [Google Scholar]
- 20.Alberti KG, Zimmet P, Shaw J. Metabolic syndrome — A new world-wide definition. A Consensus Statement from the International Diabetes Federation. Diabet Med. 2006;23:469–80. doi: 10.1111/j.1464-5491.2006.01858.x. [DOI] [PubMed] [Google Scholar]
- 21.Lee SY, Park HS, Kim DJ, Han JH, Kim SM, Cho GJ, et al. Appropriate waist circumference cutoff points for central obesity in Korean adults. Diabetes Res Clin Pract. 2007;75:72–80. doi: 10.1016/j.diabres.2006.04.013. [DOI] [PubMed] [Google Scholar]
- 22.Agarwal BN, Cabebe FG. Renal acidification in elderly subjects. Nephron. 1980;26:291–5. doi: 10.1159/000182004. [DOI] [PubMed] [Google Scholar]
- 23.Kanbara A, Miura Y, Hyogo H, Chayama K, Seyama I. Effect of urine pH changed by dietary intervention on uric acid clearance mechanism of pH-dependent excretion of urinary uric acid. Nutr J. 2012;11:39. doi: 10.1186/1475-2891-11-39. [DOI] [PMC free article] [PubMed] [Google Scholar]
- 24.Bell DS. Beware the low urine pH - The major cause of the increased prevalence of nephrolithiasis in the patient with type 2 diabetes. Diabetes Obes Metab. 2012;14:299–303. doi: 10.1111/j.1463-1326.2011.01519.x. [DOI] [PubMed] [Google Scholar]
- 25.Schwartz WB, Relman AS. Acidosis in renal disease. N Engl J Med. 1957;256:1184–6. doi: 10.1056/NEJM195706202562505. [DOI] [PubMed] [Google Scholar]
- 26.Bobulescu IA, Dubree M, Zhang J, McLeroy P, Moe OW. Effect of renal lipid accumulation on proximal tubule Na+/H+ exchange and ammonium secretion. Am J Physiol Renal Physiol. 2008;294:F1315–22. doi: 10.1152/ajprenal.00550.2007. [DOI] [PMC free article] [PubMed] [Google Scholar]
- 27.Sakhaee K, Adams-Huet B, Moe OW, Pak CY. Pathophysiologic basis for normouricosuric uric acid nephrolithiasis. Kidney Int. 2002;62:971–9. doi: 10.1046/j.1523-1755.2002.00508.x. [DOI] [PubMed] [Google Scholar]
- 28.Otsuki M, Kitamura T, Goya K, Saito H, Mukai M, Kasayama S, et al. Association of urine acidification with visceral obesity and the metabolic syndrome. Endocr J. 2011;58:363–7. doi: 10.1507/endocrj.k10e-319. [DOI] [PubMed] [Google Scholar]
- 29.Welch AA, Mulligan A, Bingham SA, Khaw KT. Urine pH is an indicator of dietary acid-base load, fruit and vegetables and meat intakes: Results from the European Prospective Investigation into Cancer and Nutrition (EPIC)-Norfolk population study. Br J Nutr. 2008;99:1335–43. doi: 10.1017/S0007114507862350. [DOI] [PubMed] [Google Scholar]