Abstract
Background:
Non-contrast computed tomography (NCCT) is the diagnostic choice for renal stone disease. Knowing the composition of a stone before passage can help to choose a better management. We sought to determine whether the Hounsfield unit (HU) measured by NCCT can predict the composition.
Materials and Methods:
180 urinary stones from patients seen at Shariati, Kashani and Alzahra CT centers, were submitted to stone analysis, 2012. All scans had been interpreted for HU. Primitive statistical findings showed an effect of size on the HU. To avoid confounding bias, Hounsfield Density (HD: HU/largest transverse diameter) was calculated. Statistical comparisons were performed between composition with HU and HD.
Results:
Calcium stones had specific ranges for HD and HU. No non-calcium stone had HU more than 448 and HD greater than 50 HU/mm.
Conclusion:
NCCT can differentiate just Calcium from non-calcium stones.
Keywords: Hounsfield density, Hounsfield unit, noncontrast computed tomography, urinary stone type
INTRODUCTION
Urolithiasis is one of the most common problems of the urinary system. Nearly 10% of the population will suffer from a renal stone at least once in their lifetime.[1]
Kidney stone disease is a substantial health problem with significant pain, suffering, and sanitary costs.[2]
Routine use of noncontrast computed tomography (NCCT) has revolutionized the imaging evaluation of renal stone disease, nearly completely replacing other imaging methods for the diagnosis of acute ureteral obstruction by renal stones.[1]
In addition, NCCT is superior in its ability to detect nonurologic causes of flank pain and to differentiate calculi from other ureteral abnormalities (neoplasm, stricture, and blood clot).[3,4]
There are different ways to manage of urinary stones and also different factors affecting the approaches such as fragility of calculi. Knowing the composition of a urinary stone can help to determine appropriate management and avoid waist of sanitary costs due to ineffective treatment before stone analysis by laboratory.[2,5]
There seems to be a correlation between urinary stone composition and Hounsfield Unit (HU) of NCCT according to prior studies performed in other countries.[2,3,4,5,6] We decided to perform this study in our population (Iran) because geographic location and ethnic background match stone formation risk factors.[7,8]
The aim of this survey was to determine if the composition of urinary stone can be predicted by measuring the HU of calculi with a NCCT.
MATERIALS AND METHODS
This study was cross-sectional, simple random sample calculated 180 volume size. The first evaluation was performed on 250 patients with renal stones seen at computed tomography (CT) centers of Shariati, Kashani, and Alzhra for stone analysis after spontaneous passage or by the therapeutic managements (2011-2012).
In these centers, the scanner calibration, for appropriate HU was checked by a radiology technician before each exam.
A helical breath holding NCCT with 120 kV, 200 mA, and 6 mm collimation was obtained by the “renal colic protocol.”
Each scan was interpreted by a radiologist, measured the stone size in its greatest transverse diameter and HU of the stone (mean HU between 2 and 5 pixel points of the stone surface area, depending on the stone area). All stones were analyzed by the biomedical laboratories and the composition percentage of calculi was reported. The stones included were “pure stones (containing 100% of one component)” and “near pure stones (containing two mixed components and at least 80% of one major component).” Other cases contained >2 components and were not classified as “pure” or “near pure” were excluded; therefore, 180 urinary stones, visualized on NCCT, were evaluated in five groups as calcium oxalate, calcium phosphate, uric acid, struvite, and cystine. Because of the relationship between size and HU, Hounsfield density (HD) was identified as HU/greatest transverse diameter of the stone (mm) same as other studies.[5] We could delete the possible confounding bias by this way, and the effect of stone size was removed.
Analysis with SPSS software (IBM SPSS, Version 15, ANOVA, t-test, and receiver operating characteristic [ROC] curves) was performed, and P value was counted in the significant range (0.001).
RESULTS
Of the 180 “pure” and “near pure” stones, 127 were calcium oxalate, 20 were calcium phosphate, 15 were uric acid, 12 were struvite and 6 were cystine. Results of data processing are summarized as the following Table 1 and Figures 1–5. After analysis with SPSS (ANOVA, and ROC curves) we obtained these findings:
Table 1.
Ranges and Means with 95% confidence interval for HU and HD of Urinary Stones
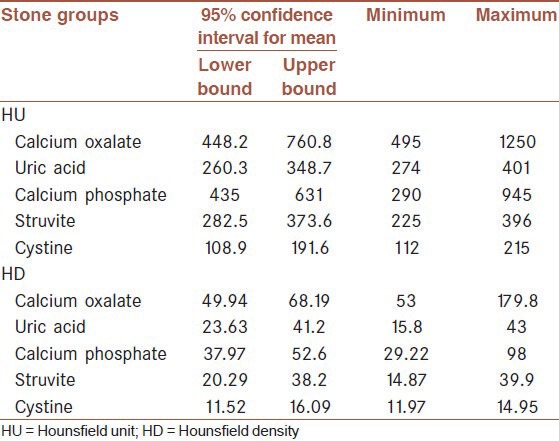
Figure 1.
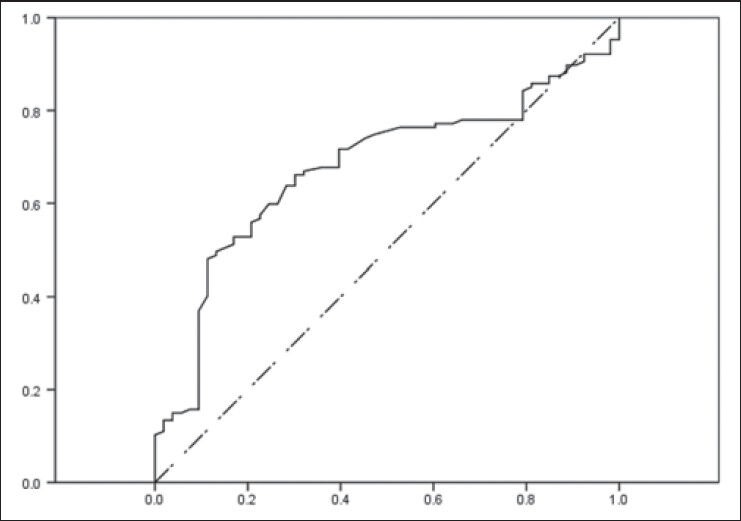
Receiver operating characteristic curve for Hounsfield density of calcium oxalate. Vertical axis is sensitivity and horizontal axis is (1-specifisity). Source of the curve: Reference line is dot-line
Figure 5.
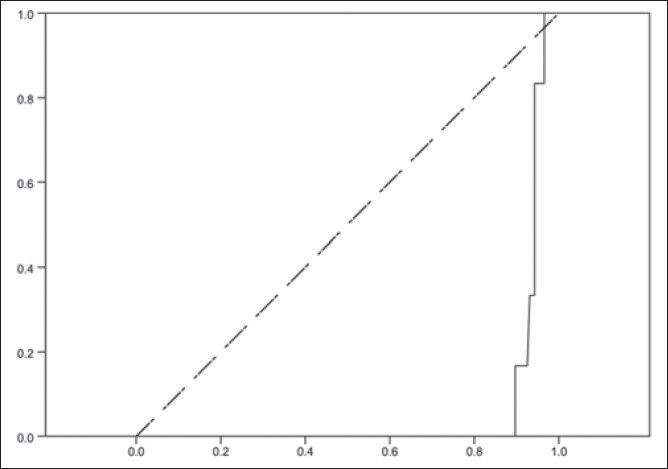
Receiver operating characteristic curve for Hounsfield density of cystine. Vertical axis is sensitivity and horizontal axis is (1-specifisity). Source of the curve: Reference line is dot-line
Figure 2.
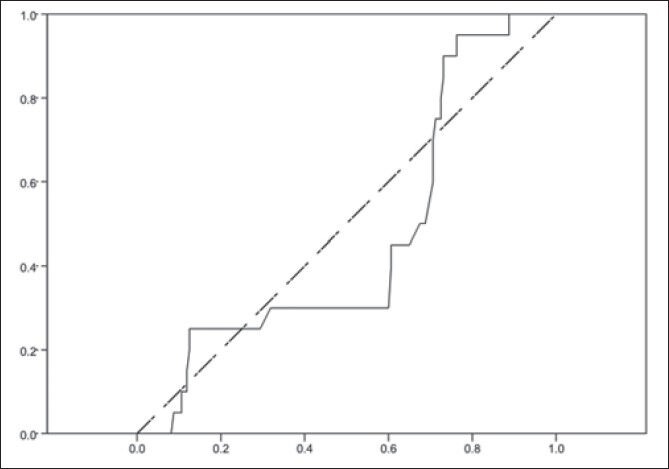
Receiver operating characteristic curve for Hounsfield density of calcium phosphate. Vertical axis is sensitivity and horizontal axis is (1-specifisity). Source of the curve: Reference line is dot-line
Figure 3.
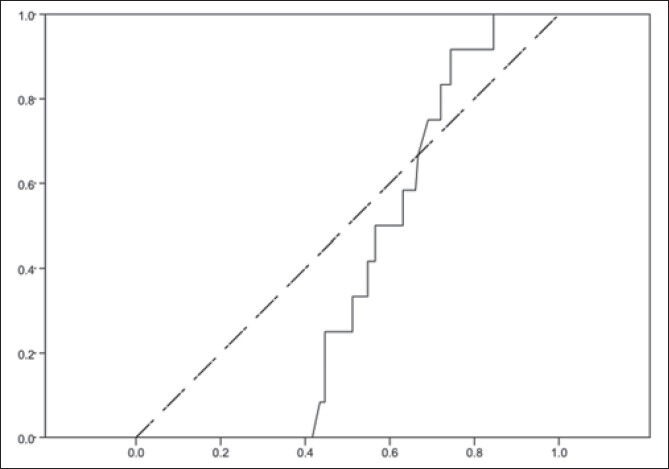
Receiver operating characteristic curve for Hounsfield density of uric acid. Vertical axis is sensitivity and horizontal axis is (1-specifisity). Source of the curve: Reference line is dot-line
Figure 4.
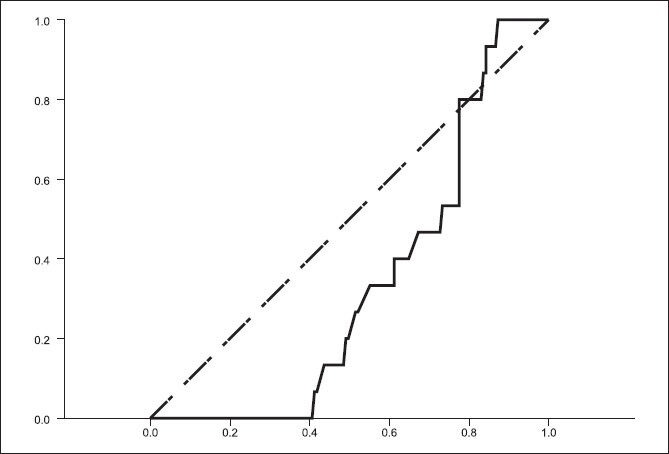
Receiver operating characteristic curve for Hounsfield density of struvite. Vertical axis is sensitivity and horizontal axis is (1-specifisity). Source of the curve: Reference line is dot-line
A relationship between composition of stones with HU (P = 0.001), size (P = 0.001) and HD (P < 0.0001) were seen. According to the Table 1, no overlap was found between calcium oxalate and others, except calcium phosphate. Therefore, HU and HD for all calcium stones were in the special range, and no noncalcium stone had an HU >448, and HD >50 HU/mm.
No differentiation was found between the calcium phosphate and other stones [Table 1].
There also seemed to be a smaller overlap between cystine stone composition and others in HU and HD (HU: [112-215 HU], HD: [11.9-14.95 HU/mm]), but regarding to ROC curve of cystine, the configuration of the curve did not confirm. It could be due to inadequate cystine stones.
Uric acid and struvite stones were not greatly different, and there was a significant overlap [Table 1].
Receiver operating characteristic curves showed acceptable sensitivity and specificity about HD of calcium oxalate, but not for other stones [Figures 1–5].
DISCUSSION
In this study, we found no significant difference between HU and HD of calcium oxalate and calcium phosphate stones; thus, they were analyzed as “calcium stones” collectively. Calcium stones had the distinct range of HU and HD without any overlap in comparison with another types of renal stones. They had HU >448 and HD >50 in all of the CT radio-densities.
It was found that HD and HU could not predictable for the exact composition in cystine, uric acid, and struvite stones.
In the previous studies with the similar focus, some were relatively successful in determining urinary stone composition in vitro from HU and/or HD on NCCT.
In all studies, there was a relationship between the stone composition and CT radio-density.
Calcium oxalate stones were differentiated easily from other noncalcium stones like other surveys.[5,6]
In contrary to another study,[6] we could not distinguish Uric acid stones by using HU or HD.
Unlike other studies, cystine stones in our study had less overlap of HU and HD with other stones. It looks to be predictive by CT radio-density, but this finding was not confirmed by other data processes. It can be assessed with the future studies containing more cases for cystine stones particularly.
AUTHORS’ CONTRIBUTIONS
All authors have contributed in designing and conducting the study. PSSH carried out the design and coordinated the study and prepared the manuscript, MK participated in most of the design and prepared the manuscript. BA provided assistance in collecting samples of the study, MJ provided assistance for statistical experiments and interpretations. All authors have read and approved the content of the manuscript.
Footnotes
Source of Support: Nil
Conflict of Interest: None declared.
REFERENCES
- 1.Brant WE, Helms CA, Badawi RD. Fundamentals of Diagnostic Radiology. 3rd ed. Ch 34, Sect VIII. Lippincott Williams & Wilkins: A Wolters Kluver business; 2007. Renal stone disease; pp. 889–91. [Google Scholar]
- 2.Curhan GC, Curhan SG. Dietary factors and kidney stone formation. Compr Ther. 1994;20:485–9. [PubMed] [Google Scholar]
- 3.Dalrymple NC, Verga M, Anderson KR, Bove P, Covey AM, Rosenfield AT, et al. The value of unenhanced helical computerized tomography in the management of acute flank pain. J Urol. 1998;159:735–40. [PubMed] [Google Scholar]
- 4.Youssefzadeh D, Katz DS, Lumerman JH. Unenharnced helical CT in the evaluation of suspected renal colic. AUA Update Series 18: lesson 26. 1999 [Google Scholar]
- 5.Motley G, Dalrymple N, Keesling C, Fischer J, Harmon W. Hounsfield unit density in the determination of urinary stone composition. Urology. 2001;58:170–3. doi: 10.1016/s0090-4295(01)01115-3. [DOI] [PubMed] [Google Scholar]
- 6.Mostafavi MR, Ernst RD, Saltzman B. Accurate determination of chemical composition of urinary calculi by spiral computerized tomography. J Urol. 1998;159:673–5. [PubMed] [Google Scholar]
- 7.Litwin MS, Saigal CS. Ch. 08. Washington, DC: U.S. Government Publishing Office; 2007. Urolithiasis. Urologic Disease in America; pp. 281–5. [Google Scholar]
- 8.Stamatelou KK, Francis ME, Jones CA, Nyberg LM, Curhan GC. Time trends in reported prevalence of kidney stones in the United States: 1976-1994. Kidney Int. 2003;63:1817–23. doi: 10.1046/j.1523-1755.2003.00917.x. [DOI] [PubMed] [Google Scholar]


