

Abstract
Purpose
The overall goal is to develop MR Elastography (MRE) derived shear stiffness as a biomarker for the early identification of chemotherapy response, allowing dose, agent type and treatment regimen to be tailored on a per patient basis, improving therapeutic outcome and minimizing normal tissue toxicity. The specific purpose of this study is to test the feasibility of this novel biomarker to measure the treatment response in a well-known chemotherapy model.
Methods
Tumors were grown in the right flank of genetically modified mice by subcutaneous injection of DoHH2 (non-Hodgkin’s lymphoma) cells. MRE was used to quantify tumor stiffness before and after injection of a chemotherapeutic agent or saline. Histological tests were also performed on the tumors.
Results
A significant decrease (P < 0.0001) in MRE-derived tumor shear stiffness was observed within 4 days of chemotherapy treatment, while no appreciable change was observed in saline-treated tumors. No significant change in volume occurred at this early stage, but there were decreased levels of cellular proliferation in chemotherapy-treated tumors.
Conclusion
These results demonstrate that MRE-derived estimates of shear stiffness reflect an initial response to cytotoxic therapy and suggest that this metric could be an early and sensitive biomarker of tumor response to chemotherapy.
Keywords: cancer stiffness, MR Elastography, chemotherapy response, individualized medicine
Introduction
It is appreciated that chemotherapy is an effective option in the treatment of many cancers, either as a single-treatment regimen or as an adjunct therapy. Because these cytotoxic antineoplastic (i.e., chemotherapy) agents are nonspecific, indiscriminately targeting both normal and neoplastic cells undergoing cellular division, they often induce significant side effects.
The standard metric used to assess chemotherapy response is reduction in tumor size, measured by metabolic (e.g., PET) or anatomic (e.g., CT or MRI) imaging (1). While this clinical metric is known to correlate with treatment efficacy, there can be a significant delay between initiation of treatment and measured response determined by visible or measureable change in tumor size. This delay can be on the order of several treatment cycles of chemotherapy, or several weeks, increasing the probability of significant normal-tissue toxicity (2). In those circumstances, chemotherapy is either halted or significantly altered, resulting in a decrease in treatment efficacy. Therefore, there is a critical need for methods capable of detecting an earlier response to treatment than current clinical methodologies.
Patient-specific approaches to chemotherapy may address this limitation by tailoring individual therapies based on an early identified response. Such a strategy has a two-fold advantage. First, it has the potential to improve therapeutic response by allowing for dose escalation in responders. Second, it allows for the alteration of chemotherapy regimens in non-responders before side effects can develop.
We hypothesize that changes in tumor mechanical properties may provide early evidence of therapeutic response, particularly with regards to the administration of chemotherapy. Support for this is provided by data generated from methods for assessing the mechanical properties of a single cell, such as atomic force microscopy, micropipette aspiration and microplate stretchers (3). These techniques demonstrate that cancerous cells are typically softer than their non-malignant counterparts (4–7) and become significantly stiffer in response to chemotherapy (3,8). To test the hypothesis that chemotherapy treatment affects the stiffness of tissue, we propose using magnetic resonance elastography (MRE) – a phase-contrast imaging method used to quantify and spatially resolve tissue shear stiffness (9–12) – to measure macroscopic, in vivo changes in tumor stiffness following chemotherapy. Although MRE is capable of categorizing disease stage (10,13) and differentiating benign and malignant solid tumors (14,15), the sensitivity of MRE as a biomarker of chemotherapy treatment response remains largely unknown. In this study, we tested the feasibility of using MRE-derived estimates of tumor shear stiffness as a biomarker of response to chemotherapy in a lymphoma xenograft model in which response to chemotherapy is known and well-studied.
Methods
Animal Model
Forty male CB17/SCID mice (Harlan Sprague Dawley, Indianapolis, IN, USA), 6–8 weeks old, were used for all studies. All mice were maintained in a pathogen-free environment and were cared for using the standards outlined by the Mayo Clinic Institutional Animal Care and Use Committee (IACUC). The experimental protocol was also reviewed and approved by the Mayo Clinic IACUC. DoHH2 (non-Hodgkin’s lymphoma) cells (16) were injected subcutaneously into the right flank of all mice in this study (Fig. 1a). Tumors were allowed to grow until they were measurable, about 4 weeks. Five mice failed to grow tumors and were excluded from the study.
Figure 1.

Experimental setup and example data. (a) Experimental setup consisting of an enclosed RF transmit/receive coil placed inside the MR scanner. (b) Axial slice through the mouse at the level of the flank. The tumor is outlined in red. An MR-compatible needle, attached to an electromechanical driver, was inserted into the tumor (c) Example magnitude image of a coronal slice through the tumor with corresponding wave data and reconstructed elastogram. The white line represents 1 cm. In the elastogram, the checkerboard pattern indicates regions of poor wave signal-to-noise ratio that were excluded from the stiffness measurement.
Experimental Design
In vivo MRE was performed on mice using a specially designed experimental setup (Fig. 1b). Mice were wrapped in a plastic sheath to minimize extraneous movement and placed within an enclosed local transmit-receive birdcage coil. Mice were permitted to breathe freely and were maintained using an isoflurane inhalation anesthesia (Piramal Healthcare Limited, Andhra Pradesh, India). Tumor measurements were obtained after each MRE scan using a caliper (GENERAL, 6″ Dial Caliper) and tumor volume was calculated using the standard formula: v=a2b/2, where a=shortest and b=longest diameter (16).
Mice were divided into two groups: a control group (n = 8), and a chemotherapy group (n = 27). Following an initial scan to determine baseline stiffness, the control group received one intraperitoneal injection of normal saline while the chemotherapy group received 4 mg of a chemotherapeutic drug (cyclophosphamide monohydrate, ISOPAC®, 160 mg/kg, SIGMA-ALDRICH Co, St. Louis, MO, USA). MRE measurements were obtained for the control group every 24 hours following intervention for four days. The chemotherapy-treated mice were further divided into 3 experimental subgroups with different timing for the MRE measurements. The first subgroup (n = 8) mice were scanned every 24 hours following treatment for 4 days, in accordance with the protocol used for the control mice, to determine the earliest possible time point at which a change in shear stiffness can be detected with MRE. MRE was performed on the second subgroup (n = 10) at baseline, day 4, and post-mortem to determine how the physiological state of the tumor affects the stiffness measurement. Following the MRE experiment on day 4, each mouse was sacrificed using an inhalation of CO2 and rescanned within one hour post-mortem. To assess the characteristics of recurring tumors, the third subgroup (n = 9) received one sub-optimal dose of chemotherapy. MRE stiffness measurements were obtained at baseline, day 4, and day 25±7 when tumor regrowth had occurred.
Experimental Setup and Image Acquisition
All experiments were conducted on a 3.0-T whole-body GE scanner (Signa, GE Healthcare, Waukesha, WI, USA) using a custom-built, 6-cm diameter transmit-receive RF coil. MRE data were collected using a single-shot spin-echo (SE) EPI sequence (17–20). Shear waves were introduced into the tumor using a minimally invasive, silver needle inserted into the tumor and attached to an electromechanical driver. No adverse effects due to needle insertion were observed. A frequency of 800 Hz was chosen to provide a balance between the high attenuation of the waves in tissue and the need for a short wavelength to quantify the stiffness of small tumors. Imaging parameters included TR/TE = 1100/99 ms, field of view = 5 cm, 4 contiguous slices, 2-mm slice thickness, acquisition matrix = 72×72, reconstruction matrix = 256×256, 2 signal averages, receiver bandwidth = ±41.5 kHz, and three MRE phase offsets. Sixty motion-encoding gradient pairs with sensitivity of 1.27 μm/pi rad were used to record motion in 3 orthogonal directions.
To assess the influence of tumor size on MRE-derived shear stiffness estimates, the above experimental set up was used to test a series of bovine gel phantoms. A mixture of 12% bovine gel (Sigma Aldrich) was made and poured into 3 cylindrical containers of different volumes: 25 cm3, 12 cm3, and 6 cm3. The same acquisition parameters described above for estimating tumor stiffness were used on the 3 gel phantoms.
Image Analysis
Shear wave images acquired with the SE-EPI MRE pulse sequence were first phase unwrapped and processed using a direct inversion of the Helmholtz equation describing shear wave motion through a homogeneous, isotropic, viscoelastic material. The inversion algorithm incorporated 4 orthogonal directional filters (using a radial Butterworth bandpass filter with cutoff frequencies of 0.4 and 25.6 cm−1) to reduce interference in the wave field. The directionally filtered wave fields were used to simultaneously solve the Helmholtz equation for the complex shear modulus in sliding 11×11 pixel kernels. The values are reported in stiffness maps (elastograms) of the tumors as tissue density (assumed to be 1 g/cm3) times the wave speed squared, in units of kPa (21,22). The inversion algorithm also reported a confidence map based on the correlation coefficient of polynomial fits performed over an 11×11 processing kernel. This confidence map, with a threshold of 0.95, was used to visually highlight high wave signal-to-noise ratio (SNR) regions by applying a checkerboard pattern to the low SNR regions with less reliable stiffness measurements (Fig. 1c). A region of interest (ROI) was manually drawn on each slice, taking care to include only voxels containing the tumor and excluding voxels with low wave SNR. Tumor stiffness was reported as the average of the stiffness values within the ROI.
Histology
To assess the cellular response to chemotherapy treatment, histological analysis was performed on tumor samples taken from the control group and the first chemotherapy subgroup immediately after the final MRE experiment on day 4. The mice were sacrificed using an inhalation of CO2 and the tumors were dissected, fixed with formalin, embedded in paraffin blocks, and cut into 4 μm thick sections. The tumor sections were examined immunohistochemically using the proliferation marker Ki67 (clone MIB-2, DAKO M7240) and apoptosis marker TUNEL (Terminal deoxynucleotidyl transferase dUTP nick end labeling). The presence of the two markers was visualized using a peroxidase-based Advance™ kit (DAKO) and diaminobenzidine (DAB).
Statistical Analysis
A Tukey-Kramer HSD test was used to determine the earliest day of measureable stiffness change in the control and the first chemotherapy subgroup. All stiffness measurements obtained after treatment were compared with the baseline stiffness using a repeated-difference ANOVA. The results from the histological analysis were compared across the two groups to determine if the number of cells, percent of cells stained positive for proliferation, and staining pattern were associated with changes in shear stiffness. Commercially available software JMP (JMP8.0, Cary, NC) and MedCalc (MedCalc 12.3.0, Mariakerke, Belgium) were used for the analysis. The results were declared statistically significant when P < 0.05.
Results
Tissue Stiffness Changes due to Chemotherapy
The first chemotherapy subgroup and all control mice were imaged every 24 hours after intervention to determine the earliest possible time point at which a change in shear stiffness is detectable by MRE (Fig. 2a). Examples of elastograms reconstructed at every time point are shown in figure 2b. At baseline, the stiffness of the control group and the chemotherapy group were very similar (9.85±0.59 and 9.88±0.40 kPa, respectively). After intervention, the mean shear stiffness of the control group increased by 0.62±0.88 kPa at day 1 (P = 0.95), 0.89±0.80 kPa at day 2 (P = 0.83), 1.26±0.77 kPa at day 3 (P = 0.59), and 1.10±0.93 kPa at day 4 (P = 0.70), though these changes were not statistically significant. The mean shear stiffness of the chemotherapy group decreased from baseline by 0.38±0.50 kPa at day 1 (P = 0.95), 0.24±0.52 kPa at day 2 (P = 0.99), 1.53±0.59 kPa at day 3 (*P = 0.04), and 1.65±0.52 kPa at day 4 (*P = 0.02). Stiffness estimates obtained from the control and chemotherapy groups were also found to be statistically significantly different on days 3 and 4 (day 3: *P = 0.001 and day 4: *P=0.002). These data demonstrate a significant decrease in tumor shear stiffness from baseline within 3 days of chemotherapy treatment.
Figure 2.

(a) Average tumor stiffness versus time after intervention for the control group (blue line) and the chemotherapy group (red line). N = 8 mice per group. Error bars represent the 95% confidence interval. *P < 0.05 in comparison to baseline using the Tukey-Kramer HSD. Change in stiffness from baseline was statistically significant at days 3 and 4 for the chemotherapy-treated group. The p values comparing the stiffness values obtained from the control group and the chemotherapy group at days 3 and 4 are also indicated.(b) Elastograms (stiffness maps in units of kPa) of a control and a chemotherapy-treated tumor taken at baseline and 1, 2, 3, and 4 days after intervention. The checkerboard pattern indicates regions that were excluded from stiffness measurement due to poor signal-to-noise ratio. The white scale bar represents 1 cm.
The volume of chemotherapy-treated tumors decreased following treatment, but the change was not significant (P = 0.06 at day 3, *P = 0.056 at day 4, Tukey-Kramer HSD. Fig. 3a). Conversely, tumors from the control group increased in size and became stiffer, though neither change was significant (Fig. 3b). The results from the experiments performed on gelatin phantoms of different volumes indicated no correlation between the size and the stiffness of the phantom (data not shown) for the given driving frequency.
Figure 3.
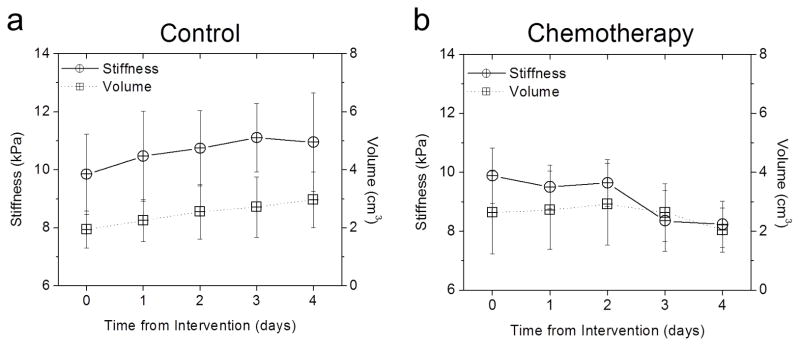
Comparison of stiffness and volume change with treatment. (a) Tumor stiffness (solid line, circle) and volume (dotted line, squares) versus time in a control tumor (n = 8). No statistically significant change from baseline in either the stiffness or volume measurements. (b) Tumor stiffness (solid line, circle) and volume (dotted line, squares) versus time in a chemotherapy treated tumor (n = 8). Change in tumor stiffness from baseline was statistically significant at day 3 and 4, but no significant change in volume.
Tissue Stiffness Changes due to Physiological State
A prior ex vivo study (23) showed increased tumor stiffness within 4 hours following chemotherapy. This in vivo study provided a contradicting result: a decrease in stiffness following chemotherapy treatment. One explanation for this discrepancy is that it is due to a fundamental difference between the physiological states of ex vivo and in vivo tissue (24). To address this, in the second chemotherapy group, the tumor shear stiffness was measured in vivo at baseline, 4 days after chemotherapy treatment, and postmortem. The results indicate increased tissue shear stiffness in postmortem tumors compared to in vivo measurements obtained up to just one hour prior (*P < 0.001, Student’s t-test) (Fig. 4a, b).
Figure 4.

Change in stiffness as an indicator of tumor viability. (a) Stiffness versus time in chemotherapy-treated tumors at baseline, day 4 post-treatment, and post mortem. Error bars represent the 95% confidence interval and statistical significance was determined by comparison to the previous time point using a repeated-difference ANOVA (n = 10). (b) Elastograms (stiffness maps in units of kPa) of mouse tumors at baseline, day 4 post-treatment, and post mortem. Color bars represent stiffness in units of kPa. The checkerboard pattern indicates regions that were excluded from measurement due to poor SNR. The white scale bar represents 1 cm. (c) Evaluation of tumor stiffness at baseline, day 4 post-treatment, and after tumor regrowth (day 25±7). P values in red report the statistical significance for stiffness change. Error bars represent the 95% confidence interval and statistical significance was determined by comparison to the previous time point using a repeated-difference ANOVA (n = 9). (d) Elastograms (stiffness maps in units of kPa) of mouse tumors acquired at each time point. The checkerboard pattern indicates regions that were excluded from measurement due to poor SNR. The white scale bar represents 1 cm.
Tissue Stiffness Changes with Tumor Viability
In the third subset of the chemotherapy-treated mice, we observed an initial sub-lethal response (a decrease in tumor stiffness and volume at day 4) followed by a period of tumor regrowth. From baseline to day 4, the mean shear stiffness decreased by 2.15±0.80 kPa (*P = 0.019, repeated-difference ANOVA), similar to the results obtained from the other two groups. Treatment efficacy was noted macroscopically by a decrease in volume. The tumors initially responded to the treatment but no further chemotherapy drugs were administered, allowing for subsequent tumor growth. Following tumor regrowth, MRE measurements were obtained on day 25±7 (Fig. 4c). Example elastograms reconstructed at each time point are shown in Figure 4d. From day 4 to day 25, tumor stiffness increased (*P < 0.001, repeated-difference ANOVA).
Tissue Stiffness Correlates with Histologic Assessment
Chemotherapy-treated tumors from the first subgroup displayed decreased cell proliferation (*P < 0.001) when compared to the control group, with 42±12% of cells positive for proliferation in the chemotherapy group compared to 73±8% in the control group (Fig. 5a, b, and c). TUNEL assays performed on the tumor samples to quantify the level of apoptosis (Fig. 5d) indicate that at the time that shear stiffness changes were detected using MRE, an arrest of proliferation and early evidence of apoptosis was observed.
Figure 5.
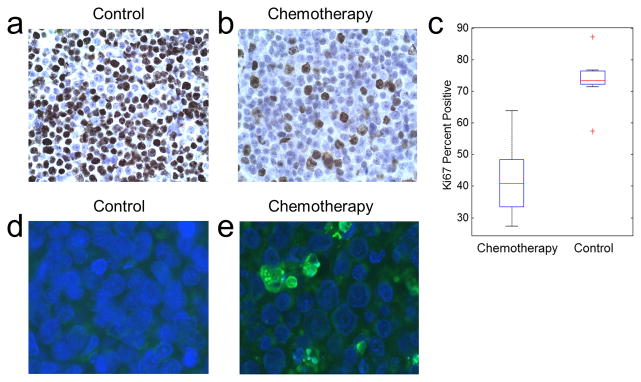
Cellular differences between the treatment groups. (a–b) Ki67 staining to measure levels of active cellular proliferation in a control (a) and a chemotherapy-treated (b) mouse tumor. (c) Ki67 percent positive for active cellular proliferation versus treatment type. Chemotherapy-treated tumors have decreased levels of active proliferation compared to the control tumors (P < 0.001). The central mark is the median, edges are the 25th and 75th percentiles, and the outliers are indicated by +. (d–e) TUNEL staining to assess apoptosis in a control and a chemotherapy-treated mouse tumor.
Tumor Stiffness Decreases with Chemotherapy: Cumulative Data
Shear stiffness values acquired for every mouse in the three chemotherapy groups were accumulated and the change in the stiffness from baseline to day 4 was analyzed (Fig. 6a). The mean stiffness of the chemotherapy-treated tumors decreased significantly by 1.89±0.40 (*P < 0.0001, n = 27, Student’s t-test) (Fig. 6b), a decrease of over 20% compared to the original tumor stiffness.
Figure 6.
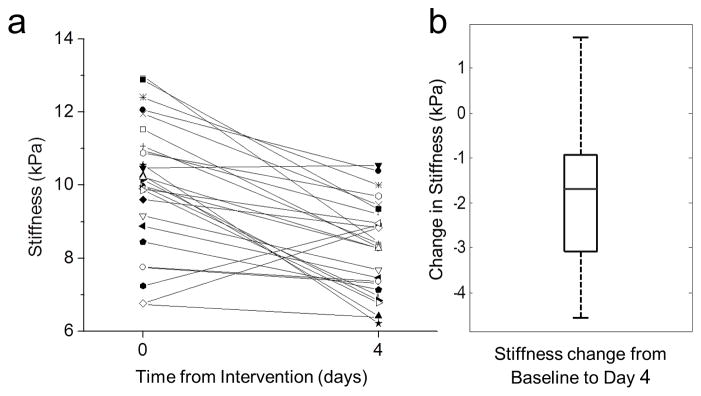
Tumor stiffness decreases within 4 days of chemotherapy. (a) Stiffness values for all mice treated with chemotherapy (n = 27) at baseline and day 4. Mean stiffness decreases within 4 days following chemotherapy treatment (P < 0.001, repeated-difference ANOVA). (b) Change in stiffness from baseline. The central mark is the median, edges are the 25th and 75th percentiles, and the whiskers extend to the most extreme data points.
Discussion
This study demonstrates that MRE is capable of quantifying treatment response, as determined by change in tumor stiffness, within 3 days of administration of chemotherapy in a xenograft mouse model of non-Hodgkin’s lymphoma. These data suggest that chemotherapy-treated tumors become softer and smaller compared to saline-treated tumors. However, the observed change in MRE-derived estimates of shear stiffness precedes a statistically significant change in tumor volume. In addition, histologic assessment of chemotherapy-treated tumors indicates that chemotherapy-induced change in shear stiffness coincides with decreased cellular proliferation and moderate induction of apoptosis. These results suggest that change in shear stiffness may precede actual cell death in the tumors as indicated by histology, and that decreasing cellularity in combination with cell death may contribute to the change in tissue mechanical properties. Taken in aggregate, these data suggest that tumor shear stiffness may be an earlier and a more sensitive biomarker of treatment response than existing conventional imaging-based approaches.
In the experiment to monitor the effect of tumor recurrence, we found that as tumors respond to treatment, stiffness decreases and as the tumors begin to recover, stiffness increases. This suggests that MRE can be used as a measure of tumor viability, and has the potential to monitor tumors over the course of treatment to determine if and when a tumor begins to recur. It should be noted that mice were scanned on different days after the treatment, because of the variations of the tumor regrowth, restrictions on the maximum tumor size, overall health of each mouse and limited access to the MRI scanner. To minimize sample size differences on results, each tumor measurement was treated as being independent and accounted for using a repeated-measures ANOVA statistical model. Despite the difference in time points, the results indicate a statistically significant increase in stiffness with tumor regrowth. Future studies will be designed to further investigate the correlation between change in stiffness and tumor regrowth.
It is important to note that the results of this in vivo tumor study were contradictory to the in vitro cellular study mentioned previously (8). While the cellular stiffness was reported to increase with treatment, we found that the macroscopic tumor stiffness decreased with chemotherapy treatment. However, the actual mechanisms underlying this change are currently unknown. We postulate that changes in interstitial pressures, cellularity, and extracellular components are centrally involved. Future studies will investigate alternative tumor types and treatment options, and will potentially elucidate the biological processes underlying changes in tumor mechanical properties with chemotherapy treatment.
While these data are highly encouraging, there are a few limitations to this method. First, MRE is limited by the ability to apply and resolve full wavelengths of motion within the region of interest, establishing a frequency-dependent upper spatial resolution limit for this approach. This limitation, in combination with the small tumor size, resulted in the need for the use of a high frequency of motion produced by a minimally invasive needle driver directly inserted in the tumor. The high frequency of motion results in significant frequency-dependent shear wave attenuation, and subsequently a relatively high variation in the reported shear stiffness and a loss of resolution near the tumor edges. Other contributors to the variation in shear stiffness are the inherent spatial heterogeneity of tumors and the effects of reflection and refraction of shear waves at the boundaries of the tumors.
Translation to clinical studies requires the development of a noninvasive MRE technique with adequate wave penetration and spatial resolution. For these reasons, these results are not automatically indicative of clinical sensitivity and specificity. However, current clinical MRE uses a noninvasive active-passive driver system to generate shear waves in tissue (14,25), offering an alternative to the invasive needle driver used in this study. Therefore, translation of this method to human imaging may be possible noninvasively. This would potentially allow us to use shear stiffness as a biomarker of treatment response and also to longitudinally monitor treatment response throughout the course of therapy.
Conclusions
In this study, we have shown that MRE is capable of detecting a change in tumor stiffness within 3 days of chemotherapy administration. Based on these results, we conclude that MRE-derived shear stiffness may be developed as a biomarker for the early assessment of treatment response to chemotherapy, enabling enhanced therapeutic efficacy in responders and, more importantly, individualize the treatment regimen for non-responders to reduce the side effects. We predict that future studies using this method will also provide new insights into understanding the fundamental biological processes associated with malignant tumor growth and metastatic proliferation.
Acknowledgments
We thank D. Grote for initial support and care of all mice used in this experiment. We additionally thank D. Sauter for assistance in conducting each experiment. This work was supported by U.S. National Institutes of Health (NIH) grants EB07593 and EB001981. Additional funding was provided by the Mayo Graduate School.
References
- 1.Meyer CR, Armato SG, Fenimore CP, McLennan G, Bidaut LM, Barboriak DP, Gavrielides MA, Jackson EF, McNitt-Gray MF, Kinahan PE, Petrick N, Zhao B. Quantitative imaging to assess tumor response to therapy: common themes of measurement, truth data, and error sources. Transl Oncol. 2009;2(4):198–210. doi: 10.1593/tlo.09208. [DOI] [PMC free article] [PubMed] [Google Scholar]
- 2.Therasse P, Arbuck SG, Eisenhauer EA, Wanders J, Kaplan RS, Rubinstein L, Verweij J, Van Glabbeke M, van Oosterom AT, Christian MC, Gwyther SG. New guidelines to evaluate the response to treatment in solid tumors. European Organization for Research and Treatment of Cancer, National Cancer Institute of the United States, National Cancer Institute of Canada. J Natl Cancer Inst. 2000;92(3):205–216. doi: 10.1093/jnci/92.3.205. [DOI] [PubMed] [Google Scholar]
- 3.Suresh S. Biomechanics and biophysics of cancer cells. Acta Biomater. 2007;3(4):413–438. doi: 10.1016/j.actbio.2007.04.002. [DOI] [PMC free article] [PubMed] [Google Scholar]
- 4.Cross SE, Jin YS, Rao J, Gimzewski JK. Nanomechanical analysis of cells from cancer patients. Nat Nanotechnol. 2007;2(12):780–783. doi: 10.1038/nnano.2007.388. [DOI] [PubMed] [Google Scholar]
- 5.Lekka M, Laidler P, Gil D, Lekki J, Stachura Z, Hrynkiewicz AZ. Elasticity of normal and cancerous human bladder cells studied by scanning force microscopy. Eur Biophys J. 1999;28(4):312–316. doi: 10.1007/s002490050213. [DOI] [PubMed] [Google Scholar]
- 6.Rosenbluth MJ, Lam WA, Fletcher DA. Force microscopy of nonadherent cells: a comparison of leukemia cell deformability. Biophys J. 2006;90(8):2994–3003. doi: 10.1529/biophysj.105.067496. [DOI] [PMC free article] [PubMed] [Google Scholar]
- 7.Guck J, Schinkinger S, Lincoln B, Wottawah F, Ebert S, Romeyke M, Lenz D, Erickson HM, Ananthakrishnan R, Mitchell D, Kas J, Ulvick S, Bilby C. Optical deformability as an inherent cell marker for testing malignant transformation and metastatic competence. Biophys J. 2005;88(5):3689–3698. doi: 10.1529/biophysj.104.045476. [DOI] [PMC free article] [PubMed] [Google Scholar]
- 8.Lam WA, Rosenbluth MJ, Fletcher DA. Chemotherapy exposure increases leukemia cell stiffness. Blood. 2007;109(8):3505–3508. doi: 10.1182/blood-2006-08-043570. [DOI] [PMC free article] [PubMed] [Google Scholar]
- 9.Sack I, Beierbach B, Hamhaber U, Klatt D, Braun J. Non-invasive measurement of brain viscoelasticity using magnetic resonance elastography. NMR Biomed. 2008;21(3):265–271. doi: 10.1002/nbm.1189. [DOI] [PubMed] [Google Scholar]
- 10.Yin M, Talwalkar JA, Glaser KJ, Manduca A, Grimm RC, Rossman PJ, Fidler JL, Ehman RL. Assessment of hepatic fibrosis with magnetic resonance elastography. Clin Gastroenterol Hepatol. 2007;5(10):1207–1213. e1202. doi: 10.1016/j.cgh.2007.06.012. [DOI] [PMC free article] [PubMed] [Google Scholar]
- 11.Muthupillai R, Lomas DJ, Rossman PJ, Greenleaf JF, Manduca A, Ehman RL. Magnetic resonance elastography by direct visualization of propagating acoustic strain waves. Science. 1995;269(5232):1854–1857. doi: 10.1126/science.7569924. [DOI] [PubMed] [Google Scholar]
- 12.Sinkus R, Siegmann K, Xydeas T, Tanter M, Claussen C, Fink M. MR elastography of breast lesions: understanding the solid/liquid duality can improve the specificity of contrast-enhanced MR mammography. Magn Reson Med. 2007;58(6):1135–1144. doi: 10.1002/mrm.21404. [DOI] [PubMed] [Google Scholar]
- 13.Murphy MC, Huston J, 3rd, Jack CR, Jr, Glaser KJ, Manduca A, Felmlee JP, Ehman RL. Decreased brain stiffness in Alzheimer’s disease determined by magnetic resonance elastography. J Magn Reson Imaging. 2011;34(3):494–498. doi: 10.1002/jmri.22707. [DOI] [PMC free article] [PubMed] [Google Scholar]
- 14.Venkatesh SK, Yin M, Glockner JF, Takahashi N, Araoz PA, Talwalkar JA, Ehman RL. MR elastography of liver tumors: preliminary results. AJR Am J Roentgenol. 2008;190(6):1534–1540. doi: 10.2214/AJR.07.3123. [DOI] [PMC free article] [PubMed] [Google Scholar]
- 15.Garteiser P, Doblas S, Daire JL, Wagner M, Leitao H, Vilgrain V, Sinkus R, Van Beers BE. MR elastography of liver tumours: value of viscoelastic properties for tumour characterisation. Eur Radiol. 2012;22(10):2169–2177. doi: 10.1007/s00330-012-2474-6. [DOI] [PubMed] [Google Scholar]
- 16.Ansell SM, Arendt BK, Grote DM, Jelinek DF, Novak AJ, Wellik LE, Remstein ED, Bennett CF, Fielding A. Inhibition of survivin expression suppresses the growth of aggressive non-Hodgkin’s lymphoma. Leukemia. 2004;18(3):616–623. doi: 10.1038/sj.leu.2403281. [DOI] [PubMed] [Google Scholar]
- 17.Kruse SA, Grimm RC, Lake DS, Manduca A, Ehman RL. Fast EPI Based MR Elastography of the Brain. Conf. Proc. ISMRM; 2006; Seattle, WA, USA. [Google Scholar]
- 18.Yin M, Grimm RC, Manduca A, Ehman RL. Rapid EPI-based MR Elastography of the Liver. Conf. Proc. ISMRM; 2006; Seattle, WA, USA. [Google Scholar]
- 19.Herzka DA, Kotys MS, Sinkus R, Pettigrew RI, Gharib AM. Magnetic resonance elastography in the liver at 3 Tesla using a second harmonic approach. Magn Reson Med. 2009;62(2):284–291. doi: 10.1002/mrm.21956. [DOI] [PubMed] [Google Scholar]
- 20.Nedredal GI, Yin M, McKenzie T, Lillegard J, Luebke-Wheeler J, Talwalkar J, Ehman R, Nyberg SL. Portal hypertension correlates with splenic stiffness as measured with MR elastography. Journal of Magnetic Resonance Imaging. 2011;34(1):79–87. doi: 10.1002/jmri.22610. [DOI] [PMC free article] [PubMed] [Google Scholar]
- 21.Manduca A, Lake DS, Kruse SA, Ehman RL. Spatio-temporal directional filtering for improved inversion of MR elastography images. Med Image Anal. 2003;7(4):465–473. doi: 10.1016/s1361-8415(03)00038-0. [DOI] [PubMed] [Google Scholar]
- 22.Manduca A, Oliphant TE, Dresner MA, Mahowald JL, Kruse SA, Amromin E, Felmlee JP, Greenleaf JF, Ehman RL. Magnetic resonance elastography: Non-invasive mapping of tissue elasticity. Medical Image Analysis. 2001;5(4):237–254. doi: 10.1016/s1361-8415(00)00039-6. [DOI] [PubMed] [Google Scholar]
- 23.Chen J, McGee KP, Mariappan YK, Glaser KJ, Ansell SM, Pelletier KM, Grote DM, Ehman RL. Assessment of Early Tumor Response to Chemotherapy Using MR Elastography (MRE). Conf. Proc. ISMRM; 2011; Montreal, Quebec, Canada. p. 6187. [Google Scholar]
- 24.Vappou J, Breton E, Choquet P, Willinger R, Constantinesco A. Assessment of in vivo and post-mortem mechanical behavior of brain tissue using magnetic resonance elastography. Journal of Biomechanics. 2008;41(14):2954–2959. doi: 10.1016/j.jbiomech.2008.07.034. [DOI] [PubMed] [Google Scholar]
- 25.Ehman EC, Rossman PJ, Kruse SA, Sahakian AV, Glaser KJ. Vibration safety limits for magnetic resonance elastography. Phys Med Biol. 2008;53(4):925–935. doi: 10.1088/0031-9155/53/4/007. [DOI] [PMC free article] [PubMed] [Google Scholar]