Abstract
We present results from molecular dynamics simulations of methanol-water solutions using charge equilibration force fields to explicitly account for non-additive electronic interaction contributions to the potential energy. We study solutions across the concentration range from 0.1 to 0.9 methanol mole fraction. At dilute concentrations, methanol density is enhanced at the liquid-vapor interface, consistent with previous molecular dynamics and experimental studies. Interfacial thickness exhibits a monotonic increase with increasing methanol mole fraction, while surface tensions display monotonic decrease with methanol concentration, in qualitative agreement with experimental data and previous molecular dynamics predictions using polarizable force fields. In terms of interfacial structure, in keeping with predictions of traditional force fields, there is a unique preferential orientation of methanol molecules at the interface. Moreover, there is a free energetic preference for methanol molecules at the interface as evidenced by potential of mean force calculations. The pmf calculations suggest an interfacial state with 0.8 kcal/mole stability relative to the bulk, again, in qualitative agreement with previous simulation and experimental studies. Interfacial potentials based on double integration of total charge density range from −610 mV to −330 mV over the dilute to concentrated regimes, respectively. The preponderance of methanol at the interface at all mole fractions gives rise to a dominant methanol contribution to the total interfacial potential. Interestingly, there is a transition of the water surface potential contribution from negative to positive upon the transition from methanol mole fraction of 0.1 to 0.2. The dipole and quadrupole contributions to the water component of the total interfacial potential are effectively of equal magnitude and opposite sign, thus canceling one another. We compute the in-plane component of the dielectric permittivity along the interface normal. We observe a non-monotonic behavior of the methanol in-plane dielectric permittivity that tracks the methanol density profiles at low methanol mole fractions. At higher methanol mole fractions, the total in-plane permittivity is dominated by methanol, and displays a monotonic decrease from bulk to vapor. We finally probe the nature of hydration of water in the bulk versus interfacial regions for methanol mole fractions of 0.1 and 0.2. In the bulk, methanol perturbs water structure so as to give rise to water hydrogen bond excesses. Moreover, we observe negative hydrogen bond excess in the vicinity of the alkyl group, as reported by Zhong et al for bulk ethanol-water solutions using charge equilibration force fields, and positive excess in regions hydrogen bonding to nearest-neighbor methanol molecules. Within the interfacial region, water and methanol density reduction lead to concomitant water hydrogen bond deficiencies (negative hydrogen-bond excess).
I. Introduction
Aqueous solution interfaces play an important role in a broad range of physico-chemical processes spanning biophysical to environmental chemistry1–5. As a prototypical system, the methanol-water aqueous solution has been investigated intensely in the past, via both experimental and computational/theoretical modeling approaches6–13. Experimental studies of aqueous methanol-water (and in general alcohol-water) solution liquid-vapor interfaces advanced with the advent of novel non-linear optical methods such as sum frequency generation and second harmonic generation14–17. The accepted picture of the structure of such interfaces, particularly at dilute concentrations, suggests an enhancement of methanol density at the interface, akin to surfactant-like behavior.
Molecular simulations have now become a standard tool in the study of interfacial systems. With regard to the study of methanol-water solution interfaces, previous work has applied fixed-charge force fields to study interfacial structure, energetics, and electrostatics 18–20. Though widely used, there are still outstanding issues related to algorithms and force fields. From the perspective of physical models of associating fluids, a new generation of non-additive force fields incorporating electronic polarization effects is now being pursued at a furious pace. The effects of polarizability as introduced via several independent formalisms can now be studied and subtle details revealed, not only of the systems explored, but of the underlying physical formalisms used to include more physical interactions. Recent polarizable electrostatic models coupled with the standard classical van der Waals dispersion interactions have considered the effects of non-additivity in such systems. Until now, the majority of studies of the methanol-water solution-vapor interface using polarizable models have employed point multipole models, in particular dipole polarizable models21–23. An alternative approach to explicit inclusion of polarization in molecular systems is the charge equilibration approach24–34.
In this contribution, we aim to investigate the nature of the aqueous methanol-water interface in terms of structure and thermodynamics using novel charge equilibration models for methanol and the TIP4P-FQ water model of Rick, Stuart, and Berne33; this study is in the spirit of assessing the behavior of alternate formalisms for including explicit polarization in classical force fields. To date, this is the first study of the methanol-water interface using charge equilibration force fields. This study further analyzes the nature of the surface potential of methanol-water mixtures. This property has been sparsely addressed in earlier literature for pure methanol19 and methanol-water mixtures19,35, and for aqueous solutions of inorganic salts36. We further consider a decomposition of the electrostatic surface potential into contributions from the water dipole and quadrupole moments. Finally, we discuss the variation of the in-plane dielectric permittivity (arising from water and methanol) from vapor to condensed phase, and the implications of this behavior on the reduced interfacial anion enrichment observed at the liquid vapor interface of methanol-ion solution interfaces37.
In Section II, we discuss the force fields and issues related to application of such models; we also discuss the potential of mean force for transfer of methanol from gas to infinite dilution. Sections IIIA-IIIG discuss properties of the mixtures including density profiles and interfacial thickness, dipole moment profiles, surface tension, surface potential, orientational profiles, and dielectric permittivity profiles. Section IV presents conclusions and final discussion.
II. Force Fields
IIA. Electrostatic and Non-Bond Interaction Model
The charge equilibration (fluctuating charge) model has been applied to various systems over the last decade31–33,38–42. The method derives from the density functional theory of atoms in molecules as formulated by Yang and Parr43. More fundamentally, the method is founded on Sanderson’s idea of electronegativity equalization44,45. In the density functional sense, electronegativity equalization amounts to the equalization of the chemical potential in space. In a molecule, this translates to the redistribution of charge among constituent atoms so as to equalize the electronegativity (chemical potential) at each point.
The electrostatic energy of a system of M molecules containing N atoms per molecule is:
| 1) |
where the χ’s are atom electronegativities and the η’s are the atomic hardnesses. The former quantity gives rise to a directionality of electron flow, while the latter represents a resistance, or hardness, to electron flow to or from the atom. The last term in Equation 1 is a standard Coulomb interaction between sites not involved in dihedral, angle, and bonded interactions with each other; the second term represents the local charge transfer interaction generally restricted to within a molecule (no charge transfer) or some appropriate charge normalization unit. In the case where charge is constrained over an entire molecule, a total molecular charge constraint must be included via a Lagrange multiplier, λj, for each molecule; this leads to an electrostatic energy:
| 1a) |
For larger molecules, molecular polarizability can be modulated through the use of multiple charge normalization units chosen to reproduce justifiable extent of charge transfer. Pragmatically, from the perspective of force field construction, the use of multiple charge normalization units for extended molecular constructs affords a facile approach to “piecing” together larger molecules from smaller model fragments. These latter represent the molecular palette used to construct the force field. This approach has been successfully applied to macromolecules of biological relevance, i.e., protein, lipid bilayers, etc.
We note that although the electronegativity and hardness follow exactly from the definitions of the electron affinity and ionization potential, they are considered here as empirical parameters to be determined as described below. Homogeneous hardness values (for each atom type) are parameterized as discussed in Reference38. Heterogeneous elements (interaction elements between different atom types) are derived from the individual atom type values based on the combining rule46:
| 2) |
where Rij is the separation between atoms (or more generally sites) ‘i’ and ‘j’, and the atomic hardness parameters are the η. This local screened Coulomb potential has the correct limiting behavior as 1/r for separations greater than about 2.5 Å. This interaction is computed for 1–2, 1–3, and 1–4 sites (sites included in bonds, angles, and dihedrals). Sites in a molecule separated by 5 or more sites interact via a Coulomb interaction; in the case of interacting molecules, the interaction between sites on different molecules is again of the Coulomb form.
With respect to molecular polarizability, the charge equilibration formalism is in fact a polarizable model, since one can derive the molecular dipole polarizability as:
| 3) |
where η′ denotes the molecular hardness matrix augmented with extra rows and columns as needed to incorporate total charge constraints for each individual normalization unit, Rβ represents the β Cartesian coordinates of the atomic position vector, and Rγ is the γ Cartesian coordinate of the atomic position vector. Furthermore, the model, being an all-atom representation with partial charges assigned to all atomic species, contains all higher-order electrostatic multipole moments. This is in contrast to point dipole polarizable models 47–49 and Drude oscillator models50–52. As such, the charge equilibration models incorporate higher-order electrostatic interactions naturally.
With respect to charge dynamics, an extended Lagrangian formalism is used to propagate the charges in time with some general charge constraint, thus strictly providing for electronegativity equalization at each dynamics step. For the present work, molecular charge neutrality is imposed; however, this can be modified to permit charge transfer between molecular entities. The system Lagrangian and associated constraint on total molecular charge for each molecule are then,
| 4) |
where the first two terms represent the nuclear and charge kinetic energies, the third term is the total potential energy and the fourth term is the molecular charge neutrality constraint with λi the Lagrange multiplier for each molecule, indexed by i. The fictitious charge dynamics, analogous to wavefunction dynamics in Car-Parrinello (CP) type methods53, are determined by a charge ‘mass’ (adiabaticity parameter in CP dynamics). The units for this mass are (energy time2 / charge2). The charges are propagated based on forces arising from the difference between the average electronegativity of the molecule and the instantaneous electronegativity at an atomic site. It has been well-documented in the literature that charge equilibration models treat molecules as conductors, i.e., charge is transferable throughout the entire molecule. We have previously characterized the origins of what is fundamentally super-linear polarizability scaling in such systems54. For the rather small systems studied here, a molecular charge normalization scheme suffices to capture the global molecular polarizability behavior.
The non-bond interaction is of the Lennard-Jones type (standard in the CHARMM55 implementation):
| 5) |
where the summation runs over all non-bonded atom pairs. Table 1 shows the electrostatic and van der Waals parameters for the current model. The water-water interactions are treated using the TIP4P-FQ water model as developed by Rick et al33. The methanol-methanol interactions are modeled using the fluctuating charge model developed by Patel and Brooks41. Cross interactions between water and methanol are treated using the homogeneous interactions parameters with a geometric mean combining rule for the Lennard-Jones energy well parameter and an arithmetic mean combination rule for the separations, Rmin. This is the commonly applied Lorentz-Berthelot combination rule, applied here in order to maintain consistency with the CHARMM force field. We also permit the methanol to interact with water hydrogen atoms as in the original CHARMM fluctuating charge force field as developed by Patel and Brooks38; we feel that this allows for a more consistent representation in terms of the global development of a CHARMM polarizable force field. Intra-molecular interaction potentials (bond stretching, angle bending, dihedral rotation) are retained from the non-polarizable CHARMM27 (C27) force field. The quality of the potentials for modeling methanol-water systems with respect to structural and thermodynamic properties has been discussed previously56; in particular, it has been shown that the free energy of solvation for methanol in dilute aqueous solution with the current interaction potential computed using thermodynamic integration is −5.6±0.2 kcal/mole, overestimating the experimental measurement of −5.1 kcal/mol56.
Table 1.
Electrostatic and non-bond parameters for methanol and TIP4P-FQ water. Parameters for TIP4P-FQ are taken from Rick et al 33(cross terms are not shown, and the reader is referred to the work of Rick et al for further details on the water potential). Methanol parameters are from the work of Patel and Brooks41, and ethanol parameters are from the work of Patel and Brooks42.
| Molecule | Atom Type | εi (kcal/mol) | Rmin/2 (Å) | χ (kcal/mol)/e | 1/2η (kcal/mol)/e2 |
|---|---|---|---|---|---|
| Methanol | CT3 | 0.073 | 2.0 | 54.1403 | 117.769 |
| OH1 | 0.1601 | 1.73 | 101.776 | 150.625 | |
| H | 0.046 | 0.2245 | 0.0 | 253.4605 | |
| HA3 | 0.026 | 1.2345 | 49.7344 | 245.697 | |
|
| |||||
| TIP4P-FQ | OT | 0.2862 | 1.7729 | 0.0 | 0.0 |
| OM | 0.0 | 0.0 | 68.49 | 371.6 | |
| HT | 0.0 | 0.0 | 0.0 | 353.0 | |
IIB. Simulation Details
Interfacial solution simulations were performed using a combination of water and methanol molecules in rectangular boxes of varying dimensions employing standard simulation schemes21,23. The z-dimension of each system was taken as 3–4 times the x-and y-dimensions in order to decouple interactions between interfaces. Simulation boxes were generated from pre-equilibrated pure solvent systems. System sizes varied with the concentration modeled; Table 2 lists the molecule numbers used for each concentration. A Verlet leapfrog integrator with timestep of 0.0005 picoseconds (0.5 femtoseconds) generated the trajectory in the constant volume-temperature ensemble (NVT). Constant temperature of 298K was maintained with a Hoover thermostat57. Non-bonded interactions were switched to zero via a switching function from 9 to 10 Å. Conditionally convergent long-range electrostatic interactions were treated using the Smooth Particle Mesh Ewald58 method with a 1 Å grid spacing in each dimension and screening parameter of κ=0.35. Charge degrees of freedom were maintained at 1K using a Nose-Hoover bath; all charges were assigned to the same bath and no local “hotspots” in charge were observed. Methanol and water charge degrees of freedom were assigned masses of 0.00007 and 0.000069 (kcal mol−1 ps2)/e2, respectively. Charge is normalized over individual molecules with no intermolecular charge transfer; the size of the molecular units is of adequate spatial extent to limit molecular polarization to that dictated by Pauli exclusion in the condensed phase59. Simulations of length 5 to 10 nanoseconds were performed for the various methanol mole fractions. Depending on the property analyzed, sufficient initial portions of the molecular dynamics trajectory were disregarded for analysis; the longest equilibration times (up to 3 nanoseconds) were required for surface tension convergence as this property is calculated from the pressure tensor components which are known to display large fluctuations in molecular dynamics simulations. Energetic properties such as density profiles tend to converge relatively more quickly, and for this property, up to one nanosecond of initial portions of the trajectory are disregarded for analysis. To generate the starting configurations of bulk systems, all coordinates of an equilibrated pure water configuration were shifted up by half of a water cubic box length and then combined with equilibrated coordinates of pure methanol that were shifted down by half of one methanol cubic box length. An equilibration simulation for 1 nanosecond under constant temperature and pressure at 298K and 1 bar was performed on the combined system; the details of the simulation were as described in Section II.B.
Table 2.
Liquid-vapor densities, thickness, and Gibbs’ Dividing Surface (GDS) from fits to a hyperbolic tangent function as described in the text (Equation 6). Also shown are the system dimensions (Lx, Ly, Lz) and number of water and methanol molecules used as the simulation system.
| ρL (gr/cm3) | ρV (gr/cm3) | (Å) | zo (GDS) (Å) | Nwater | NMeoh | Lx, Ly (Å) | Lz (Å) | |
|---|---|---|---|---|---|---|---|---|
| 0.1 | 0.987 ±0.001 | 0.0 | 3.635 ±0.075 | 18.528 ±0.011 | 864 | 96 | 29.0 | 156 |
| 0.2 | 0.976 ±0.001 | 0.0 | 3.945 ±0.089 | 22.640 ±0.014 | 864 | 216 | 29.0 | 156 |
| 0.3 | 0.963 ±0.001 | 0.0 | 4.159 ±0.162 | 13.971 ±0.021 | 432 | 186 | 29.0 | 156 |
| 0.4 | 0.947 ±0.001 | 0.0 | 4.451 ±0.070 | 17.596 ±0.008 | 432 | 288 | 29.0 | 156 |
| 0.5 | 0.927 ±0.001 | 0.0 | 4.823 ±0.144 | 22.890 ±0.033 | 432 | 432 | 29.0 | 156 |
| 0.6 | 0.905 ±0.002 | 0.0 | 5.111 ±0.178 | 26.590 ±0.061 | 370 | 554 | 29.0 | 156 |
| 0.7 | 0.881 ±0.002 | 0.0 | 5.448 ±0.170 | 24.635 ±0.048 | 238 | 554 | 29.0 | 156 |
| 0.8 | 0.856 ±0.002 | 0.0 | 5.674 ±0.100 | 23.153 ±0.057 | 138 | 554 | 29.0 | 156 |
| 0.9 | 0.831 ±0.001 | 0.0 | 6.091 ±0.215 | 22.207 ±0.042 | 62 | 554 | 29.0 | 156 |
Atomic charge degrees of freedom (the partial atomic charges) are propagated within an extended Lagrangian formalism. We note that the Nose-Hoover dynamics does not inherently enforce strict charge neutrality (or charge conservation in general). Consequently, during each Nose-Hoover iteration, we enforce charge neutrality for individual molecules by subtracting the average residual charge from each atomic charge of the molecule. This serves as an efficient means to ensure strict charge neutrality during the course of the simulation. As an independent test of this approach, a bond-charge increment (BCI) implementation of the charge equilibration method, introduced into a version of the Chemistry at Harvard Molecular Mechanics (CHARMM)55 molecular modeling package, was employed for molecular dynamics simulations of the relevant systems. In the BCI approach, which has seen various earlier incarnations in the work of Banks et al34, Chelli et al60, the space of independent electronic degrees of freedom is transformed from atomic charge space to bond-charge increment space. A BCI, pij, between atoms “i” and “j” is defined as the amount of charge transferred from atom “i” to atom “j”, where the directionality of this charge flow is indicated by the index order. The reader is referred to the relevant literature for more detailed discussions of such implementations and the attendant caveats and qualifications 54. We note that the forces for the BCI variables, pij, are naturally derived as the difference in the atomic charge forces, fq(i) – fq(j), which can be determined from the standard implementation in molecular dynamics packages. The BCI approach is attractive as it allows a natural charge neutrality constraint to high precision. For the present simulations, the average energies, densities, and charge/BCI potential energies for the BCI and Nose-Hoover with charge neutrality enforced approaches are equivalent as they must be due to the equivalence of the two methods.
III. Results and Discussion
IIIA. Density Profiles
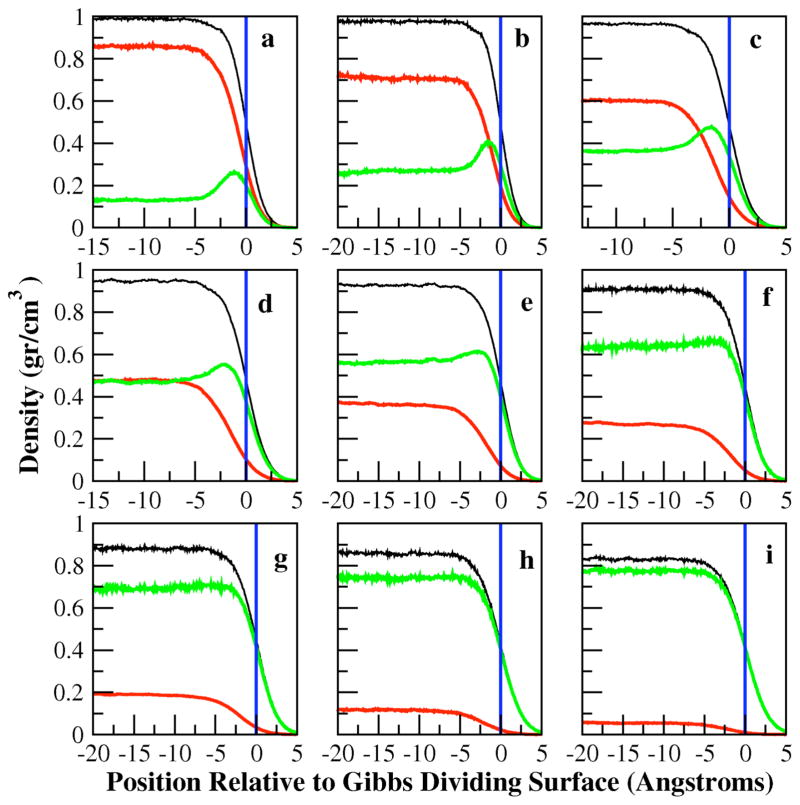
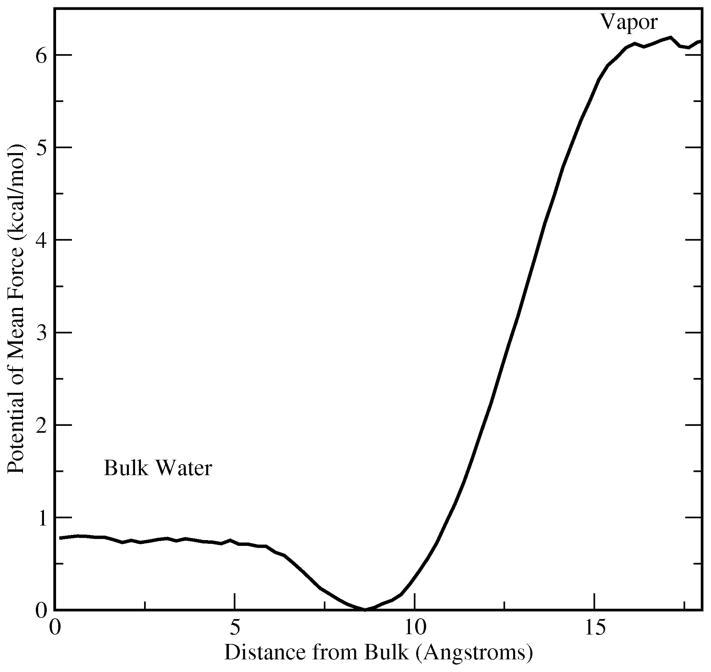
Density profiles provide a detailed picture of the perturbations in molecular distributions in the presence of interfaces. Figure 1 shows water, methanol, and total density profiles for all concentrations studied. The total bulk densities are slightly underestimated for all concentrations as have been previously reported for this combination of solvent and solute force fields56; such effects are highly dependent on cutoff parameters, but slight deviations from experimental bulk densities are not expected to affect the conclusions of this study, though we admit that certain thermodynamic properties such as partial molar volumes of mixing may be underestimated. The errors introduced by the polarizable force field are of similar order of magnitude relative to fixed-charge models; refinement of the current force fields along those lines is admittedly an important issue and beyond the scope of the current work. For dilute methanol solutions, we find that there is an interfacial excess of methanol density. This is a result of an interfacial free energy stability of 0.8 kcal/mol demonstrated in the potential of mean force shown in Figure 2. As with previous modeling studies, as well as experimental measurements, methanol in dilute solutions is surface active, and the non-additive models capture this physical behavior. The current charge equilibration models are effectively commensurate to earlier non- and polarizable alcohol force fields 21,61 in this respect. We discuss the implications of the interfacial enhancement of methanol on surface electrostatic properties such as interfacial potential and dielectric permittivity profiles in Sections IIIF and IIIG.
Figure 1.
Total (black), water (red), and methanol (green) density profiles for methanol mole fractions from 0.1 (a), 0.2 (b), 0.3 (c), 0.4 (d), 0.5 (e), 0.6 (f), 0.7 (g), 0.8 (h), 0.9 (i). Quantitative results for interfacial widths, Gibb’s Dividing Surface (GDS), and bulk densities are given in Tables 2 and 3 for hyperbolic tangent and error function fits, respectively, to density profiles. All graphs have identical y-axis range, and thus the explicit values are not shown on all graphs.
Figure 2.
Potential of mean force (PMF) for a single methanol molecule transferred from vapor to infinitely dilute aqueous solution (in this case pure water). The distance represents relative position from the center of mass of the bulk water phase. This system is independent of the systems used to study the methanol-water liquid-vapor interface.
For lowest methanol concentration studied (X=0.1), we observe that water density extends slightly further relative to the methanol interfacial layer, though the separation between methanol and water layers is rather small. For the higher methanol concentrations, the separation is much more pronounced, with a significant methanol layer extending further towards the vapor phase. We note that the simulations predict a true surface excess; the enhanced density peak at the GDS is not preceded by a region of reduced methanol density as is observed for anionic species at the aqueous liquid-vapor interface62. Interestingly, this appears to be a common effect observed in previous molecular dynamics simulations using both fixed-charge and polarizable force fields, thought the effect manifests to varying degrees18–21,61.
In order to more quantitatively characterize the interface in terms of properties deriving from the density profiles, the total density profiles are fit to hyperbolic tangent functions. The hyperbolic tangent function commonly used is21,63:
| 6) |
where zo is the z-position of the Gibbs Dividing Surface (GDS) and δt describes an inherent interfacial thickness. The GDS is the z-position of the plane (parallel to the interface) for which there is zero surface excess for the total density. In the following discussion, density profiles will be shown relative to the GDS, with that surface being taken as the zero along the longitudinal direction. Total densities are also modeled to fit the error function form given by:
| 7) |
where δe specifies the inherent interfacial thickness from the error function fit. The inherent interfacial thicknesses obtained from the hyperbolic tangent and error function fit, δt and δe, can be standardized to a 10–90 interfacial thickness that describes the length over which the total density falls from 90 to 10 percent of the bulk value via the conversions and . The values of the liquid-vapor densities, GDS, and the 10–90 interfacial thickness from the hyperbolic tangent fit are listed in Table 2 for each mole fraction, while those of the error function are listed in Table 3. We present the 10–90 interfacial thicknesses since there is better agreement between the two functional fits than the fitted parameters, allowing for a direct comparison of these values. Furthermore, the original fitted parameters can be obtained trivially from the presented 10–90 thicknesses and conversions above. The hyperbolic tangent fits and the error function fit to total density profiles both exhibit a monotonic increase in interfacial widths. This has been attributed to the increase in the larger methanol species with increasing mole fraction21,61. The hyperbolic tangent function generally predicts a larger 10–90 thickness due to the slightly poorer fit to actual density in the high-curvature regions of the total density profile.
Table 3.
Liquid-vapor densities, thickness, and Gibbs’ Dividing Surface (GDS) from fits to an error function as described in the text (Equation 7). Also shown are the system dimensions (Lx, Ly, Lz) and number of water and methanol molecules used as the simulation system.
| ρL (gr/cm3) | ρV (gr/cm3) | (Å) | zo(GDS) (Å) | Nwater | NMeoh | Lx, Ly (Å) | Lz (Å) | |
|---|---|---|---|---|---|---|---|---|
| 0.1 | 0.986 ±0.001 | 0.0 | 3.574 ±0.077 | 18.528 ±0.011 | 864 | 96 | 29.0 | 156 |
| 0.2 | 0.975 ±0.001 | 0.0 | 3.878 ±0.092 | 22.637 ±0.015 | 864 | 216 | 29.0 | 156 |
| 0.3 | 0.961 ±0.001 | 0.0 | 4.092 ±0.158 | 13.973 ±0.021 | 432 | 186 | 29.0 | 156 |
| 0.4 | 0.946 ±0.001 | 0.0 | 4.385 ±0.067 | 17.595 ±0.008 | 432 | 288 | 29.0 | 156 |
| 0.5 | 0.926 ±0.001 | 0.0 | 4.735 ±0.143 | 22.884 ±0.033 | 432 | 432 | 29.0 | 156 |
| 0.6 | 0.904 ±0.002 | 0.0 | 4.986 ±0.168 | 26.574 ±0.061 | 370 | 554 | 29.0 | 156 |
| 0.7 | 0.880 ±0.002 | 0.0 | 5.329 ±0.155 | 24.623 ±0.049 | 238 | 554 | 29.0 | 156 |
| 0.8 | 0.855 ±0.002 | 0.0 | 5.562 ±0.093 | 23.144 ±0.058 | 138 | 554 | 29.0 | 156 |
| 0.9 | 0.830 ±0.001 | 0.0 | 5.961 ±0.199 | 22.198 ±0.041 | 62 | 554 | 29.0 | 156 |
IIIA.1. Potential of Mean Force
In order to assess the water-methanol interaction in the context of an interface, the potential of mean force for methanol transfer from vapor to bulk water (represented as TIP4P-FQ33) was determined using umbrella sampling techniques64 coupled with weighted histogram analysis method64,65. For the umbrella sampling calculations, a single methanol molecule was harmonically restrained at various positions along the z-axis of a cubic box of 216 TIP4P-FQ water molecules centered within a larger rectangular box; this geometry effectively simulates a bulk liquid in equilibrium with its vapor. Applying the Weighted Histogram Analysis Method (WHAM)64,65 to the biased probability distribution of finding methanol at a given z-position in the system, we computed the equilibrium potential of mean force (PMF). Our protocol involved umbrella potentials with harmonic force constant of 2 kcal mol−1 Å−2 fixed at 0.5 Å increments beginning at the center of a box of 216 TIP4P-FQ water molecules. Each window was sampled for 2.5 nanoseconds; the statistical uncertainty in the local free energy estimate is obtained via a Monte Carlo bootstrapping procedure as discussed in Grossfield et al66.
Figure 2 shows the potential of mean force for methanol in dilute aqueous solution. Much like for dipole polarizable models of Chang et al. for methanol21, and other small molecules (ethanol, benzaldehyde, and acetone67) the present force field predicts a free energy minimum within the interfacial region. The interface is more stable by 0.8 kcal/mole relative to the bulk taken to be the center. Though the current simulations probe interfaces of more concentrated mixtures, the potential of mean force suggests that surface states of methanol in water are possible with polarizable models as a general behavior; this is exactly the behavior observed in earlier studies67. We observe that there remain differences in the behavior of the potential of mean force depending on the specific force fields applied. In particular, the presence or absence of a second free energy barrier in moving from the interfacial well to the bulk, fully hydrated state shows force field dependence; furthermore, there do not appear to be a systematic behavior unique to polarizable or non-polarizable models67–70.
IIIB. Surface Tension
Surface tension provides one measure of the energetics and composition of the interface. The instantaneous surface tension for the planar slab geometry employed in this study was computed using the statistical mechanical result (difference in normal and tangential pressures)21:
| 8) |
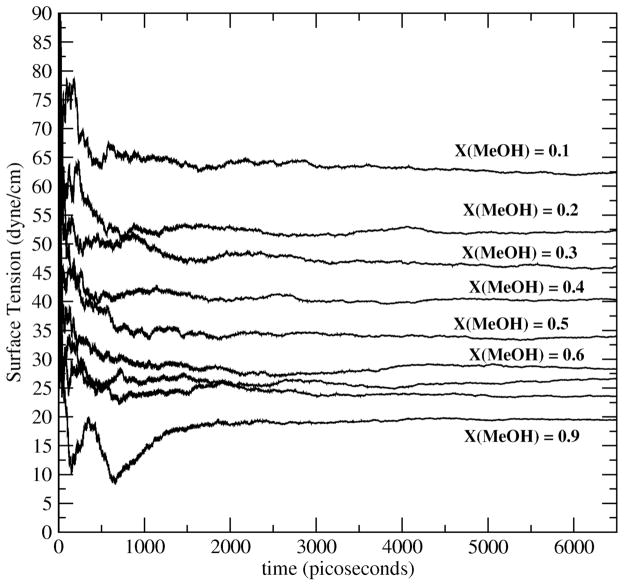
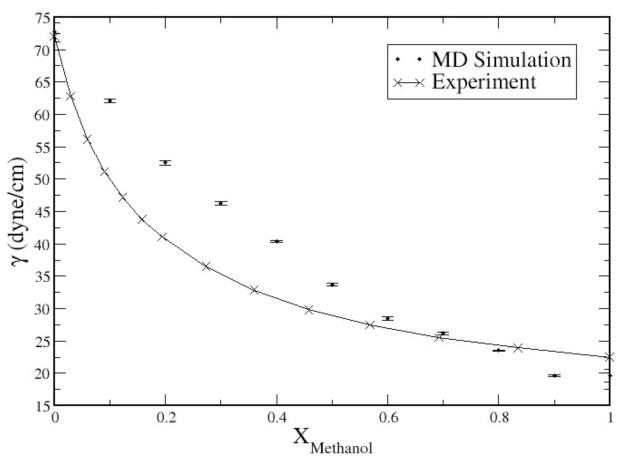
where Pzz is the normal component of the pressure tensor, and Pxx and Pyy the tangential components. Figure 3 shows results from the present work as time series of the instantaneous surface tension values for the concentrations 0.1 to 0.9; Figure 4 shows the numerical data (along with uncertainties) as well as experimental data. It is evident that the current charge equilibration model for methanol coupled to the TIP4P-FQ water model captures the trends in variation of interfacial free energetics with methanol concentration. Surface tension decreases monotonically with methanol concentration. The time required for convergence of computed surface tension values appears to be at least 2 nanoseconds. For methanol mole fractions up to X=0.7, the combination of force fields used in this study overestimates the experimental surface tension values; at the more concentrated methanol solutions, the current force fields underestimate experiment. The behavior for more concentrated solutions is consistent with the lower surface tension of the pure methanol force field (19.66 ±1.0 dyne/cm 41). The quality of the present models is comparable to that of the polarizable models of Chang et al21. We note, however, that Chang et al performed cutoff-based simulations, whereas the present calculations employ particle-mesh Ewald for treating long-range electrostatic interactions. Finally, we observe that for the more dilute concentrations, the experimental surface tensions from Reference 78 fall more sharply as a function of methanol concentration compared to those shown in Chang et al. It is difficult to determine the discrepancy in this at this time.
Figure 3.
Time profiles of surface tension (as given by Equation 8 in text) for mole fractions studied. Simulation results are plotted against experimental data in Figure 4.
Figure 4.
Surface Tension as a function of mol fraction of methanol relative to experiment83. Surface tension for pure methanol was taken from ref41; surface tension for TIP4P-FQ water was taken from ref 84.
IIIC. Methanol and Water Orientation Profiles
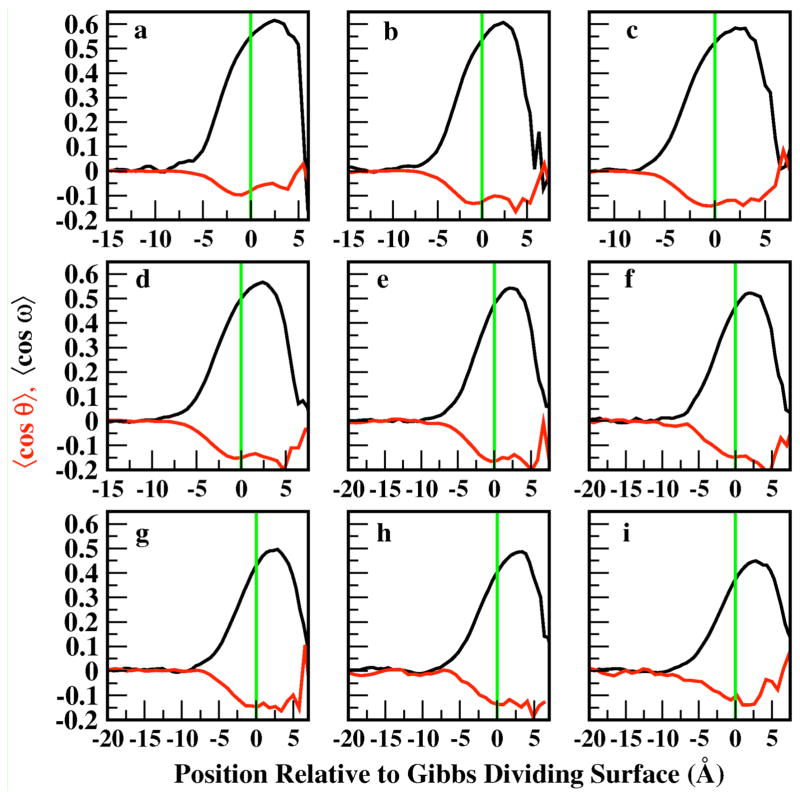
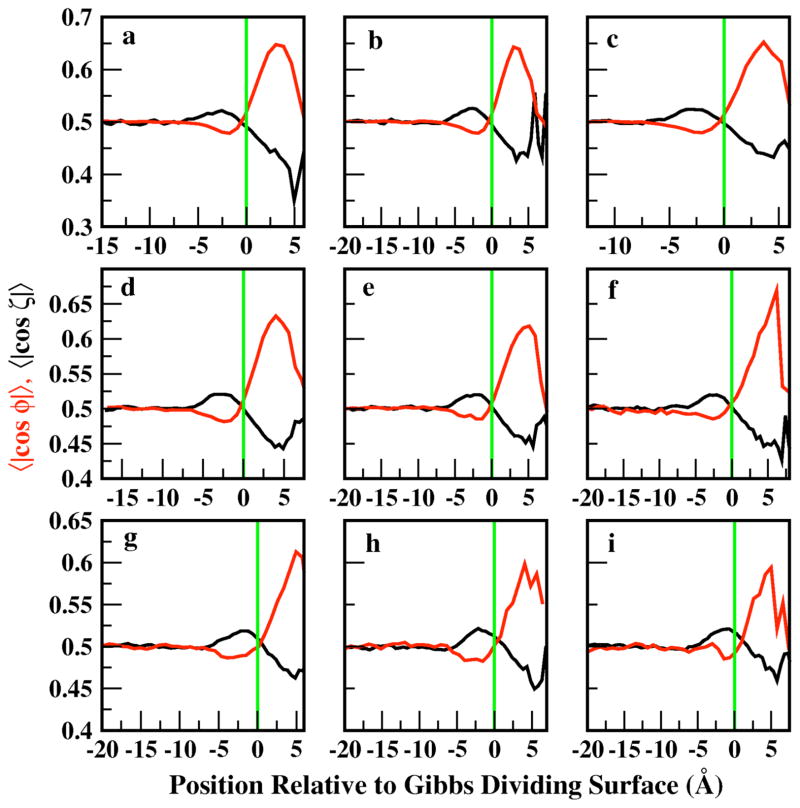
The orientation profiles of the methanol and water molecules allow us to examine average molecular orientational preferences as a function of position relative to the Gibbs Dividing Surface (GDS) and also help elucidate structural influences on observed electrostatic properties at the interface. We analyze the orientation of the molecules via the angles formed between vectors and planes within the molecular coordinate systems and the Z-axis, which is normal to the GDS in the direction of the bulk to the vapor phase, thus providing a natural reference coordinate system for analysis of orientational properties. The orientation profiles for water are described by the angles θ and ϕ, which describe the angle formed by the Z-axis and the permanent dipole vector of water and between the Z-axis and the molecular plane of water, respectively. Methanol orientation is defined via ω, the angle formed between the Z-axis and the hydroxyl hydrogen-C vector, and ζ, the angle formed between the Z-axis and the cross product of the O-H and O-C vectors, . For the purposes of this analysis, we present all orientational profiles in terms of the average cosine of these angles. Within bulk isotropic environments, values of cos(θ) =0 and cos(ω)=0 are anticipated since they represent no net orientational preference of either molecule. Positive values of cos(θ) and negative values of cos(ω) suggest a preference for the molecules to orient themselves such that the hydrogen atoms (hydroxyl hydrogen atoms for methanol) point in the direction of the vapor phase. We consider the absolute value of cos(ϕ) since water’s symmetry results in two indistinguishable perpendicular configurations of the plane to the GDS. Furthermore, |cos(ζ)| is selected for the purposes of direct comparison with |cos(ϕ)| and since the different perpendicular configurations of methanol can be distinguished from the information in the cos(ω) profile. Values of |cos(ϕ)| = 0 and |cos(ζ)| = 1 indicate the respective molecular planes lie parallel to the GDS, while |cos(ϕ)| = 1 and |cos(ζ)| = 0 indicate the molecular plane lies normal to the GDS. Additionally, |cos(ϕ)| = 0.5 and |cos(ξ)| = 0.5 are anticipated for the bulk isotropic environment.
Figure 5 shows the z-dependent profiles for cos(θ) (red curve) and cos(ω) (black curve). The limiting bulk value of 0 for both profiles indicates isotropic orientational preference in the bulk for both water and methanol. At the interface, methanol (black curve) prefers orientations with the hydroxyl hydrogen atom directed away from the vapor phase; equivalently, the methyl group projects, on average, towards the vapor. This is generally accepted behavior of surface-active molecules19–21. Moreover, the intensity of the ordering decreases as methanol mole fraction increases; this is equivalent to a broadening of the distributions of molecular orientations with increasing methanol concentration observed by Chang et al21. Water molecules at the interface complement methanol orientation, aligning with the hydrogen atoms on average pointing slightly into the bulk; these two behaviors then lead to a picture of water and methanol orienting in a manner that accommodates hydrogen bonding. This behavior arises from methanol’s preference for the interface, which is evident in the strong orientational signals in Figure 5; methanol is the predominant species at the interface at all concentrations, and it is strongly oriented. Water, on the other hand, shows much less orientational preference, even at the less concentrated methanol solutions. It is also worthy to note that the statistically significant maximum of the water cos(θ) profile occurs slightly towards the bulk relative to the GDS, and the cos(ω) for methanol towards the vapor side of the GDS; this is again consistent with the predominance of methanol molecules in the outer interfacial regions. The water orientation, particularly at higher methanol mole fractions, is opposite to that observed for pure water in the region above the GDS. This suggests that the dipole potential arising because of this preferential orientation should be reversed relative to the case for pure water. In Section IIIF discussing the concentration dependence of the interfacial dipole potential, we discuss further implications of the predicted orientation. Furthermore, the preference for water’s dipole moment to point slightly towards the bulk phase in the region below the GDS is consistent with studies of pure water at the liquid-vapor interface.
Figure 5.
Profiles describing the orientation of the H(hydroxyl)-C vector of methanol (black) and the permanent dipole vector of water (red) relative to the fixed Z-axis. The profiles for each mole fraction of methanol investigated are featured in ascending order. The solid green vertical line denotes the position of the GDS.
Figure 6 shows z-dependent profiles of the orientations of water and methanol molecular planes relative to the interface normal. For all methanol mole fractions studied, the qualitative trends are similar, again with methanol exhibiting a strong signal and orientational preference in the outer interfacial region. Moreover, at all concentrations, the molecular plane orientations perpendicular to the surface are preferred for both methanol and water above the GDS, although this structural effect is more pronounced for the water. We note that the changes in the methanol concentration leave the peak magnitude of water’s planar orientation relatively unaffected from the previously observed value of approximately 0.65 for pure water. Finally, there is a tendency for both the water and methanol planes to orient slightly parallel to the surface at depths up to 5 Å below the GDS. This is similar to the behavior observed for water in the study by Chang et al 21. Interestingly, the change in preference from parallel to perpendicular configurations coincides remarkably to the GDS position for both methanol and water.
Figure 6.
Profiles related to the orientation of the molecular planes of water (red) and methanol (black) as a function of position. Profiles of all mole fractions of methanol investigated in this study are featured in ascending order. The solid vertical line in each panel denotes the position of the GDS.
IIID. Dipole Moment Profiles
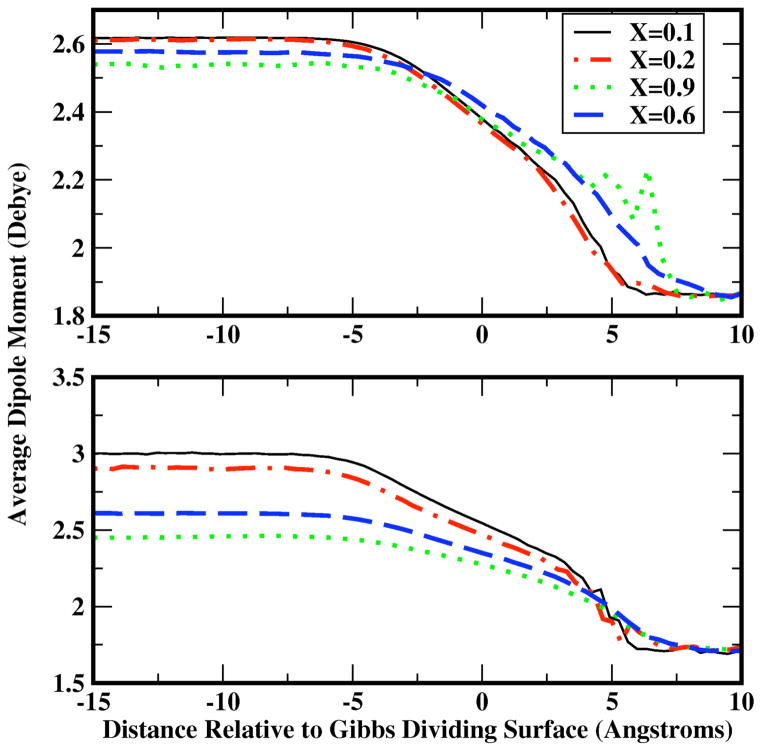
Non-additive potential functions are capable of allowing for a non-trivial electrostatic response to local electric fields arising from differing chemical environments. One measure of such an effect is the behavior of the average molecular dipole moment as a molecule experiences environments ranging from bulk liquid to vapor phase. Figure 7 shows the longitudinal profile of average molecular dipole moments for methanol (bottom) and water (top) for methanol mole fractions of 0.1, 0.2, 0.6, and 0.9. Not surprisingly, both molecular species exhibit a monotonic decrease of the average molecular dipole moment from a bulk solution value for each force field to the single molecule gas-phase value. In the case of water, for the dilute solution case, the water dipole moment decreases monotonically from a bulk value of 2.6 Debye to the gas phase value of 1.85 Debye. The bulk value is just slightly lower than the pure TIP4P-FQ bulk value of 2.62 Debye. The change in condensed phase average molecular dipole moment of water appears to follow a linear trend; the same is true for the methanol dipole moment. This linear change in average dipole moment has been observed for methanol-water bulk solutions56 as well as for mixtures of ethanol and water71. It is interesting that both polarizable models, though based on different formalisms, predict the same qualitative behavior. This points to the generality of such classical approaches to including polarization in molecular systems. Furthermore, we note that the induced methanol dipole in the less concentrated solutions is significantly higher than the water induced dipole in more concentrated solutions. This stems from the fact that methanol force field applied for the present work has a higher molecular polarizability than the water force field41. Thus, induction effects on methanol are, not surprisingly, more pronounced relative to those on water. Similar behavior has been observed for point dipole models 21 as well as the Drude oscillator alcohol models72. There are significant implications for extension of such models to biological systems, such as lipid bilayers, where the low dielectric bilayer interior can induce widely different water molecular dipoles relative to bulk solution.
Figure 7.
Profiles of water (top) and methanol (bottom) molecular dipole moments as a function of distance from Gibbs Dividing Surface (z=0).
IIIF. Interfacial Potential as a Function of Concentration
Despite the number of recent studies of the methanol-water liquid-vapor interface, little attention has been paid to the interfacial electrostatic potential (surface dipole potential) in such systems. Matsumoto and Kataoka 19 reported the earliest studies of the pure methanol liquid-vapor interfacial potential using a non-polarizable force field; Brodskya35 reported early studies of molecular dynamics simulations of spherical droplets of methanol-water mixtures35. The authors report calculated surface dipole potentials at various methanol concentrations. Interestingly, at low methanol concentrations, the authors observe that the majority of the potential drop is accounted for by the distribution of methanol electrostatic moments at the interface; this is consistent with the enhanced surface activity of methanol. We note early pioneering work on surface electrostatics (and interfaces in general) done by Wilson et al73,74 and Matsumoto et al75; the reader is referred to this literature for further details. In the current study, we further consider several aspects of the surface dipole potential as well.
We determine the liquid-vacuum interfacial potential, ϕ(z), for a planar interface by integration of the z-dependent charge density, ρ(Z), according to5,52:
| 9) |
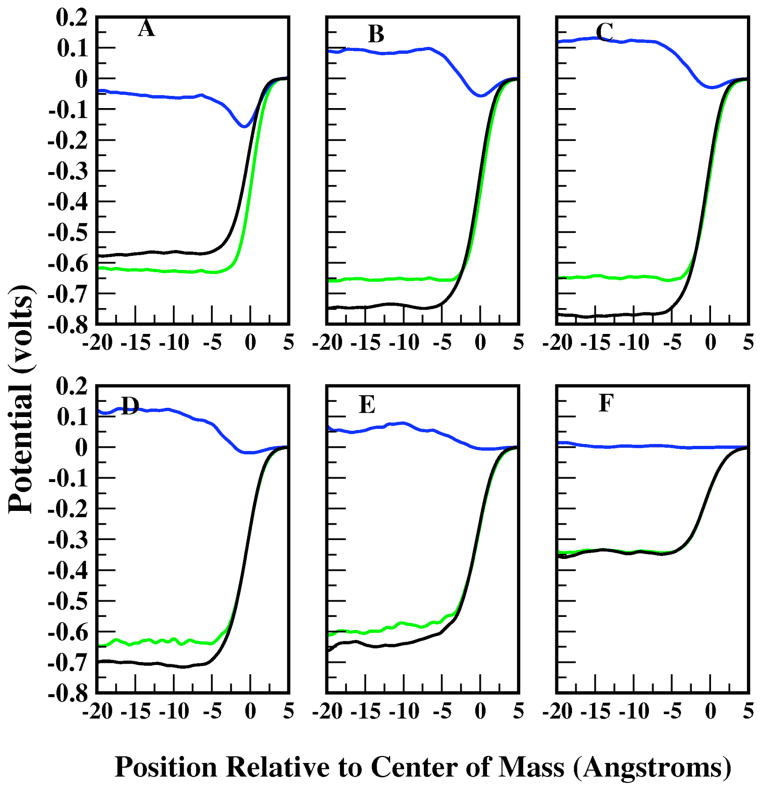
The contributions from water and methanol individually are obtained via integration of the respective component densities. Figure 8 shows the interfacial dipole potential (green curve) along with the contributions from water (blue curve) and methanol (black curve) for methanol mole fractions of 0.1, 0.2, 0.3, 0.4, 0.5, and 0.9. These are selected as they represent the mole fractions exhibiting the more significant trends in the surface potential and particularly in the contributions of water and methanol to the total surface potential. Several trends are evident. First, for all methanol mole fractions, the total potential drop is dominated by the methanol contribution. This is due to the preferential surface localization of methanol molecules arising from the surface activity and associated 0.8 kcal/mole interfacial free energy stability (Figure 2). These predictions are in agreement with the observations of Brodskya et al 35 based on MD simulations of spherical solution droplets. Of particular interest is the water contribution, which for methanol mole fraction of 0.1 exhibits a significantly reduced potential drop relative to the pure liquid (− 0.527V76), but still having the same sign. This is followed by a sign reversal as methanol concentration (bulk and interfacial) increases. The water potential actually increases from vapor to condensed phase, on the order of 0.1 Volts. This is consistent with the orientational preference of water molecules within the second molecular layer from the outer interfacial region. The orientation of water molecules in this region has already been noted to be opposite to that for pure water above the GDS, thus supporting the sign reversal of the water contribution to the interfacial potential. For the most concentrated methanol solution, the contribution from water essentially vanishes.
Figure 8.
Interfacial potential profiles for water (blue), methanol (black), and total (green) contributions for concentrations of 0.1 (A), 0.2(B), 0.3(C), 0.4(D), 0.5(E), and 0.9(F) methanol mol fractions. The Gibbs Diving Surface is located at z=0.0.
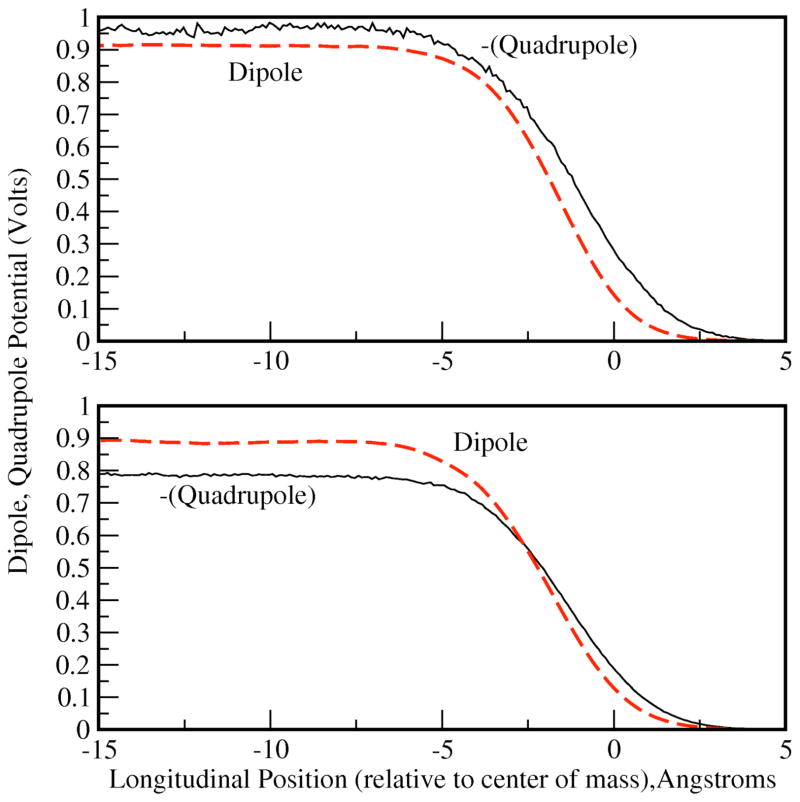
We finally address briefly the decomposition of the total water interfacial potential into its dipole and quadrupole contributions. Figure 9 shows the dipole and quadrupole contributions to the water surface potential for methanol mole fractions 0.1 (top) and 0.2 (bottom). By expanding the charge density in terms of molecule-centered multipole moments, the total interfacial potential may be decomposed into two contributions related to the molecular dipole density, Pz(z)73,
Figure 9.
Water dipole and quadrupole contributions to the interfacial potential shown for methanol mole fractions 0.1(top) and 0.2 (bottom). Both the dipole and quadrupole contributions are of almost equivalent magnitude and opposite sign across all methanol mole fractions studied; shown are representative profiles.
| 10) |
and the molecular quadrupole density73:
| 11a) |
where the indices “m” and “i” denote a molecule and an atomic site within that molecule, respectively. In expanding the molecular moments, we take the water oxygen atom to be our molecule-specific center zm. Since contributions from all higher order moments vanish at distances far from the interface, the total interfacial potential reduces to
| 11b) |
From Figure 9, we observe that for methanol mole fraction 0.1 and 0.2, there is roughly equivalent contribution from both components to the total water interfacial potential; though each individually is large in magnitude for the more dilute concentrations, the opposing signs lead to substantial cancellation. Interestingly, for the most dilute system studied, the quadrupole contribution dominates the total water potential, leading to the net negative potential drop as observed for pure water. At methanol mole fraction 0.2, the relative contributions are reversed, and the overall potential becomes positive. This trend continues with increasing methanol concentration, with the total water contribution decreasing until there is virtually no contribution at concentrated states.
IIIG. Dielectric Permittivity Profiles
Electrostatic properties at the solution-vapor interface play an integral role in mediating transfer processes, interfacial binding and catalysis, and association of small molecules at the solution-vapor interfaces. One can ask about the nature of the variation in dielectric constant across this interface; we next consider the application of an approach developed by Stern and Feller77 for computing the longitudinal profile of the parallel component of the z-dependent dielectric permittivity. We acknowledge a recent approach developed by Nymeyer et al78, but consider the former approach for the present. A comparison of the two methods is beyond the scope of this work.
We compute profiles of the parallel (in-plane) component of the dielectric permittivity using Equations 71 and 26 of Stern and Feller77 for tin-foil boundary conditions:
| 12) |
| 13) |
P||(z) is the local polarization density and M|| is the total system dipole moment. In their formulation, Stern and Feller77 decompose the total fluctuation into contributions from fixed charges and/or dipole and explicit polarization (point dipole polarizabilities); however, in the present approach, the polarization component is self-consistently included in the first term of Equation 13; we note, however, that the infinite frequency component, whose contribution is on the order of a few units79, is omitted in the present approach. We briefly expand on this in the discussion below. The polarization density is computed using a bond-charge approach similar to that outlined in Stern and Feller. Briefly, the charge on a particular atom, i, is determined from a set of bond-charge increments (bci’s), bjk. The bci’s are defined so that each atom (j or k) associated with a particular bci, bjk, receives an amount of charge ±bjk. The total charge on an atom is then a sum over all the contributions from the bond charge increments to which the atom belongs as represented by the following mapping:
| 14) |
with
| 15) |
Given a set of charges, we obtain the bond charge increments, bjk, by inverting the C matrix via singular value decomposition (Stern and Feller77), or for well-conditioned matrices via straightforward inversion. The inverse is computed once for a given molecule (using the minimal topology based description of bond charge increments) and reused for analysis of trajectory snapshots.
The polarization density, P||(z) is computed as a sum of the local bond charge dipole moments in a bin of width dz at a position z. As in Stern and Feller, we use:
| 16) |
The bond dipole is determined simply as:
| 17) |
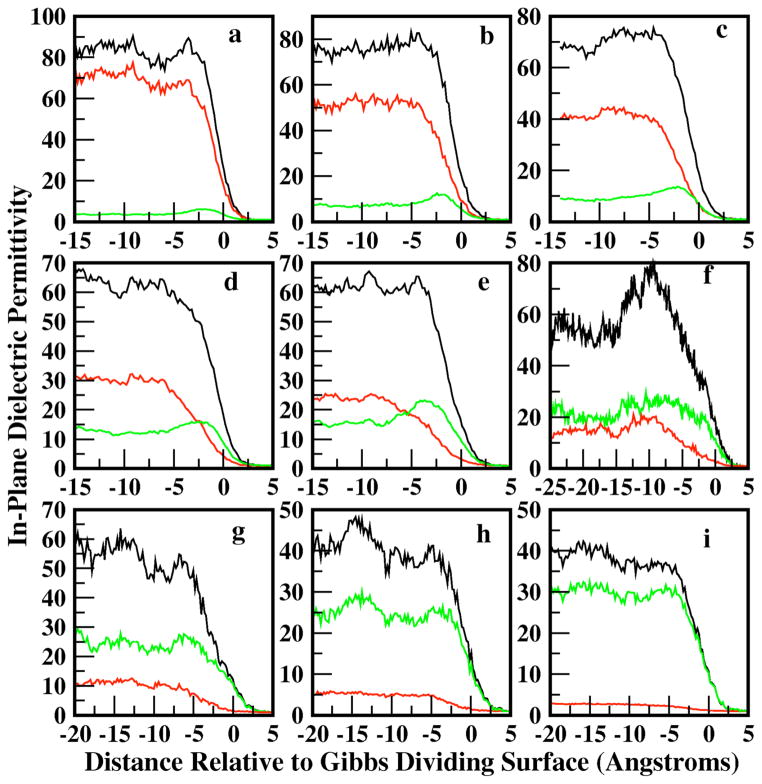
Figure 10 shows the profiles for total, water, and methanol contributions to the in-plane dielectric constant as a function of position along the interface normal. As required, the vapor permittivity of 1 arises naturally from the zero-density of dipoles. Through the interfacial regions, we observe particular trends for the low and high concentration regimes. At all concentrations, the water contribution displays a monotonic variation through the interfacial region. At the lower methanol mole fractions, the in-plane contribution from water dominates the total permittivity, and the water contribution for methanol mole fraction of 0.1 is roughly equivalent to that of pure water; the average total bulk value is predicted to be 85. The water contribution decreases with increasing methanol mole fraction as one would expect. The water in-plane dielectric permittivity profiles in the present surfactant-like system, loosely analogous to the lipid bilayer-water interfacial system, displays similar qualitative behavior observed in DPPC-water and DMPC-water systems. For all methanol concentrations, the total permittivity is not equivalent to a simple sum of the individual contributions, as the cross-terms in Equation 13 are not shown explicitly in Figure 10. This has been discussed in Stern and Feller77.
Figure 10.
Longitudinal profiles of the in-plane dielectric permittivity computed for water (red), methanol (green), and total (black) contributions. The total is not equal to the sum of the individual contributions due to the inclusion of cross-terms in the total permittivity that are not shown explicitly.
The methanol contribution at low mole fractions displays a bulk and interfacial permittivity, identically tracking the density profiles shown in Figure 1. The form of the permittivity profile is again similar to that observed for bilayer-water systems. The surfactant-like nature of the methanol molecules, at low mole fractions, leads to a significant orientational structure, giving rise to a non-monotonic permittivity profile. There is a significant difference in the interfacial water and methanol permittivities, with the methanol value lower as dictated by its pure liquid value. This behavior offers an explanation of recent molecular dynamics simulation studies of inorganic ions at the liquid-vapor interface of pure methanol37. In this study, Dang et al demonstrate a reduced layering of polarizable cations and anions at the liquid-vapor interface of methanol-ion solutions. This behavior is in stark contrast to that observed for aqueous solutions. The present results suggest that the lower dielectric screening effect associated with methanol’s lower dielectric constant (bulk and interfacial) cannot attenuate the strong charge-charge interactions confined to the interfacial region; this prevents the formation of strongly layered charge-charge separation at the interface. In contrast, water’s dielectric, approximately twice as large as that of methanol, appears to adequately modulate the charge-charge interactions to allow formation of layered structures. This analysis represents the first discussion of the dielectric permittivity profile in such systems. We believe that in the context of the recent theoretical and experimental studies of ions at aqueous interfaces, the influence of the dielectric nature of the medium is an important factor to be considered in terms of explaining variations in (an)ion partitioning behavior between systems (vis-à-vis, water versus methanol).
IIIH. Bulk and Interfacial Hydration
We begin a discussion of the nature of hydration of water and methanol in the bulk and at the interface by considering the average number of hydrogen bonds per methanol and water molecule, and the variation of this property with distance from the system center of mass. Figure 11 shows a profile of the average number of hydrogen bonds per water and methanol as a function of distance from the center of mass. The values are determined by computing the total number of hydrogen bonds formed for each molecular species in slabs of thickness of 0.85 Å for each molecular dynamics trajectory, and then divided by the number of molecules of that specie in that slab and the number of snapshots within the trajectory. We consider two molecules to form a hydrogen bond if their H…O distance is less than 2.4 Å and the O-H…O angle is larger than 150°, as suggested by Noskov et al71.
Figure 11.
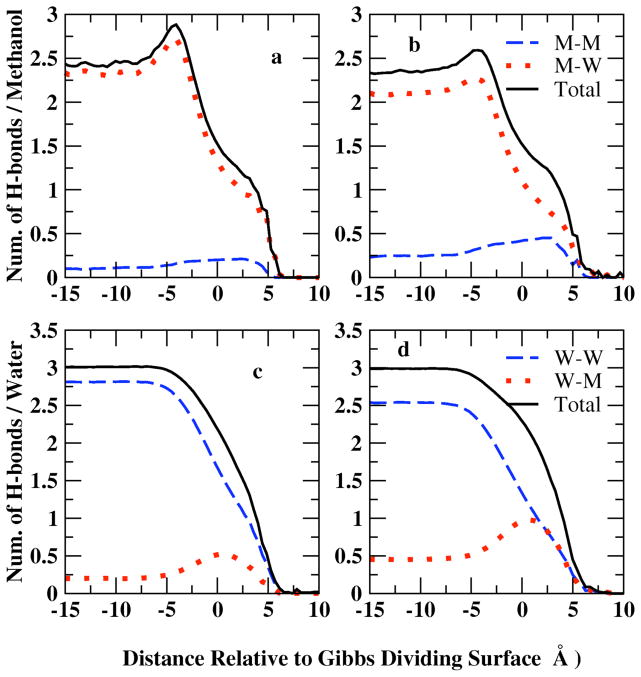
Profile of the average hydrogen bonds, nHb, for the liquid-vapor interfacial system as a function of distance from the Gibbs Dividing Surface at X=0.1 (panel a, c) and X=0.2 (panel b,d) mole fraction. Methanol hydrogen bonds are contributed by methanol-methanol(M-M) and methanol-water(M-W) interactions showed in upper panels (a, b); water hydrogen bonds have water-water (W-W) and methanol-water (M-W) contributions (lower panels c, d)
In Figure 11, panels a and b, the average number of H-bonds per methanol molecule are decomposed into methanol-methanol (M-M), methanol-water (M-W), and total contributions for methanol mole fractions 0.1 and 0.2, respectively. Average number of M-M hydrogen bonds profile shows a similar distribution as the methanol density profile of Figure 1: more hydrogen bonds formed between methanol molecules in the interfacial region. The position of maximum M-W hydrogen bonds per methanol shifts slightly from the surface towards the bulk relative to the M-M peak position due to the higher water density in the bulk. The total methanol hydrogen bonds are contributed mostly by M-W interactions at low mole fractions. When XMethanol=0.2 (panel b), the higher concentration enables formation of more M-M bonds compared to 0.1 mole fraction system (panel a); however, the more dilute system (XMethanol=0.1) favors M-W interactions, thus slightly more hydrogen bonds per methanol in total are found at XMethanol=0.1.
The average number of H-bonds per water molecule is decomposed into water/water (W/W: water associating with another water) and water-methanol (W/M: water associating with a methanol molecule) contributions (Figure 11, panels c and d). M-W profile follows the methanol density distribution while W-W hydrogen bonds show the same trend as water density distribution. W-W hydrogen bonds are more favored than M-W bonds and thus contribute more to the total hydrogen bonds of water molecules. Less M-W bonds are shown at XMethanol=0.1 in panel c because of less methanol molecules, which is compensated by W-W hydrogen bonds in the more dilute system. In bulk region, both concentrations indicate a total number of hydrogen bonds per water around 3.0, consistent with Noskov et al71 of 3.03 and 3.04 from Zhong et al 56,80 in bulk water.
We note that earlier studies13,81 have noted that the presence of methanol (at dilute concentrations) at the interface helps to provide hydrogen bonding partners for unsatisfied water hydrogen bonds, particularly those involving dangling O-H bonds. Benjamin has shown via molecular dynamics using a flexible water model that the computed IR spectra in the region of the free O-H stretch are quenched in the presence of methanol at mole fraction of X=0.18; the authors point to the agreement of their calculations with experimental IR spectroscopic measurements of Du et al81. For the current solvent model, we investigated the fraction of free (un-hydrogen bonded) hydrogen atoms in slabs along the longitudinal coordinate (bulk to interface and into vapor). Our results (not shown) indicate that the enhanced presence of methanol at the interface (in dilute solutions of X=0.2) reduces the fraction of free (vis-à-vis, dangling) O-H bonds at the interface, in qualitative agreement with previous studies. We note that with the present rigid water force field, we cannot compute directly the IR spectrum of interfacial water molecules. Thus, the present analysis, though purely qualitative, nevertheless recapitulates experimental trends.
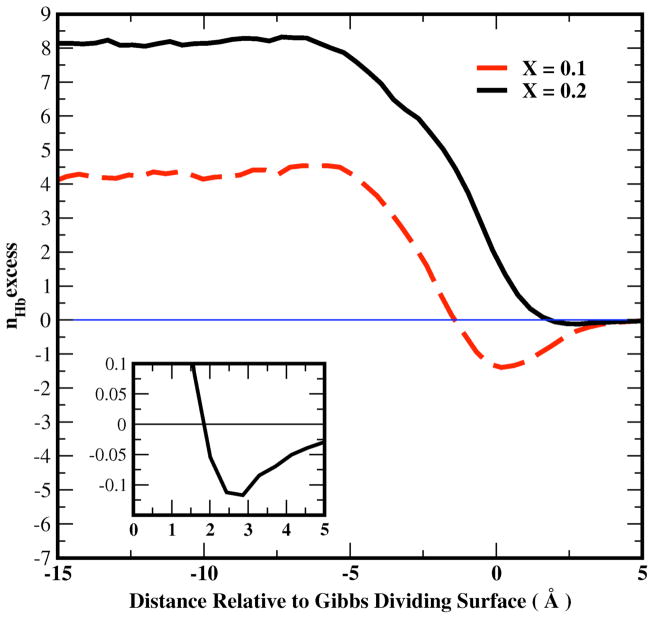
Figure 12 shows the excess hydrogen bonds of water for the liquid-vapor interfacial system as a function of distance from the Gibbs Dividing Surface for X=0.1 and X=0.2 methanol mole fractions, as well as for pure water. The excess number of H-bonds for water within a slab (0.85 Å thick) at given distance z from the GDS is defined as71:
| 18) |
where nHb(z) is the total number of H-bonds for water molecules whose center of mass is in the slab with distance z away from the GDS, and nwat(z) is the number of water molecules in the slab. nidHb is the ideal number of H-bonds per molecule determined by a linear relation between the ideal number of hydrogen bonds, , and local concentration, XMeOH, of the slab:
| 19) |
Figure 12.
Profile of the excess hydrogen bonds of water from Equation 18 in text for the liquid-vapor interfacial system as a function of distance from the Gibbs Dividing Surface 0.1 and 0.2 methanol mole fraction. Inset: profile of excess water hydrogen bonds for X=0.2 for the range starting at the Gibbs Dividing Surface (z=0.0) into the vapor phase; this is done to show the slight hydrogen bond depletion in the outermost regions (well beyond the GDS).
The definitions in Equations 18 and 19 are adopted from Noskov et al71. We emphasize that the H-bond excess number nexcessHb is an extensive property, which is dependent on the number of molecules (both water and methanol) in the system.
Figure 12 shows that bulk water molecules form more hydrogen bonds than the ideal prediction for X=0.1 and X=0.2 methanol mole fractions, while negative hydrogen bond excesses appear at the interface, particularly for X=0.1, and to a significantly lesser degree for X=0.2. The reduction of hydrogen bond excess near the interface follows the water dipole moment behavior in that region, which is consistent with the observation from previous work80 suggesting that the stronger electrostatic interactions that yield higher dipole moments enhance hydrogen bonding. At the lower concentration (X = 0.1), the excess nexcessHb is less than that at X = 0.2 in the bulk and interfacial regions because the total number of molecules at 0.2 mole fraction is larger than that at 0.1, referring to the definition of nexcessHb and its inherent extensivity.
To investigate local hydrogen bond structure, we also examine the excess number of hydrogen bonds for water molecules as a function of distance to the closest methanol molecule. In this case, the excess of water hydrogen bonds within a radial distance R from the nearest methanol Carbon or Oxygen atom to water Oxygen atom, NHb(R), is defined as:
| 20) |
where nHb(r) is the total number of H-bonds for water molecules whose oxygen atom is in the shell of radius r with a thickness of dr, and nwat(r) is the number of water in the shell.
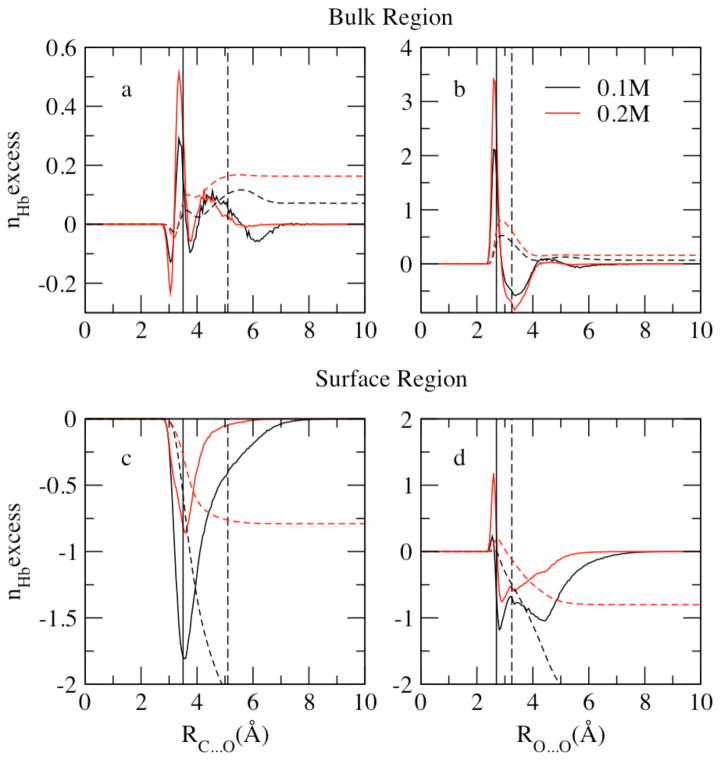
Figure 13 shows the excess H-bonds in a shell of radius r, nHb(r), and the running integral NHb(R) for XMeOH=0.1 and 0.2. Here, we define a molecule in the bulk region when its position relative to the center of mass fulfills −5 < z < 5 Å and in the interfacial region is 15 < |z| < 20 Å. The solid vertical lines show the positions of the first peak of the corresponding radial distribution function (RDF) and dashed vertical lines represent the minimum between the first and second coordination shells.
Figure 13.
Excess hydrogen bond profiles based on the excess H-bonds in a shell of radius r, nHb(r) (solid line) and the running integral NHb(R) (dashed lines) from Equation 18 in text. Distance is defined between methanol carbon atom (C) and water oxygen atom (OW) for panel ac, methanol oxygen atom (OM) and water oxygen atom (OW) for panel bd. The solid vertical lines show the positions of the first peak of the corresponding radial distribution function (RDF) and dashed vertical lines represent the minimum between the first and second coordination shells.
The hydrogen bond excess profiles for water molecules in the bulk (Figure 13, panels a and b) display the same behavior as those for water in ethanol-water mixtures80,82: positive excesses are observed within both the first shell of methanol carbon C and water oxygen Ow RDF (panel a) and the first shell of methanol oxygen Om and water oxygen Ow RDF (panel b). This observation is consistent with the total positive excess in the bulk region shown in Figure 12. In panel a, negative water excess H-bonding is found for water within 3.15Å of methanol carbon and near 4 Å away, which is later compensated by positive contributions from the range of 3.15 Å < RC..O < 3.65 Å and RC..O > 4.1 Å, suggesting different bonding regions in the first shell of C-Ow RDF. Meanwhile, the sharp positive excess peak at the first peak position of Om-Ow RDF indicates that the dominant contribution of positive excess in the first shell comes from water molecules hydrogen bonded to the central methanol. At a higher concentration, (X=0.2 mole fraction) a higher positive excess in both panel a and b due to the larger system size at the higher concentration, which is in agreement with the excess profile shown in Figure 12.
At the interface, less hydrogen bonds are formed relative to the ideal number nidHb for water around methanol molecules (Figure 13 panels c, d), consistent with the negative excess region in Figure 12. In panel d, although water molecules hydrogen binding to methanol still show a positive excess at a separation corresponding to the first peak of the Om-Ow RDF, the total excess in the first shell becomes negative. Since the interfacial region has a higher methanol concentration than the bulk, interfacial water molecules within the hydration shell of the central methanol are easily perturbed by other methanol molecules. Due to the larger size of methanol, fewer hydrogen bonds can be formed per water molecule, which causes the negative excess in total. Meanwhile, the higher concentration (0.2 mole fraction) shows a less negative excess as more methanol molecules are available for hydrogen binding.
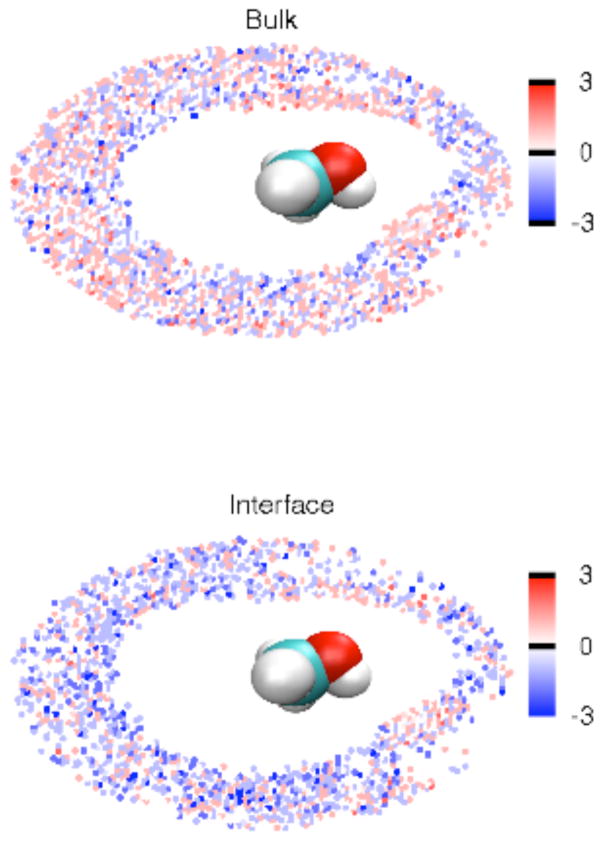
To visualize water hydrogen bonding patterns near methanol molecules, Figure 14 displays H-bond excess of water molecules in the C-O-H plane of the methanol molecule up to a distance of 5 Å (the position of the minimum between the first and second peak of the C-Ow RDF) from the carbon atom at XMeOH = 0.1. Both in bulk and at the interface, water molecules around the methanol hydroxyl group form two positive excess regions (red regions in Figure 14) where water makes hydrogen bonds to methanol as electron donor and acceptor. This observation supports the suggestion from the excess profiles in Figure 13 that water molecules hydrogen bonded to the central methanol dominate the contribution to the positive excess in the first shell. On the other hand, the dip between the two maximum excess regions near the hydroxyl group and the negative (blue) region for water closer to the nonpolar group are the reasons for negative excess shown in profiles (Figure 13). Meanwhile, more blue regions are found at the interface (Figure 14 lower panel) than in the bulk (Figure 14 upper panel), which reveals a weaker hydrogen bonding ability, consistent with the excess profiles (Figure 13, panels a/b versus panels c/d), at the interface.
Figure 14.
Hydrogen bond excess for water molecules in the C-O-H plane of the methanol molecule and up to a distance of 5 Å from the carbon atom at XMeOH = 0.1.
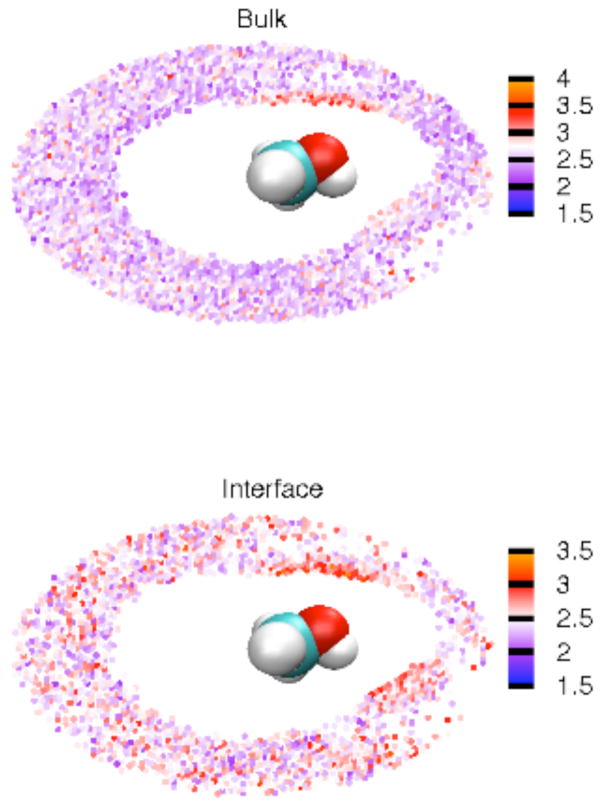
As a final analysis, we computed the average dipole moments for water molecules within the minimum between the first and second maximum of the C-Ow RDF (RC…Ow < 5Å) at XMeOH = 0.1 (Figure 15). In the bulk and the interface region, the dipole moments both show the same connections to the hydrogen bond excess patterns in Figure 13: the more polar environment around the hydroxyl group induces a larger dipole on local water molecules, thus encouraging hydrogen bonding in that area. This dipole moment pattern (Figure 15) is the same as the one for ethanol/water bulk system80 and suggests the enhancing effect of electrostatic interactions on hydrogen bonding as proposed by Figure 12.
Figure 15.
Average dipole moments for water molecules within the minimum between the first and second maximum of the C-Ow RDF (RC…Ow < 5Å) at XMeOH = 0.1.
Compared to the water dipole moments in the bulk (upper panel, Figure 15), we observe a general increase in the average water molecular dipole moment around a central methanol molecule, particularly surrounding the alkyl group, within the interfacial regions (15 < |z| < 20 Å) (lower panel, Figure 14); this Z-range straddles the GDS at X=0.1, and we have ascertained that limiting the range of values to narrower windows centered at higher Z-values does not alter the conclusions of this section. For the present, we examine water and methanol molecular association in the range 15 < |z| < 20 Å. This behavior, superficially, is surprising because the lower interfacial average water dipole moments displayed in Figure 7 and the more negative hydrogen bond excess in Figure 13 (panels c, d) both seem to suggest that there should be lower water dipole moments in Figure 15 lower panel.
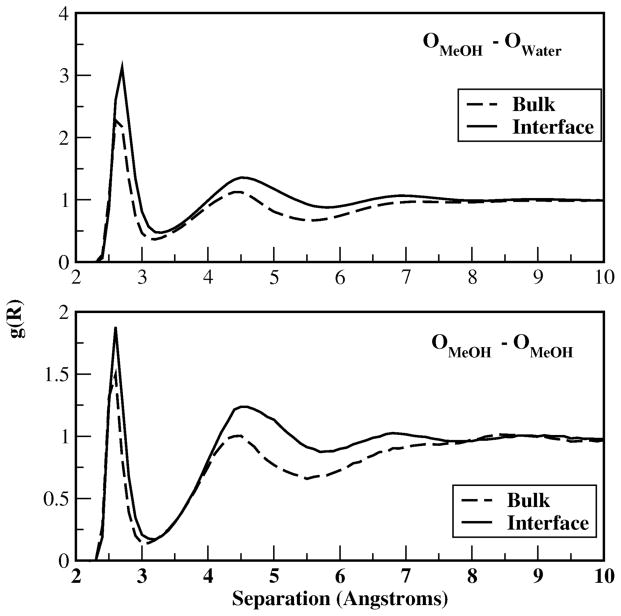
Several reasons for this difference are proposed. First, in the interfacial region, the water density is reduced, along with enhanced methanol aggregation (Figure 16, bottom panel), shown in Figure 1. With a higher methanol concentration, a larger fraction of interfacial water molecules are in close proximity to methanol molecule as displayed in Figure 15 bottom panel, compared to the fraction of bulk water shown in the top panel of Figure 15.
Figure 16.
Radial distribution functions of methanol-methanol oxygens and methanolwater oxygens in the bulk and interfacial regions.
At the interface, the first peak in the water-methanol RDF (Figure 16, top panel) is similar to that in the bulk (due to similar hydrogen bonding geometry regardless of location) but with higher peaks implying more water molecules in the hydration shell of methanol molecule. This observation is in accordance with more methanol-water average hydrogen bonds at the interface as suggested by Figure 11c. Dipole moments for interfacial water in close proximity to a methanol molecule, which are included in Figure 15 lower panel, contribute more to the interfacial average dipole moments at a particular interfacial z-position as displayed in Figure 7, thus the dipole moments shown in Figure 15 bottom panel are closer to the average number in that region. In the bulk, water molecules are less affected by methanol so the average dipole in Figure 7 is close to the pure water dipole moments but larger than the ones displayed in Figure 15 upper panel. On the other hand, the local environment for water molecules near a central methanol also affects the dipole moments in both regions. In the bulk, there is a non-trivial number of water molecules in close proximity to the alkyl group; since the alkyl group is less polar, water molecules in this region experience a reduced electrostatic field, thereby presenting a lower than average dipole moment. In the interfacial region, there are relatively fewer water molecules surrounding any given methanol molecule (water density is reduced as demonstrated by Figure 1). However, those water molecules that do contribute to the density surrounding the alkyl group are, on average, simultaneously associated with the hydroxyl group of a neighboring, clustered methanol molecule. This explains the apparent higher probability of finding water molecules with high dipole moments in the proximity of the methanol molecule in the interfacial region. This is also consistent with the systematic reduction of unsatisfied water hydrogen bonds (hydrogen bond excesses becoming less negative in Figure 12).
IV. Conclusions
We present results from molecular dynamics simulations of methanol-water solutions using charge equilibration force fields to explicitly account for non-additive electronic interaction contributions to the potential energy. We study solutions across the concentration range from 0.1–0.9 methanol mole fraction. At dilute concentrations, methanol density is enhanced at the liquid-vapor interface, consistent with previous molecular dynamics and experimental studies. Interfacial thickness exhibits a monotonic increase with increasing methanol mole fraction, while surface tensions display monotonic decrease with methanol concentration, in qualitative agreement with experimental data and previous molecular dynamics predictions using polarizable force fields. In terms of interfacial structure, in keeping with predictions of traditional force fields, there is a unique preferential orientation of methanol molecules at the interface. Moreover, there is a free energetic preference for methanol molecules at the interface as evidenced by potential of mean force calculations. The pmf calculations suggest an interfacial state with 0.8 kcal/mole stability relative to the bulk, again, in qualitative agreement with previous simulation and experimental studies. Interfacial potentials based on double integration of total charge density range from −610 mV to −330 mV over the dilute to concentrated regimes, respectively. The preponderance of methanol at the interface at all mole fractions gives rise to a dominant methanol contribution to the total interfacial potential. Interestingly, there is a transition of the water surface potential contribution from negative to positive upon the transition from methanol mole fraction of 0.1 to 0.2. The dipole and quadrupole contributions to the water component of the total interfacial potential are effectively of equal magnitude and opposite sign, thus canceling one another. We compute the in-plane component of the dielectric permittivity along the interface normal. We observe a non-monotonic behavior of the methanol in-plane dielectric permittivity that tracks the methanol density profiles at low methanol mole fractions. At higher methanol mole fractions, the total in-plane permittivity is dominated by methanol, and displays a monotonic decrease from bulk to vapor. We finally probe the nature of hydration of water in the bulk versus interfacial regions for methanol mole fractions of 0.1 and 0.2. In the bulk, methanol perturbs water structure so as to give rise to water hydrogen bond excesses. Moreover, we observe negative hydrogen bond excess in the vicinity of the alkyl group, as reported by Zhong et al for bulk ethanol-water solutions using charge equilibration force fields, and positive excess in regions hydrogen bonding to nearest-neighbor methanol molecules. Within the interfacial region, water and methanol density reduction lead to concomitant water hydrogen bond deficiencies (negative hydrogen-bond excess).
References
- 1.Park JY, Renzas JR, Contreras AM, Somorjai GA. Top Catal. 2007;46:217. [Google Scholar]
- 2.MacCallum JL, Bennett WFD, Tieleman DP. Biophysical Journal. 2008;94:3393. doi: 10.1529/biophysj.107.112805. [DOI] [PMC free article] [PubMed] [Google Scholar]
- 3.Senapati S, Berkowitz ML. Phys Rev Lett. 2001;87:176101. doi: 10.1103/PhysRevLett.87.176101. [DOI] [PubMed] [Google Scholar]
- 4.Knipping EM, Lakin MJ, Foster KL, Jungwirth P, Tobias DJ, Gerber RB, Dabdub D, Finlayson-Pitts BJ. Science. 2000;288:301. doi: 10.1126/science.288.5464.301. [DOI] [PubMed] [Google Scholar]
- 5.Pandit SA, Bostick D, Berkowitz ML. Biophys J. 2003;85:3120. doi: 10.1016/S0006-3495(03)74730-4. [DOI] [PMC free article] [PubMed] [Google Scholar]
- 6.Dougan L, Bates SP, Hargreaves R, Fox JP, Crain J, Finney JL, Reat V, Soper AK. J Chem Phys. 2004;121:6456. doi: 10.1063/1.1789951. [DOI] [PubMed] [Google Scholar]
- 7.Dixit S, Crain J, Poon WCK, Finney JL, Soper AK. Nature. 2002;416:829. doi: 10.1038/416829a. [DOI] [PubMed] [Google Scholar]
- 8.Yu H, Geerke DP, Liu H, Gunsteren WFv. J Comp Chem. 2006;27:1494. doi: 10.1002/jcc.20429. [DOI] [PubMed] [Google Scholar]
- 9.Erp TSv, Meijer EJ. Chem Phys Lett. 2001;333:290. [Google Scholar]
- 10.Masella M, Flament JP. Molecular Physics. 1998;95:97. [Google Scholar]
- 11.Dixit S, Soper AK, Finney JL, Crain J. Europhys Lett. 2002;59:377. [Google Scholar]
- 12.Bako I, Megyes T, Balint S, Grosz T, Chihaia V. PCCP. 2008;10:5004. doi: 10.1039/b808326f. [DOI] [PubMed] [Google Scholar]
- 13.Benjamin I. Phys Rev Lett. 1994;73:2083. doi: 10.1103/PhysRevLett.73.2083. [DOI] [PubMed] [Google Scholar]
- 14.Shen YR. Nature. 1989;337:519. [Google Scholar]
- 15.Haslam S, Croucher SG, Hickman CG, Frey JG. Phys Chem Chem Phys. 2000;2:3235. [Google Scholar]
- 16.Salafsky JS, Eisenthal KB. Chem Phys Lett. 2000;319:435. [Google Scholar]
- 17.Salafsky JS, Eisenthal KB. J Phys Chem B. 2000;104:7752. [Google Scholar]
- 18.Partay L, Jedlovszky P, Vincze A, Horvai G. J Phys Chem B. 2005;109:20493. doi: 10.1021/jp0534885. [DOI] [PubMed] [Google Scholar]
- 19.Matsumoto M, Kataoka Y. J Chem Phys. 1988;90:2398. [Google Scholar]
- 20.Partay L, Jedlovszky J, Vincze A, Horvai G. J Phys Chem B. 2008;112:5428. doi: 10.1021/jp711547e. [DOI] [PubMed] [Google Scholar]
- 21.Chang TM, Dang LX. J Phys Chem B. 2005;109:5759. doi: 10.1021/jp045649v. [DOI] [PubMed] [Google Scholar]
- 22.Chang TM, Dang LX, Peterson KA. J Phys Chem. 1997;101:3413. [Google Scholar]
- 23.Dang LX, Chang TM. J Chem Phys. 2003;119:9851. [Google Scholar]
- 24.Rappe AK, Goddard WA., III J Phys Chem. 1991;95:3358. [Google Scholar]
- 25.Itskowitz P, Berkowitz ML. J Phys Chem. 1997;101:5687. [Google Scholar]
- 26.York DM, Yang W. J Chem Phys. 1996;104:159. [Google Scholar]
- 27.Bret C, Field MJ, Hemmingsen L. Molecular Physics. 2000;98:751. [Google Scholar]
- 28.Rick SW. J Chem Phys. 2001;114:2276. [Google Scholar]
- 29.Rick SW, Berne BJ. J Am Chem Soc. 1996;118:672. [Google Scholar]
- 30.Rick SW, Berne BJ. J Phys Chem B. 1997;101:10488. [Google Scholar]
- 31.Rick SW, Stuart SJ. Potentials and Algorithms for Incorporating Polarizability in Computer Simulations. In: Lipkowitz KB, Boyd DB, editors. Reviews in Computational Chemistry. John Wiley and Sons, Inc; 2002. p. 89. [Google Scholar]
- 32.Rick SW, Stuart SJ, Bader JS, Berne BJ. Journal of Molecular Liquids. 1995;65/66:31. [Google Scholar]
- 33.Rick SW, Stuart SJ, Berne BJ. J Chem Phys. 1994;101:6141. [Google Scholar]
- 34.Banks JL, Kaminski GA, Zhou R, Mainz DT, Berne BJ, Friesner RA. J Chem Phys. 1999;110:741. [Google Scholar]
- 35.Brodskaya EN. Colloid Journal. 2001;63:10. [Google Scholar]
- 36.Wick CD, Dang LX, Jungwirth P. J Chem Phys. 2006;125:024706. doi: 10.1063/1.2218840. [DOI] [PubMed] [Google Scholar]
- 37.Dang LX. J Phys Chem A. 2004;108:9014. [Google Scholar]
- 38.Patel S, Brooks CL., III J Comp Chem. 2004;25:1. doi: 10.1002/jcc.10355. [DOI] [PubMed] [Google Scholar]
- 39.Patel S, MacKerell AD, Jr, Brooks CL., III J Comp Chem. 2004;25:1504. doi: 10.1002/jcc.20077. [DOI] [PubMed] [Google Scholar]
- 40.Patel S, Brooks CL., III Molecular Simulation. 2006 in press. [Google Scholar]
- 41.Patel S, Brooks CL., III J Chem Phys. 2005:122. doi: 10.1063/1.1827604. [DOI] [PubMed] [Google Scholar]
- 42.Patel S, Brooks CL., III J Chem Phys. 2005;123:164502. doi: 10.1063/1.2009730. [DOI] [PubMed] [Google Scholar]
- 43.Parr RG, Yang W. Density-Functional Theory of Atoms and Molecules. Oxford University Press; Oxford: 1989. [Google Scholar]
- 44.Sanderson RT. Science. 1951;114:670. doi: 10.1126/science.114.2973.670. [DOI] [PubMed] [Google Scholar]
- 45.Sanderson RT. Chemical Bonds and Bond Energy. 2. Academic; New York: 1976. [Google Scholar]
- 46.Nalewajski RF, Korchowiec J, Zhou Z. International Journal of Quantum Chemistry: Quantum Chemistry Symposium 22. 1988;22:349. [Google Scholar]
- 47.Roberts JE, Woodman BL, Schnitker J. Molecular Physics. 1996;88:1089. [Google Scholar]
- 48.Svishchev IM, Kusalik PG, Wang J, Boyd RJ. Journal of Chemical Physics. 1996;105:4742. [Google Scholar]
- 49.Kaminski GA, Friesner RA, Zhou R. J Comput Chem. 2003;24:267. doi: 10.1002/jcc.10170. [DOI] [PubMed] [Google Scholar]
- 50.Wang F, Jordan KD. Journal of Chemical Physics. 2002;116:6973. [Google Scholar]
- 51.Lamoureux G, Roux B. Journal of Chemical Physics. 2003;119:3025. [Google Scholar]
- 52.Lamoureux G, Mackerell AD, Jr, Roux B. Journal of Chemical Physics. 2003;119:5185. doi: 10.1063/5.0019987. [DOI] [PMC free article] [PubMed] [Google Scholar]
- 53.Car R, Parrinello M. Phys Rev Lett. 1985;55:2471. doi: 10.1103/PhysRevLett.55.2471. [DOI] [PubMed] [Google Scholar]
- 54.Warren GL, Davis JE, Patel S. J Chem Phys. 2007;128:144110. doi: 10.1063/1.2872603. [DOI] [PMC free article] [PubMed] [Google Scholar]
- 55.Brooks BR, Bruccoleri RE, Olafson BD, States DJ, Swaminathan S, Karplus M. J Comp Chem. 1983;4:187. [Google Scholar]
- 56.Zhong Y, Warren GL, Patel S. J Comput Chem. 2008;29:1142. doi: 10.1002/jcc.20877. [DOI] [PMC free article] [PubMed] [Google Scholar]
- 57.Nose S. Mol Phys. 1984;52:255. [Google Scholar]
- 58.Darden T, York D, Pederson L. J Chem Phys. 1993;98:10089. [Google Scholar]
- 59.Lamoureux GaRB. J Phys Chem B. 2006;110:3308. doi: 10.1021/jp056043p. [DOI] [PubMed] [Google Scholar]
- 60.Chelli R, Procacci P, Righini R, Califano S. J Chem Phys. 1999;111:8569. [Google Scholar]
- 61.Paul S, Chandra A. J Chem Theory and Comp. 2005;1:1221. doi: 10.1021/ct050098d. [DOI] [PubMed] [Google Scholar]
- 62.Cheng J, Hoffman MR, Colussi AJ. J Phys Chem B. 2008:112. doi: 10.1021/jp712010k. [DOI] [PubMed] [Google Scholar]
- 63.Rowlinson JS, Widom B. Molecular Theory of Capillarity. Clarendon Press; Oxford: 1982. [Google Scholar]
- 64.Kumar S, Rosenberg JM, Bouzida D, Swendsen RH, Kollman PA. J Comp Chem. 1995;16:1339. [Google Scholar]
- 65.Kumar S, Bouzida D, Swendsen RH, Kollman PA, Rosenberg JM. J Comp Chem. 1992;13:1011. [Google Scholar]
- 66.Grossfield A, Ren P, Ponder JW. J Am Chem Soc. 2003;125:15671. doi: 10.1021/ja037005r. [DOI] [PubMed] [Google Scholar]
- 67.Canneaux S, Soetens JC, Henon E, Bohr F. Chemical Physics. 2006;327:512. [Google Scholar]
- 68.Garrett BC, Schenter GK, Morita A. Chemical Reviews. 2006;106:1355. doi: 10.1021/cr040370w. [DOI] [PubMed] [Google Scholar]
- 69.Taylor RS, Shields RL. J Chem Phys. 2003;119:12569. [Google Scholar]
- 70.Taylor RS, Garrett BC. J Phys Chem B. 1999;103:844. [Google Scholar]
- 71.Noskov SY, Lamoureux G, Roux B. J Phys Chem B. 2005 doi: 10.1021/jp045438q. [DOI] [PubMed] [Google Scholar]
- 72.Anisimov VM, Vorobyov IV, Roux B, Alexander D, MacKerell J. Journal of Chemical Theory and Computation. 2007;3:1927. doi: 10.1021/ct700100a. [DOI] [PMC free article] [PubMed] [Google Scholar]
- 73.Wilson MA, Pohorille A, Pratt LR. J Chem Phys. 1988;88:3281. doi: 10.1063/1.453923. [DOI] [PubMed] [Google Scholar]
- 74.Wilson MA, Pohorille AP, Pratt LR. J Phys Chem. 1987;91:4873. doi: 10.1021/j100303a002. [DOI] [PubMed] [Google Scholar]
- 75.Matsumoto M, Takaoka Y, Kataoka Y. J Chem Phys. 1993;98:1464. [Google Scholar]
- 76.Warren GL, Patel S. J Chem Phys. 2007;127:17705614. doi: 10.1063/1.2771550. [DOI] [PubMed] [Google Scholar]
- 77.Stern H, Feller SE. J Chem Phys. 2003;118:3401. [Google Scholar]
- 78.Nymeyer H, Zhou HX. Biophys J. 2008;94:1185. doi: 10.1529/biophysj.107.117770. [DOI] [PMC free article] [PubMed] [Google Scholar]
- 79.Vorobyov IV, Anisimov VM, Alexander D, MacKerell J. J Phys Chem B. 2005 doi: 10.1021/jp053182y. [DOI] [PubMed] [Google Scholar]
- 80.Zhong Y, Patel S. J Phys Chem B. 2008 Article ASAP. [Google Scholar]
- 81.Du Q, Freysz E, Shen YR. Science. 1994;264:826. doi: 10.1126/science.264.5160.826. [DOI] [PubMed] [Google Scholar]
- 82.Zhong Y, Patel S. J Phys Chem B. 2009;113:767. doi: 10.1021/jp807053p. [DOI] [PubMed] [Google Scholar]
- 83.Vazquez G, Alvarez E, Navza JM. J Chem Eng Data. 1995;40:611. [Google Scholar]
- 84.Bauer BA, Warren GL, Patel S. Journal of Chemical Theory and Computation. 2009;5:359. doi: 10.1021/ct800320f. [DOI] [PMC free article] [PubMed] [Google Scholar]


