Abstract
We present in this paper a systematic study of the distance dependent detection characteristics of the newly developed micro-ring resonator (MRR)-based ultrasonic detector for photoacoustic microscopy (PAM). A simple analytic model was first developed to study the steady-state response to the continuous ultrasonic waves. While placing the MRR detector at the acoustic far-field provides longer working distance and broader field of view, the detection at acoustic near-field offers the improved sensitivity and broader bandwidth but at the cost of reduction in the field of view. Furthermore, a numerical model was developed to analyze the transient response to the photoacoustic-induced impulsive waves. Notably, far-field detection exhibits a flat wavefront of its response pattern in the time domain while large distortions are clearly visible in the case of near-field detection. Finally, both analytic and numerical models are validated by experimental studies. This work establishes a theoretical framework for quantitatively analyzing the trade-offs between near-field and far-field detection using MRR detector, creating a guideline for optimizing the PAM for various applications in biomedical imaging and diagnostics.
I. INTRODUCTION
Optical microscopy technologies, such as confocal microscopy,1 structured illumination microscopy,2 and stimulated emission depletion microscopy,3 can provide high spatial resolution for imaging biological tissues. However, as biological tissues are highly scattering for optical waves, these traditional microscopy modalities encounter the difficulty in imaging thick samples at depths that are beyond the optical diffusion limit.4 Photoacoustic microscopy (PAM) was developed to overcome such limitations for deep tissue imaging.5 In PAM, tissue that absorbs the energy from the short pulse excitation laser undergoes a rapid thermo-elastic expansion and thus acoustic wave emissions. Detecting the resulting propagating acoustic waves at the surface fully reveals the local optical absorption contrast deep inside the tissue without being subject to the optical diffusion limit. The broad range of optical absorption contrast sources, varying from nuclei,6 cells,7 tissues,8 to organs,9 enables PAM to study the anatomical and functional information of a specimen, such as the metabolic rate of oxygen,10 transcranial brain imaging of animals,11 and lipid concentrations.12
In the early studies, piezoelectric detectors were widely used to measure the acoustic waves in the PAM system, but they were often accompanied by major drawbacks that severely limited both axial and lateral resolutions. The axial resolution was restricted by the finite operational bandwidth of piezoelectric detectors. Although sub-wavelength lateral resolution can be achieved in optically thin samples using a high numerical aperture (NA) optical focusing lens under the transmission mode,13 the lateral resolution was constrained by small NA lenses in most applications operating under the back-reflection mode, due to the fact that a longer working distance is required to accommodate the sizable piezoelectric detectors or acoustic setups to redirect the PA waves to the detector.14,15 In contrast, optical-based detection techniques using non-piezoelectric materials offer a promising solution in overcoming these limitations.16–23 Measuring the acoustic waves using the rapidly oscillating optical field offers the unique advantage of a much broader detection bandwidth and thus, improved axial resolution. In addition, the advancement in photonic integrated circuits makes it possible to create a miniaturized acoustic detector that allows compromising the short working distance of a high NA objective lens.
Among the wide variety of the optical-based ultrasound detection techniques being reported in the literature,16–23 the micro-ring resonator (MRR) is considered as the most promising solution that enables sensitive ultrasound detection in an extremely miniaturized package. The MRR ultrasonic detector is composed of closely spaced bus waveguide and ring waveguide made of soft polymeric material, as shown in Fig. 1. The bus waveguide serves as the input and output ports, while the ring waveguide supports whisper gallery mode (WGM)24 due to the constructive interference of the light circulating within. The light waves confined within the bus waveguide and the ring waveguide are coupled evanescently through a low dielectric gap. Matching the coupling loss with the intrinsic loss in the ring waveguide will result in zero transmission at the resonance frequencies, which is normally referred to as the critical coupling condition.25 The incident acoustic waves change the size of the ring waveguide as well as the refractive index of polymeric materials. These changes collectively alter the effective optical path length of the corresponding ring waveguide. It results in a shift in the resonant frequency that can be conveniently monitored by measuring the modulation of the transmitted optical signal through the bus waveguide using a narrowband laser source. The effective optical path length is greatly magnified by several orders of magnitude through the high-Q optical resonance, thereby achieving highly sensitive ultrasonic detection. The optical-based detection method offers broader detection bandwidth that warrants superior axial resolution in PAM imaging.26 Finally, such a miniaturized detector is not only compatible with the high-NA focusing lens, but also features a larger detection angle, leading to an increased field of view (FOV).27 Notably, we have demonstrated the optically transparent MRR detector for highly sensitive ultrasound detection over a wide receiving angle with a bandwidth of 140 MHz.28 While the detector is capable of detecting the high frequency ultrasonic signals up to GHz range, soft tissues are found to strongly attenuate the ultrasonic waves at frequencies above 100 MHz.29 The presence of strong attenuation practically limits the bandwidth of the ultrasonic detector being placed at a distance away. Furthermore, the PA induced ultrasonic excitation from an optical diffraction-limited spot can be treated as an ultrasonic monopole source and thus, the rapid diverging spherical ultrasonic waves cause additional reduction of the power density along the radial direction. While moving the detector closer represents an attractive solution to effectively reduce the attenuation of the high-frequency ultrasonic signals, additional technical issues arise when the detector is in close proximity to the PA emission site. For example, angular detection range may be greatly reduced as the size of MRR detector becomes comparable with the working distance in the acoustic near-field, as opposed to the far-field case. Therefore, to better understand the distance dependent detection characteristics, we report the systematic study of ultrasonic detection using MRR in both acoustic near-field and far-field. All theoretical analyses are validated by experimental studies.
FIG. 1.
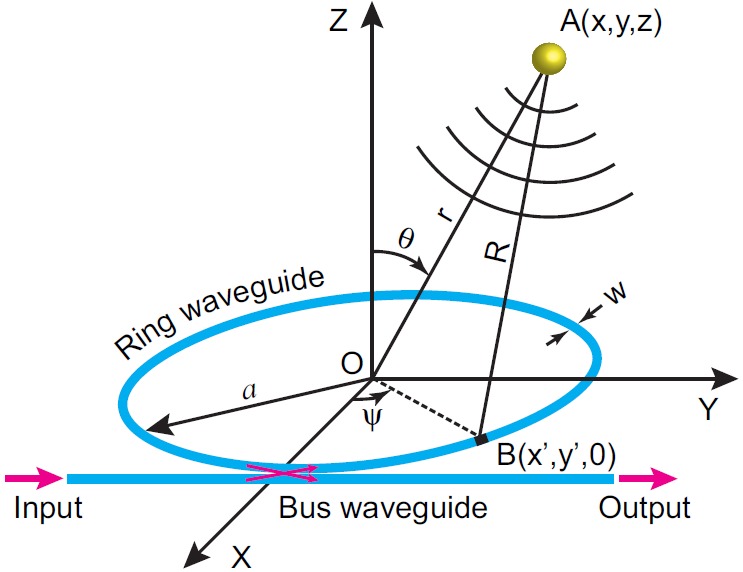
Schematic of micro-ring resonator and its response to acoustic source. A (x, y, z) and B (x′, y′, 0) are the positions of the source and the representative point on the MRR, respectively; R is the distance between source and ring; a and w are the radius and width of the ring waveguide; Ψ, θ, and r are the azimuthal angle, polar angle, and radial distance, respectively.
II. THEORETICAL ANALYSIS AND DISCUSSION
A. Steady-state response to the continuous ultrasonic wave
Fig. 1 illustrates the geometry of MRR ultrasonic detector and coordinate system used in our theoretical analysis. The ring waveguide and straight bus waveguide are located within the x-y plane, and y-axis is parallel to the bus waveguide. The thicknesses of the waveguides are neglected in this model. The origin of the coordinate system is located in the center of the ring. The PA excitation generated by the focused laser beam is represented by an ultrasonic monopole source located at A (x, y, z). The generated spherical acoustic waves that propagate through surrounding medium will be detected by MRR. The calculation of detected pressure is mathematically equivalent to the pressure generated by a ring-shaped piston, which can be written as the Rayleigh integral30
| (1) |
where p is the detected pressure, is the time derivative of source variation, v0 is the speed of sound in the medium, and is the conversion factor, respectively. R can be written explicitly as from the given geometry. We first consider the emission of the continuous ultrasonic waves in the form of the time harmonic: . In this case, the amplitude of the pressure becomes
| (2) |
where dS = 2awdψ.
As expected, the amplitude produced by a monopole source is proportional to its frequency.31 To better understand the distance dependent detection characteristics, we have therefore removed the frequency term from Eq. (2). The spatial response pattern of the MRR can be calculated explicitly from the analytical expression
| (3) |
The geometry and material properties of the MRR are extracted from our previous experimental studies.28 Specifically, the ring diameter is 60 μm and the width of the waveguide is 800 nm. The calculation being performed in the x-z plane is considered a sufficient representation because of the underlying rotational symmetry of the z-axis. The surrounding medium in which acoustic waves propagate is water, with speed of sound v0 = 1496.65 m/s at temperature T = 25 °C.32 The spatial responses of the MRR at four different acoustic frequencies are shown in Fig. 2. Propagation loss due to the attenuation in the water is not yet considered in this case.
FIG. 2.

Spatial response in x-z plane of MRR to acoustic monopole sources at different ultrasonic frequencies f in water without considering attenuation: (a) 20 MHz, (b) 50 MHz, (c) 100 MHz, and (d) 200 MHz.
When the frequency increases, the spatial response shown in Fig. 2 evolves with the appearance of an increasing number of side lobes in addition to the central maximum aligned with the center of the ring. For instance, at low frequency f = 20 MHz, the spatial response pattern only possesses one central maximum without any side lobes (Fig. 2(a)). At higher frequencies, the spatial response pattern exhibits more and more side lobes besides the central maximum (Figs. 2(b)–2(d)). In addition, strong responses are found in the close proximity to the location of the ring (x = ±30 μm), which is the unique characteristic not found in the far-field. Overall, the ring-shaped ultrasonic detector exhibits a very strong distance-dependent response to the ultrasonic waves emitted from the monopole source.
For the convenience of discussion, we categorized the spatial response into the near-field and the far-field regions using the classic definition of the crossover point between the Fresnel and Fraunhofer zone ,33 where D is the ring diameter and λ is the acoustic wavelength, respectively. For simplicity, df = 60 μm was assumed by using the median frequency of f = 100 MHz over the targeted frequency range between 20 MHz and 200 MHz. Three cases will be discussed in the following context by comparing the source z distance and df for (1) extreme near-field (z = 10 μm), (2) near-field (z = 45 μm), and (3) far-field (z = 450 μm) regions.
In Fig. 3, we show the frequency dependent response pattern in the extreme near-field region (z = 10 μm, Fig. 3(a)), the near-field region (z = 45 μm, Fig. 3(b)), and the far-field region (z = 450 μm, Fig. 3(c)). For all of three patterns, one strong center band is accompanied by relatively weak side bands located on both sides. At the given z distance and acoustic frequency, FOV is determined by the width of the center band in x-axis. Clearly, FOV decreases when the frequency increases at a given z distance. Although these three response patterns appear similar to each other, the FOV is markedly different as the x-axes in these three plots are not in the same scale. The frequency-dependent performance characteristics of MRR detector are shown in Fig. 4. One is the PA amplitude detected by MRR to the acoustic source located along the z-axis. As shown in Fig. 4(a), at the given distance z, the calculated amplitudes remain constants over the frequency range from 20 MHz to 200 MHz. The amplitudes are inversely proportional to the working distance, which is caused by the diverging spherical acoustic waves. For a better visualization, the calculated amplitudes at near-field (z = 45 μm) and far-field (z = 450 μm) are multiplied by a factor of 1.5 and 10, respectively. The other parameter is FOV, which determines the imaging area at a given working distance. Fig. 4(b) reveals the reduction of FOV at higher acoustic frequency, which indicates the underlying constrain of FOV and the axial resolution. Nevertheless, the FOV in the far-field (z = 450 μm) is more than one order of magnitude larger compared to the near-field (z = 45 μm). As the source is moving closer to the extreme near-field region (z = 10 μm), FOV will be reduced further. We can conclude that in an ideal case without considering attenuation and background noise, far-field detection has the same axial resolution as near-field case while producing a larger FOV.
FIG. 3.

Frequency response without considering attenuation in (a) the extreme near-field (z = 10 μm), (b) near-field (z = 45 μm), and (c) far-field (z = 450 μm) regions.
FIG. 4.
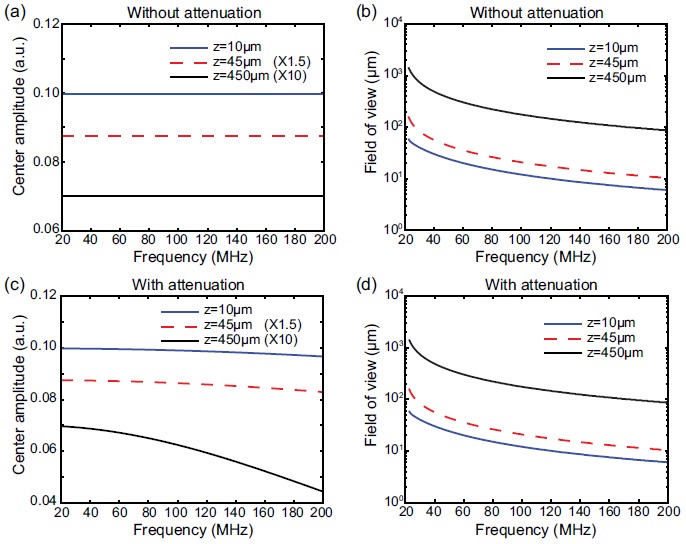
(a) and (b) show center amplitude and field of view, respectively, with respect to frequencies without considering attenuation in the medium. (c) and (d) are the corresponding cases that consider the attenuation in water.
In a more realistic scenario, the higher frequency components of ultrasound usually decay faster in the medium. The attenuation of the acoustic wave can be empirically expressed as , where p0 is the initial acoustic pressure, pd is the pressure after the acoustic wave travels over the distance d, f is the acoustic frequency, and α is the decay factor, respectively. In water, the decay factor α is .34 Figs. 4(c) and 4(d) are simulation results which correspond to Figs. 4(a) and 4(b) with the acoustic attenuation by water. The decay will not substantially affect the FOV, as a comparison of Figs. 4(b) and 4(d) depicts. However, it plays an important role in the detection sensitivity. Fig. 4(c) shows the rapid decreasing of the amplitude at higher frequency as opposed to maintaining a constant value in the lossless case (Fig. 4(a)). While the modest decreases in amplitude are found at both extreme near-field region (z = 10 μm) and the near-field region (z = 45 μm), the amplitude decreases remarkably faster in the far-field region (z = 450 μm). Therefore, one can conclude that acoustic detection in the near-field region is preferable in achieving higher axial resolution, but at the cost of reduction in the FOV. The formulation discussed here offers a tangible solution for researchers to quantitatively evaluate the trade-off between the above-mentioned competition processes.
B. Transient response to the photoacoustic impulsive wave
It is worthwhile to note that PA induced ultrasonic emissions usually contain the transient signal in the form of an impulsive wave instead of a continuous wave. Although the analytic formula discussed above offers the convenience to capture the steady-state response, we further study the transient response to the PA impulsive wave using a numerical model. In the frequency domain, a Gaussian-shaped PA impulsive wave with center frequency at 100 MHz and full width at half maximum (FWHM) of 140 MHz is generated as the representative acoustic source (Fig. 5(a)). Its corresponding time domain signal is depicted in Fig. 5(b) with the pulse duration of about 15 ns. When we substitute this source into Eq. (1), we can numerically calculate the response of MRR in the presence of an impulsive excitation.
FIG. 5.
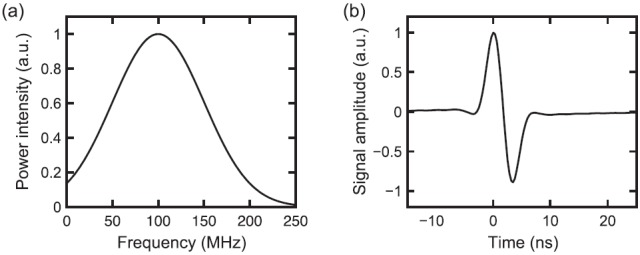
(a) The frequency domain waveform of the generated acoustic impulse and (b) the corresponding time domain signal.
Figs. 6(a) and 6(b) represent simulation results for time domain signals in the far-field region (z = 450 μm) and near-field region (z = 45 μm), respectively. For both regions, if the acoustic source is located exactly along the z-axis of the MRR detector, then it has an equal path length in reaching the ring-shaped detector due to the underlying rotational symmetry. The acoustic waves are all in phase and therefore, the resulting collective interaction with the ring will precisely follow the original waveform of the ultrasonic impulses. As the acoustic source is moving away from the z-axis, the differences of path length in reaching the MRR can no longer be neglected and the resulting phase retardation tends to deform the original acoustic waveform. In the far-field region, the distance of source to the MRR is significantly larger than the size of the MRR, leading to the small phase difference, thereby relatively flat wavefront over a wide x range, as depicted in Fig. 6(a). In contrast, the near-field region signal shown in Fig. 6(b) exhibits a more distorted wavefront because the size of the MRR becomes comparable or even larger than the working distance. Figs. 6(c) and 6(d) show the corresponding frequency response for far-field and near-field regions, respectively. For better visualization of FOV, the frequency responses are normalized to the maximum amplitude at each frequency. As an impulse can be conceived as the superposition of sinusoidal waves at different frequencies, the Fourier transform of the transient response is identical to the frequency responses calculated in the steady-state, shown in Fig. 3. Thus, the conclusion derived from steady-state simulation in regards to detection characteristics in the frequency domain is also applicable to the transient state.
FIG. 6.
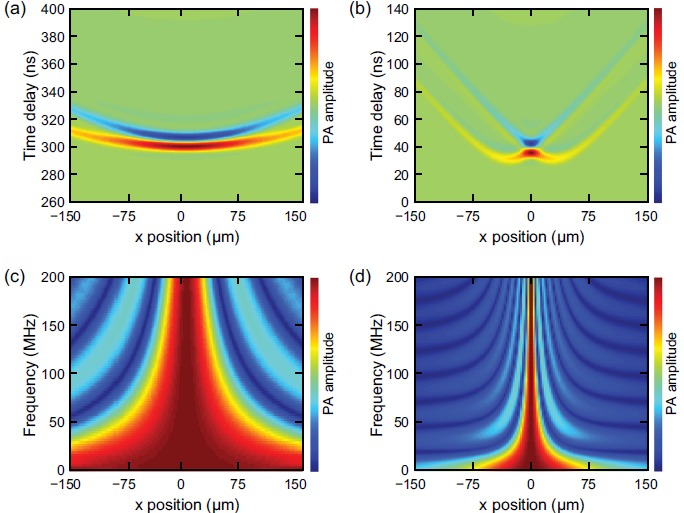
(a) and (b) are the simulated time domain signals in the far-field region (z = 450 μm) and near-field region (z = 45 μm), respectively; (c) and (d) are their corresponding frequency response.
III. EXPERIMENTS AND DISCUSSION
The theoretical analysis discussed above is validated experimentally using the photoacoustic imaging apparatus shown in Fig. 7. The fabrication process of MRR detector can be found in our previous work.28 The dimensions of MRR detector are also consistent with the theoretical analysis. The MRR detector is placed on the microscope stage and a carbon black (CB) film attached to an adjustable holder is used as the light-absorbing target. The CB film is made of 3 vol. % CB particles (50 nm nominal radius) in photoresist (SU8–2, MicroChem) and spin-coated on a glass substrate with the thickness of 1.5 μm after soft bake. A 532 nm pulse laser (Elforlight Ltd.) is focused through the transparent MRR detector by an inverted 20× objective lens (NA 0.45, Olympus) onto the CB film to generate impulsive ultrasonic waves. Linear scanning of the focal spot crossing the z-axis is accomplished by using Galvo mirrors (Nutfield Technology) and the matching telescope system. A narrow band tunable laser (765–780 nm, TLB-6712, New Focus) is coupled to the MRR detector using a single mode optical fiber. The transmitted signal through the MRR detector is coupled to an avalanche photodetector (APD, bandwidth: 5 MHz–1 GHz, APD210, Menlo System) using a multimode fiber. The electric signal is subsequently amplified (ZFL500NL+, Mini-circuits; bandwidth: 10 MHz–500 MHz) with 28 dB gain and digitized by a data acquisition card (CobraMax high speed PCI digitizer, GaGe).
FIG. 7.
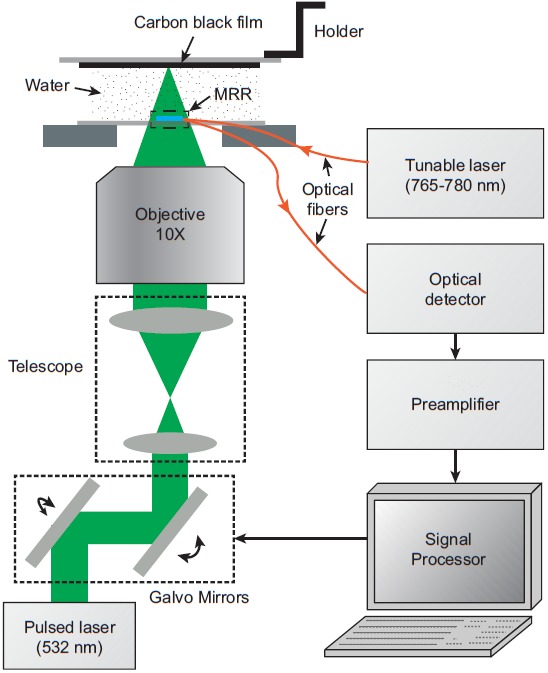
Experimental setup using MRR detector incorporated into an inverted microscopic system.
We first study the case when the photoacoustic point source is located along the z-axis while progressively changing the working distance of the MRR detector. This study resembles the theoretical analysis being shown in Fig. 4(c). The ultrasonic source is generated by focusing the short pulse laser on the CB film, which is located at four representative distances (z = 45, 150, 300, 450 μm) above the MRR detector. The collected time domain signals are shown in Fig. 8(a) and their corresponding power spectra are shown in Fig. 8(b). In Fig. 8(b), as expected, the strongest acoustic signal is obtained when the MRR detector is within the near-field region (z = 45 μm). While moving the MRR detector into the far-field region (z = 150, 300, 450 μm), not only do measured acoustic signals become weaker, but the peak frequencies (indicated by arrows) also exhibit visible shifts towards lower frequencies. This finding suggests stronger attenuation of high frequency components becomes dominating effect at longer working distance. Fig. 8(c) shows the normalized intensity spectra of far-field regions (z = 150, 300, 450 μm) with respect to the near-field (z = 45 μm). It illustrates strong frequency dependent attenuation found in the far-field region, which is consistent with the theoretical analysis shown in Fig. 4(c).
FIG. 8.

(a) Time domain signals when acoustic source is located along z-axis at different z position (z = 45, 150, 300, 450 μm) and (b) their corresponding power spectra. (c) Normalized far-field intensity spectra (z = 150, 300, 450 μm) with respect to the spectrum in the near-field (z = 45 μm).
Fig. 9 shows the response patterns measured in both the far-field region (z = 450 μm, Figs. 9(a) and 9(c)) and the near-field region (z = 45 μm, Figs. 9(b) and 9(d)). The measurements also capture the multiple reflections of acoustic waves from the CB film and MRR as the time-lagged wavefronts are found in Figs. 9(a) and 9(b). Notably, far-field signals show a flat wavefront, while near-field signals undergo a large distortion, which are in good agreements with the theoretical analysis shown in Figs. 6(a) and 6(b). The measured frequency domain responses shown in Figs. 9(c) and 9(d) closely resemble the characteristic of the central band being predicted in the theoretical analysis (Figs. 6(c) and 6(d)). The side bands become less distinguishable against the noise background. Upon the successful experimental validation, the theoretical model reported here offers a methodology to quantitatively evaluate the key imaging characteristics of PAM using MRR detector. As an example, the trade-off between near-field and far-field detection can be fully assessed in obtaining the optimal imaging performance. For applications like tissue imaging that requires a larger FOV but less constrains on resolution, far-field detection would be advantageous; for applications like single cell imaging that requires high lateral and axial resolutions to acquire 3D information, near-field detection would be preferred. In applications when both large FOV and high axial resolution are demanded, sample scan has to be implemented to assist the near-field detection. The processing modeling tool developed here can be utilized to further optimize the PAM process. As an example, the distortion observed in the near-field measurements can possibly be removed numerically using the theoretical model discussed here.
FIG. 9.

(a) and (b) are the measured time domain signals in the far-field region (z = 450 μm) and near-field region (z = 45 μm), respectively; (c) and (d) are their corresponding frequency response.
IV. CONCLUSION
We have systematically calculated the distance dependent detection characteristics of MRR detectors to acoustic monopole sources in both the steady and transient states. Our simulation results are experimentally validated. In conclusion, far-field detection with MRR gives much broader FOV and longer working distance, while the near-field detection holds great potential in improving detected signal intensities. Moreover, near-field detection helps to enhance the axial resolution in acoustic imaging. These results can be used to guide the selection of working distance for MRR detectors in various biomedical and clinical applications. Notably, the distorted wavefront of time domain signal using impulsive waves in the near-field poses some difficulties in image reconstruction and requires further study. Furthermore, it is worthwhile to note that the method reported here can be applied to more general illumination schemes, which can be represented as the coherent super-position of point sources.
ACKNOWLEDGMENTS
We are grateful for the generous financial support from the National Science Foundation Grants. DBI-1353952 to C.S. and H.F.Z., CBET-1055379 and CBET-1066776 to H.F.Z., and CMMI-0955195 and CMMI-0751621 to C.S., and the National Institutes of Health Grants 1R01EY019951 and 1R24EY022883 to H.F.Z.
References
- 1.Shotton D. M., J. Cell Sci. 94, 175 (1989), available at http://jcs.biologists.org/content/94/2/175.short#cited-by [Google Scholar]
- 2.Gustafsson M. G. L., Proc. Natl. Acad. Sci. U.S.A. 102, 13081 (2005). 10.1073/pnas.0406877102 [DOI] [PMC free article] [PubMed] [Google Scholar]
- 3.Hell S. W. and Wichmann J., Opt. Lett. 19, 780 (1994). 10.1364/OL.19.000780 [DOI] [PubMed] [Google Scholar]
- 4.Wang L. H. V. and Hu S., Science 335, 1458 (2012). 10.1126/science.1216210 [DOI] [PMC free article] [PubMed] [Google Scholar]
- 5.Zhang H. F., Maslov K., Stoica G., and Wang L. H. V., Nat. Biotechnol. 24, 848 (2006). 10.1038/nbt1220 [DOI] [PubMed] [Google Scholar]
- 6.Yao D. K., Maslov K., Shung K. K., Zhou Q. F., and Wang L. V., Opt. Lett. 35, 4139 (2010). 10.1364/OL.35.004139 [DOI] [PMC free article] [PubMed] [Google Scholar]
- 7.Wang L. V., Nat. Photonics. 3, 503 (2009). 10.1038/nphoton.2009.157 [DOI] [PMC free article] [PubMed] [Google Scholar]
- 8.Maslov K., Stoica G., and Wang L. H. V., Opt. Lett. 30, 625 (2005). 10.1364/OL.30.000625 [DOI] [PubMed] [Google Scholar]
- 9.Maslov K., Zhang H. F., Hu S., and Wang L. V., Opt. Lett. 33, 929 (2008). 10.1364/OL.33.000929 [DOI] [PubMed] [Google Scholar]
- 10.Wang Y., Hu S., Maslov K., Zhang Y., Xia Y. N., and Wang L. V., Opt. Lett. 36, 1029 (2011). 10.1364/OL.36.001029 [DOI] [PMC free article] [PubMed] [Google Scholar]
- 11.Hu S., Maslov K., Tsytsarev V., and Wang L. V., J. Biomed. Opt. 14, 040503 (2009). 10.1117/1.3194136 [DOI] [PMC free article] [PubMed] [Google Scholar]
- 12.Wang H. W., Chai N., Wang P., Hu S., Dou W., Umulis D., Wang L. H. V., Sturek M., Lucht R., and Cheng J. X., Phys. Rev. Lett. 106, 238106 (2011). 10.1103/PhysRevLett.106.238106 [DOI] [PMC free article] [PubMed] [Google Scholar]
- 13.Zhang C., Maslov K., and Wang L. V., Opt. Lett. 35, 3195 (2010). 10.1364/OL.35.003195 [DOI] [PMC free article] [PubMed] [Google Scholar]
- 14.Zhang C., Maslov K., Hu S., Chen R., Zhou Q., Shung K. K., and Wang L. V., J. Biomed. Opt. 17, 020501 (2012). 10.1117/1.JBO.17.2.020501 [DOI] [PMC free article] [PubMed] [Google Scholar]
- 15.Wang L. V. and Gao L., Annu. Rev. Biomed. Eng. 16, 155 (2014). 10.1146/annurev-bioeng-071813-104553 [DOI] [PMC free article] [PubMed] [Google Scholar]
- 16.Beard P. C., Perennes F., and Mills T. N., IEEE Trans. Ultrason. Ferroelectr. Freq. Control 46, 1575 (1999). 10.1109/58.808883 [DOI] [PubMed] [Google Scholar]
- 17.Rousseau G., Gauthier B., Blouin A., and Monchalin J. P., J. Biomed. Opt. 17, 061217 (2012). 10.1117/1.JBO.17.6.061217 [DOI] [PubMed] [Google Scholar]
- 18.Nuster R., Paltauf G., and Burgholzer P., Opt. Express 15, 6087 (2007). 10.1364/OE.15.006087 [DOI] [PubMed] [Google Scholar]
- 19.Chow C. M., Zhou Y., Guo Y. B., Norris T. B., Wang X. D., Deng C. X., and Ye J. Y., J. Biomed. Opt. 16, 017001 (2011). 10.1117/1.3528014 [DOI] [PMC free article] [PubMed] [Google Scholar]
- 20.Yakovlev V. V., Dickson W., Murphy A., McPhillips J., Pollard R. J., Podolskiy V. A., and Zayats A. V., Adv. Mater. 25, 2351 (2013). 10.1002/adma.201300314 [DOI] [PubMed] [Google Scholar]
- 21.Wild G. and Hinckley S., IEEE Sens. J. 8, 1184 (2008). 10.1109/JSEN.2008.926894 [DOI] [Google Scholar]
- 22.Song Y. J. and Peters K. J., Appl. Opt. 51, 6886 (2012). 10.1364/AO.51.006886 [DOI] [PubMed] [Google Scholar]
- 23.Chao C. Y., Ashkenazi S., Huang S. W., O'Donnell M., and Guo L. J., IEEE Trans. Ultrason. Ferroelectr. Freq. Control 54, 957 (2007). 10.1109/TUFFC.2007.341 [DOI] [PubMed] [Google Scholar]
- 24.Garrett C. G., Kaiser W., and Bond W. L., Phys. Rev. 124, 1807 (1961). 10.1103/PhysRev.124.1807 [DOI] [Google Scholar]
- 25.Grudinin I. S., Ilchenko V. S., and Maleki L., Phys. Rev. A 74, 063806 (2006). 10.1103/PhysRevA.74.063806 [DOI] [Google Scholar]
- 26.Zhang H. F., Maslov K., and Wang L. H. V., Nat. Protoc. 2, 797 (2007). 10.1038/nprot.2007.108 [DOI] [PubMed] [Google Scholar]
- 27.Xie Z. X., Jiao S. L., Zhang H. F., and Puliafito C. A., Opt. Lett. 34, 1771 (2009). 10.1364/OL.34.001771 [DOI] [PubMed] [Google Scholar]
- 28.Li H., Dong B., Zhang Z., Zhang H. F., and Sun C., Sci. Rep. 4, 4496 (2014). 10.1038/srep04496 [DOI] [PMC free article] [PubMed] [Google Scholar]
- 29.Xu M. and Wang L. V., Rev. Sci. Instrum. 77, 041101 (2006). 10.1063/1.2195024 [DOI] [Google Scholar]
- 30.Blackstock D. T., Fundamentals of Physical Acoustics ( Wiley-Interscience, New York, 2000). [Google Scholar]
- 31.Russell D. A., Titlow J. P., and Bemmen Y. J., Am. J. Phys. 67, 660 (1999). 10.1119/1.19349 [DOI] [Google Scholar]
- 32.Delgross V. A. and Mader C. W., J. Acoust. Soc. Am. 52, 1442 (1972). 10.1121/1.1913258 [DOI] [Google Scholar]
- 33.Kino G. S., Acoustic Waves, Devices, Imaging & Analog Signal Processing ( Prentice Hall, Englewood Cliffs, NJ, 1987). [Google Scholar]
- 34.Strohm E. M. and Kolios M. C., in 2011 IEEE International Ultrasonics Symposium (2011), p. 2368 [Google Scholar]


