

Abstract
Diabetes is associated with activation of the polyol pathway, in which glucose is converted to sorbitol by aldose reductase. Previous studies focused on the role of sorbitol in mediating diabetic complications. However, in the proximal tubule, sorbitol can be converted to fructose, which is then metabolized largely by fructokinase, also known as ketohexokinase, leading to ATP depletion, proinflammatory cytokine expression, and oxidative stress. We and others recently identified a potential deleterious role of dietary fructose in the generation of tubulointerstitial injury and the acceleration of CKD. In this study, we investigated the potential role of endogenous fructose production, as opposed to dietary fructose, and its metabolism through fructokinase in the development of diabetic nephropathy. Wild-type mice with streptozotocin-induced diabetes developed proteinuria, reduced GFR, and renal glomerular and proximal tubular injury. Increased renal expression of aldose reductase; elevated levels of renal sorbitol, fructose, and uric acid; and low levels of ATP confirmed activation of the fructokinase pathway. Furthermore, renal expression of inflammatory cytokines with macrophage infiltration was prominent. In contrast, diabetic fructokinase–deficient mice demonstrated significantly less proteinuria, renal dysfunction, renal injury, and inflammation. These studies identify fructokinase as a novel mediator of diabetic nephropathy and document a novel role for endogenous fructose production, or fructoneogenesis, in driving renal disease.
Diabetic nephropathy is the most common kidney disease causing ESRD worldwide and also one of the most difficult diseases to treat. To date, treatment includes tight blood glucose and BP control and inhibition of the renin-angiotensin-aldosterone system. These efforts typically slow but do not arrest the progression of kidney disease.1 It is therefore imperative to better understand the mechanisms responsible for renal injury and to develop additional therapies.
Recently, fructose has emerged as a potential nephrotoxin. Fructose-fed rats develop modest tubulointerstitial injury,2 and fructose supplementation accelerates renal disease in the remnant kidney model.3 While all studies to date have focused on dietary fructose as the source of fructose, fructose can also be generated from glucose in diabetes because of the activation of the polyol pathway in the proximal tubule. To date, no studies have examined the role of this endogenous fructose production or fructoneogenesis in driving diabetic nephropathy. Therefore, we tested the hypothesis that mice lacking fructokinase-ketohexokinase (khk−/−) show protection from diabetic nephropathy, even in the absence of dietary fructose, as a result of their inability to metabolize endogenously produced fructose.
Results
khk−/− Mice Have Improved Body Weight and Renal Function Compared with Wild-Type Mice Despite Similar Levels of Blood Glucose
As shown in Table 1, the injections of streptozotocin in both khk−/− and wild-type mice resulted in similar levels of hyperglycemia and blood hemoglobin A1c. Both groups demonstrated increased kidney size and significant loss of body weight compared with nondiabetic animals. In addition, serum levels of creatinine and BUN were increased, indicating reduced renal function. When diabetic groups were compared with each other, diabetic khk−/− mice demonstrated improved kidney/body weight ratio, body weight, serum creatinine levels, BUN levels, and creatinine clearance compared with diabetic wild-type mice. Of interest, we observed that several nonrenal measures, including serum triglycerides, cholesterol, and uric acid tended to be lower in diabetic khk−/− mice than in diabetic wild-type mice (Table 1).
Table 1.
Overall parameters in nondiabetic and diabetic (10 weeks) wild-type and khk−/− mice
| Variable | Nondiabetic WT Mice | Nondiabetic khk−/− Mice | Diabetic WT Mice | Diabetic khk−/− Mice |
|---|---|---|---|---|
| Body weight (g) | 35.02±1.11 | 32.36±0.85a | 20.54±2.59b | 26.38±0.48c,d |
| Blood glucose (mg/dl) | 114±24 | 109±20 | 375±76b | 359±90b |
| Hemoglobin A1c (%) | 5.3±1.2 | 4.9±1.6a | 9.2±0.6b | 8.9±0.6b |
| Kidney weight/body weight ratio | 0.009±0.006 | 0.008±0.001 | 0.028±0.002b | 0.016±0.002e |
| BUN (mg/dl) | 24.3±5.6 | 22.3±3.3 | 64.6±7.8b | 34.3±6.3c,d,e |
| Serum creatinine (mg/dl) | 0.24±0.09 | 0.22±0.03 | 0.54±0.07b | 0.42±0.06b,e |
| Creatinine clearance (ml/min) | 0.87±0.16 | 0.96±0.13 | 0.33±0.16b | 0.78±0.12c |
| Triglycerides (mg/dl) | 133±16 | 100±19 | 245±31b | 160±26d,e |
| Cholesterol (mg/dl) | 114±9.4 | 110±14.1 | 151±16.5e | 114±10.2 |
| Uric acid (mg/dl) | 2.54±0.2 | 2.58±0.2 | 3.33±0.3b | 2.86±0.1d |
Values are expressed as mean±SD. WT, wild-type.
P<0.05 versus nondiabetic WT mice.
P<0.01 versus respective nondiabetic controls.
P<0.01 versus diabetic WT mice.
P<0.05 versus respective nondiabetic controls.
P<0.05 versus diabetic WT mice.
Improved Renal Function Is Associated with Better Tubular Histology and Less Injury in Diabetic khk−/− Mice
Because KHK expression in the kidney is limited to the proximal tubule,4,5 we first analyzed the tubulointerstitium in diabetic wild-type and khk−/− mice. Tubular dilatation, a marker of osmotic polyuria and tubular injury in diabetic nephropathy,6,7 was evaluated using periodic acid-Schiff (PAS)–stained kidneys. Unlike nondiabetic mice (Figure 1, A, C, and E), diabetic wild-type mice had significantly enlarged tubular luminal areas (Figure 1, B and, E), which were significantly reduced in diabetic khk−/− mice (Figure 1, D and E). In addition, collagen III deposition, a marker of interstitial collagen, was significantly increased in diabetic wild-type mice compared with diabetic khk−/− and nondiabetic mice (Figure 1, F–J). The increase in collagen III deposition was associated with significantly higher levels of TGF-β mRNA in the kidney cortex of diabetic wild-type mice (Figure 1K).
Figure 1.

Reduced tubular injury in diabetic khk−/− mice compared to wild-type siblings. (A–D) Representative kidney sections stained with PAS in nondiabetic and diabetic wild-type mice and khk−/− mice. Tubular area is shown. No significant tubular dilatation was observed in nondiabetic wild-type (A), khk−/− (C), or diabetic khk−/− (D) mice compared with diabetic wild-type mice (B). Original magnification, ×20 in A–D. (E) Quantification of lumen area in all groups. (F–I) Representative kidney sections stained for collagen III in nondiabetic and diabetic wild-type and khk−/− (H and I) mice. Tubular area is shown. (J) Quantification of collagen III–positive area in all groups. (K) Quantification of TGF-β mRNA levels in kidney cortex of all groups. (n=6). D, diabetic wild-type; ND, nondiabetic wild-type. Mean±SEM. *P<0.05 and **P<0.01 versus respective nondiabetic control; #P<0.05; ##P<0.01.
To determine whether the tubular dilatation in diabetic wild-type mice was associated with a significant loss of brush border area, a marker of tubular injury, we examined the expression of the angiotensin-converting enzyme (ACE) in the brush border. Diabetic wild-type mice possessed significantly reduced levels of ACE compared with diabetic khk−/− and nondiabetic mice by both immunohistochemistry (Figure 2, A–C) and Western blot from renal cortex homogenates (Figure 2D). Consistent with greater brush border levels, urinary levels of neutrophil gelatinase-associated lipocalin (NGAL) and N-acetyl-β-d-glucosaminidase (NAG), biomarkers of tubular injury, were significantly lower in diabetic khk−/− mice than in wild-type mice (Figure 2, E and F). The reduced tubular injury observed in diabetic khk−/− mice was paralleled by improved tubular function, as determined by a significantly lower fractional excretion of phosphate (Figure 2G).
Figure 2.
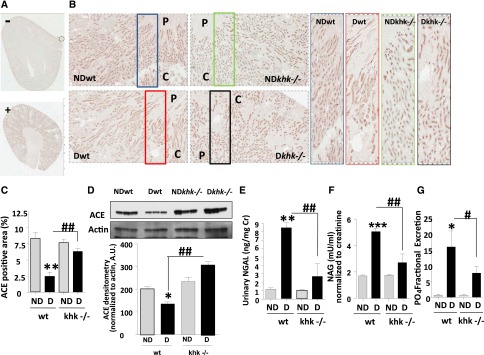
Improved tubular function in diabetic khk−/− mice compared to wild-type siblings. (A and B) Representative kidney sections stained for ACE in nondiabetic and diabetic wild-type mice and khk−/− mice. Tubular area is shown. C, cortex; P, papilla. (A) Negatively and positively staining controls. Original magnification, ×2 in A; ×20 in B. (C) Quantification of ACE-positive area in all groups. (D) Representative Western blot for ACE from kidney cortex homogenates showing significantly lower ACE levels in diabetic wild-type mice compared with nondiabetic mice and diabetic khk−/− mice. (E) Quantification of urinary NGAL—corrected for creatinine levels—in all groups. (F) Quantification of urinary NAG—corrected for creatinine levels—in all groups. (G) Quantification of fractional excretion of phosphate in all groups. (n=6). D, diabetic wild-type; ND, nondiabetic wild-type. Mean±SEM. *P<0.05, **P<0.01, ***P<0.001 versus respective nondiabetic control; #P<0.05, ##P<0.01, and ###P<0.001.
Improved Renal Function Is Associated with Better Glomerular Histology and Function in Diabetic khk−/− Mice
Although KHK is not expressed in glomeruli, there was some evidence of glomerular protection in diabetic KHK knockout mice. We did not observe significant glomerular hypertrophy in any group (Figure 3, A–E), but diabetic khk−/− mice tended to have reduced glomerular size and significantly less glomerular expansion compared with diabetic wild-type mice (Figure 3F). Indeed, mesangial collagen IV deposition was significantly increased in diabetic wild-type but not khk−/− mice (Figure 3, G–K). We also observed a significant reduction in urinary albumin excretion (corrected for urinary creatinine) compared with diabetic wild-type mice, which could indicate reduced glomerular permeability to protein or improved proximal tubular function with better tubular protein reabsorption (Figure 3L).
Figure 3.
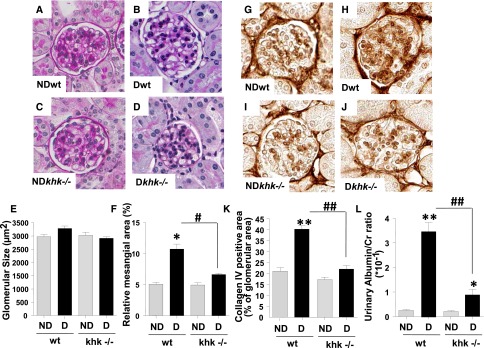
Improved glomerular function and injury in diabetic khk−/− mice compared to wild-type siblings. (A–D) Representative kidney sections stained with PAS in nondiabetic and diabetic wild-type mice and khk−/− mice. Glomerular area is shown. No significant glomerular hypertrophy was observed in any group. Original magnification, ×40 in A–D and G–J. (E) Quantification of glomerular area in all groups. (F) Quantification of mesangial area expansion in all groups. (G–J) Representative kidney sections stained for collagen IV in nondiabetic and diabetic wild-type and khk−/− mice. (K) Quantification of collagen IV–positive area in all groups. (L) Quantification of urinary albumin in all groups. (n=6). D, diabetic wild-type; ND, nondiabetic wild-type. Mean±SEM. *P<0.05 and **P<0.01 versus respective nondiabetic control; #P<0.05 and ##P<0.01.
Polyol Pathway Is Activated in Kidney Cortex of Diabetic Mice, Where It Produces Endogenous Fructose to Be Metabolized by KHK
Because these mice did not receive fructose in the diet, we evaluated whether endogenous fructose was being produced via the polyol pathway. Fructose can be produced “endogenously” from glucose by the polyol pathway, a molecular route activated in diabetes in multiple tissues.8,9 To determine whether diabetes activates the polyol pathway in the kidney cortex, we analyzed the expression of aldose reductase (AR), the initial rate-limiting enzyme in this pathway. In the normal kidney, AR is primarily expressed in the inner medulla and papilla, with little or no expression in the outer medulla and cortex (Figure 4A). In contrast, under diabetic conditions, wild-type mice and diabetic khk−/− mice expressed significantly higher levels of AR, as demonstrated by immunohistochemistry (Figure 4, B and C, top panels) and Western blot (Figure 4D). Although diabetic khk−/− tended to show reduced AR expression in the kidney cortex compared with diabetic wild-type mice, this did not reach statistical significance. Furthermore, cortical AR activity and mRNA levels did not differ between both diabetic groups (Figure 4, E and F).The expression of KHK was also upregulated in diabetic mice compared with nondiabetic mice (Figure 4, G–I), consistent with higher overall KHK activity (Figure 4K). Analysis of mRNA expression from kidney cortex of diabetic wild-type mice demonstrated that both isoforms of KHK (KHK-A and KHK-C) were upregulated in the kidney cortex (Figure 4J). Consistent with the increased expression of AR, levels of sorbitol and fructose were equally upregulated in kidney cortex extracts. This finding indicates activation of the polyol pathway in diabetic animals (Figure 4, L and M), although cortical sorbitol levels in diabetic khk−/− mice were significantly lower than those found in the cortex of diabetic wild-type mice. Even though we did not observe significantly higher cortical fructose levels in diabetic khk−/− mice compared with diabetic wild-type mice, we found a significant increase in urinary fructose in diabetic khk−/− compared with the rest of the groups, indicating that excessive endogenous fructose is secreted into the urine (Figure 4N).
Figure 4.
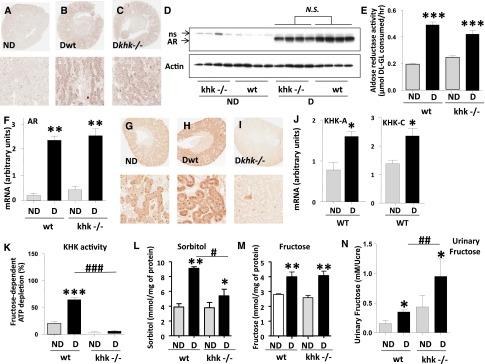
Aldose reductase and the polyol pathway are activated in the kidney cortex of diabetic mice. (A–C) Representative kidney sections stained for AR in nondiabetic and diabetic wild-type mice and khk−/− mice. Whole kidney (top) and tubular area (bottom) is shown. Original magnification, ×2 in A–C and G, top images; ×20 A–C and G, bottom images. (D) Representative Western blot for AR from kidney cortex homogenates demonstrating significantly increased expression in diabetic mice compared with nondiabetic animals. NS, nonspecific band. (E) Quantification of AR activity in kidney cortex homogenates in all groups. (F) Quantification of kidney cortex AR mRNA expression in all groups. (G–I) Representative kidney sections stained for KHK in nondiabetic and diabetic wild-type mice and khk−/− mice. Whole kidney (top) and tubular area (bottom) are shown. (J) Quantification of isoforms A and C of KHK in kidney cortex of all groups. (K) Quantification of kidney cortex KHK activity in all groups. (L) Quantification of renal cortical sorbitol levels in all groups. (M) Quantification of renal cortical fructose in all groups. (N) Quantification of urinary fructose levels—normalized to urinary creatinine—in all groups. (n=6). D, diabetic wild-type; ND, nondiabetic wild-type. Mean±SEM. *P<0.05, **P<0.01, and ***P<0.001 versus respective nondiabetic control; #P<0.05, ##P<0.01, and ###P<0.001.
Polyol Pathway Contributes to Increased Production of Proinflammatory Cytokines and Chemokines by Proximal Tubule Cells Exposed to High Glucose
We have previously shown that fructose-dependent ATP depletion and uric acid generation is an important step in fructose-induced oxidative stress and inflammation in tubular cells.10 Consistent with this observation, uric acid levels in the renal cortex were increased only in diabetic wild-type mice (Figure 5A), in parallel with a significant reduction in overall ATP levels (Figure 5B). Furthermore, we used dihydroethidium to analyze renal cortical levels of superoxide and found significantly higher levels in diabetic wild-type mice compared with other groups (Figure 5, C and D).
Figure 5.
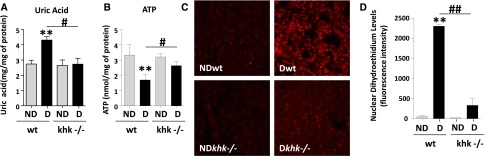
Reduced renal uric acid and oxidative stress in diabetic khk−/− mice compared to wild-type siblings. (A) Quantification of renal cortex uric acid levels in all groups. (B) Quantification of renal cortex ATP levels in all groups. (C) Representative images of DHE staining demonstrating increased nuclear staining in diabetic wild-type mice compared with the rest of the groups. Original magnification, ×20. (D) Fluorescence intensity quantification of DHE in all groups. D, diabetic wild-type; ND, nondiabetic wild-type. Mean±SEM. **P<0.01 versus respective nondiabetic control; #P<0.05 and ##P<0.01.
Because we have previously reported that the metabolism of fructose by cultured proximal tubular cells results in a KHK-dependent induction of monocyte chemoattractant protein-1 (MCP-1, also known as CCL2 in mice) and oxidative stress,10 we assessed whether inflammatory cytokines and chemokines were expressed and regulated in our culture model and whether expression would be altered in the khk−/− mice. To better assess the role of high glucose in inflammation in proximal tubular cells, we exposed human immortalized proximal tubular cells (HK-2) to high glucose. As shown in Supplemental Figure 1, exposure of cells to high glucose resulted in polyol activation as denoted by significantly higher levels of sorbitol and fructose. Of interest, when KHK expression is stably silenced using lentiviral particles (Figure 6A) we found that exposure of control cells transducted with lentiviral particles containing scramble (scr) RNA–deficient but not khk-deficient cells to increasing levels of glucose resulted in a dose-dependent activation of the transcription factor NF-κB as determined with an specific NF-κB luciferase reporter cassette (Figure 6B). Of interest, the activation of NF-κB observed in control cells by high glucose (25 mM) was significantly blunted when uric acid generation was blocked with allopurinol (100 µM, Figure 6C). Furthermore, silencing KHK expression in HK-2 cells also resulted in significantly reduced expression of cytokines (IL-1β and IL-6), chemokines (MCP-1), and profibrotic genes (TGFβ and FN1) in response to glucose (Figure 6D), as well as reduced nuclear translocation of the NF-κB subunit p65 (Figure 6E). In addition, the mechanism whereby high glucose induces inflammation appears to be mediated by the polyol pathway activation because exposure of cells to high glucose levels resulted in a significant increase of AR expression (Figure 7A). Of interest, cytokine and chemokine production (IL-1β, IL-6, and MCP-1) was blocked when cells were preincubated with an AR inhibitor (sorbinil, 10 µM), indicating that the polyol pathway contributes to high glucose–induced inflammation in proximal tubular cells (Figure 7A). To determine whether the effect observed by blockade of the polyol pathway in vitro was due to endogenous fructose generation, we determined the expression of the same proinflammatory cytokines and chemokines in the kidney cortex of diabetic mice and found that IL-1β, IL-6, and CCL2 (MCP-1 homolog in mice) mRNA levels were significantly increased in the renal cortex of diabetic wild-type mice compared with diabetic khk−/− mice and nondiabetic controls (Figure 7B). Consistent with lower expression of the macrophage chemoattractant CCL2, we found that diabetic khk−/− mice possessed few cortical macrophages compared with wild-type mice, as demonstrated by reduced CD68 and F4/80 mRNA levels (Figure 7C). Furthermore, when the inducible nitric oxide/Arg1 mRNA ratio was analyzed in the kidney cortex, wild-type mice had a greater ratio, indicating the presence of a greater M1 macrophage population (Figure 7D). Together, these data suggest that tubular KHK drives inflammatory cytokine and chemokine expression as a consequence of metabolism of fructose generated from the polyol pathway.
Figure 6.

Fructose metabolism blockade is associated with reduced inflammation in proximal tubular cells exposed to high glucose levels. (A) Representative Western blot of HK-2 cells control (Scr [scramble]) and stably silenced for KHK expression (Δkhk). (B) Luciferase units—normalized to β-gal expression—in scr and Δkhk cells transfected with an NF-κB-luciferase reporter cassette and exposed to increasing levels of glucose. (C) Luciferase units—normalized to β-gal expression—in regular HK-2 cells transfected with an NF-κB-luciferase reporter cassette and exposed to high glucose (HG; 25 mM) in the presence or absence of allopurinol (100 µM). (D) Quantification of mRNA levels of cytokines (IL-1β and IL-6), chemokines (MCP-1), and fibrotic genes (TGFβ and FN1) in scr and Δkhk HK-2 cells exposed to high glucose levels (25 mM). (E) Representative Western blot of p65 from nuclear extracts from scr and Δkhk cells under control (ctrl) or high glucose conditions. Mean±SEM. *P<0.05 and **P<0.01 versus respective control; #P<0.05 and ##P<0.01.
Figure 7.

Reduced inflammatory markers in the proximal tubule after blockade of aldose reducatse and fructokinase. (A) mRNA expression of AR, cytokines (IL-1β and IL-6), and the chemokine MCP-1 in HK-2 cells control (ctrl), and exposed to 25 mM high glucose (HG) alone or in the presence of the AR inhibitor sorbinil (HGS; 10 µM). *P<0.05 and **P<0.01 versus control; ##P<0.01. (B) Quantification of mRNA levels of IL-1β, IL-6, and CCL2 in kidney cortex of diabetic wild-type and khk−/− mice. (C) Quantification of mRNA levels of the macrophage markers CD68 and F4/80 in kidney cortex of diabetic wild-type and khk−/− mice. (D) Quantification of mRNA ratio between inducible nitric oxide synthase (iNOS) and Arg1 in kidney cortex of diabetic wild-type and khk−/− mice. (n=6). D, diabetic wild-type; ND, nondiabetic wild-type. Mean±SEM. *P<0.05 versus diabetic khk−/−.
Reduced Macrophage Infiltration in Diabetic Khk−/− Mice Compared with Diabetic Wild-Type Mice
Diabetic nephropathy is associated with low-grade inflammation characterized by the presence of macrophages in both glomeruli and the interstitium.11 Inhibition of the infiltrating macrophages is associated with amelioration of diabetic nephropathy in various models.12–14 Because the increased renal expression of CCL2 was prevented in diabetic khk−/− mice, we hypothesized that the absence of KHK might lead to less infiltration of macrophages in the renal cortex. Staining for the macrophage marker, CD68, documented fewer macrophages in the tubulointerstitium compared with diabetic wild-type mice (Figure 8, A–D). In particular, 62% of CD68-positive cells were found surrounding the tubules in which the expression of brush border (detected by phalloidin staining) was lost. We also observed fewer macrophages in glomeruli of diabetic khk−/− mice compared with diabetic wild-type controls (12±3 versus 4±2, respectively) (Figure 8, E–G).
Figure 8.

Fructokinase deficiency results in reduced macrophage infiltration in the diabetic kidney. (A) Representative kidney sections stained for CD68 in diabetic wild-type mice. Tubular area is shown. CD68 is represented in red pseudocolor and phalloidin (polymerized actin) is represented in green pseudocolor. Nuclei are counterstained with DAPI (blue). (B) Amplification from part A to better denote macrophage presence underlying the basal membrane of injured tubules (no apical membrane staining with phalloidin). (C) Representative kidney sections stained for CD68 in diabetic khk−/− mice. Tubular area is shown. (D) Quantification of CD68 positive cells per area in the tubular region in all groups. Original magnification, ×63 in A and C; ×40 in E and F. (E) Representative kidney sections stained for CD68 in diabetic wild-type mice. Glomerular area is shown. (F) Representative kidney sections stained for CD68 in diabetic khk−/− mice. Glomerular area is shown. (G) Quantification of CD68 positive cells per area in the glomerular region in all groups. (n=6). D, diabetic wild-type; ND, nondiabetic wild-type. Mean±SEM. *P<0.05 and **P<0.01 versus respective nondiabetic control; ##P<0.01.
Discussion
Previous studies have shown that dietary fructose can induce tubulointerstitial injury2 and accelerate CKD.3 However, the amounts of exogenous fructose needed to induce renal injury and dysfunction are too high to be clinically relevant. Here, we demonstrate that the production of endogenous fructose or fructoneogenesis in the proximal tubule of diabetic mice is important and sufficient to induce renal injury characterized by tubulointerstitial inflammation, injury, and dysfunction. Diabetes was induced with the standard National Institutes of Health protocol of streptozotocin,15 and following the treatment, both wild-type and khk−/− mice had similar levels of hyperglycemia and hemoglobin A1c. Diabetic wild-type mice developed modest renal injury, with reduced renal function, proteinuria, mesangial expansion, and low-grade tubular injury. Despite the similar degree of diabetes, the diabetic khk−/− knockout mice were largely protected from renal disease and had significantly better renal function, lower albuminuria, and less histologic tubular injury and urinary NGAL excretion. Renal protection was associated with less expression of inflammatory cytokines and with a reduced local inflammatory response. While the greatest protection was in the tubulointerstitium, mesangial collagen expansion and glomerular macrophage accumulation also decreased. Hence, these studies have identified fructokinase as a novel mediator of diabetic renal disease.
The observation that fructokinase knockout mice were protected from diabetic nephropathy (Figure 9) strongly suggests that the renal injury was mediated by the endogenous production of fructose by the polyol pathway because no fructose was present in the diet. The polyol pathway uses AR and sorbitol dehydrogenase to generate fructose from glucose. The polyol pathway is known to be induced in diabetes as a consequence of hyperglycemia, and we found evidence for activation of this pathway in the kidneys of both wild-type and KHK knockout diabetic mice, as noted by increased AR mRNA and protein, and increased AR activity, as noted by increased renal sorbitol and fructose concentrations. Thus, the diabetic state resulted in activation of the polyol pathway and endogenous production of fructose that was particularly prominent in the renal cortex.
Figure 9.

Schematic of proposed mechanism whereby khk−/− mice show protection against diabetic nephropathy. Increased serum glucose causes direct glomerular and tubular injury. In the proximal tubule, glucose induces the transcription of AR, thus enhancing the production of endogenous sorbitol and fructose. Metabolism of endogenous fructose by KHK induces ATP depletion, uric acid generation, and oxidative stress in the proximal tubule, which further leads to the activation of the transcription factor NF-κB, cortical inflammation, and macrophage recruitment to the kidney cortex (M1 polarized) via generation of cytokines and chemokines. Activated macrophages exert toxicity in both glomerular and tubular areas. SDH, sorbitol dehydrogenase.
Fructokinase is the principal enzyme for metabolizing fructose and generates fructose-1-phosphate. Unlike other sugar-metabolizing enzymes, the metabolism of fructose results in ATP depletion due to phosphate sequestration as fructose-1-phosphate,4 with further generation of uric acid, oxidants, and inflammatory proteins. The two major sites of fructokinase expression are in the liver and the proximal tubule. Activation of liver fructokinase mediates fatty liver through a process driven by oxidative stress and uric acid generation.16 While most of the effects of the hepatic metabolism of fructose are expected to act within the liver, hepatic fructose metabolism can raise serum uric acid levels and serum lipids, which could be responsible for some of the effects in the kidney. The decrease in serum lipids observed in the KHK knockout mice is unlikely to be responsible for the renal protection (Table 1). However, it is possible that increases in serum uric acid induced by hepatic fructose metabolism could have some effects on renal disease. Raising uric acid in rats can induce systemic and glomerular hypertension and induce microvascular, glomerular, and tubulointerstitial disease.17,18 Lowering uric acid with allopurinol in diabetic mice has also been associated with a reduction in renal injury that is clinically similar to what we observed in this study.19
Studies by Cirillo et al. showed that fructose can induce proximal tubular injury in vitro through its metabolism by fructokinase to generate oxidants and uric acid.10 In this study we documented the importance of proximal tubular fructokinase in vivo, as shown by the presence of increased cortical fructose, increased KHK expression, decreased ATP levels, and increased cortical uric acid. Mice lacking fructokinase showed less cortical uric acid accumulation, suggesting that the cortical uric acid reflected fructokinase activity. In turn, the greatest renal protection was observed in the proximal tubules and surrounding tubulointerstitium.
Glomerular injury was also prevented in diabetic khk−/− mice, as noted by less mesangial expansion and less glomerular macrophage infiltration. The mechanism for the glomerular protection is unknown, but several possibilities could be proposed. For example, uric acid is released into the circulation following fructose metabolism, where it could act to induce glomerular hypertension and injury.18 Uric acid is known to stimulate MCP-1/CCL2 and oxidative stress in vascular smooth muscle cells20,21 and endothelial cells.22,23 Experimentally, uric acid has been shown to activate the renin angiotensin system, induce microvascular disease, alter renal autoregulation, and increase glomerular hydrostatic pressure.18,24 Fructose can also increase the expression of intercellular adhesion molecule-1 in vascular endothelial cells throughout the kidney.25 In addition, selective injury to the proximal tubule can result in glomerular damage, possibly because of connecting tubule glomerular feedback in which reflex arteriolar vasodilation from tubular damage causes increases in glomerular pressure.26,27 Interestingly, repeated proximal tubular damage has been proposed as a pathogenic mechanism in the progression of diabetic nephropathy.28 Further studies are necessary to better understand the mechanisms by which the absence of KHK can influence tubular and glomerular changes in diabetes.
An interesting finding in the study was that renal sorbitol levels were lower in the diabetic KHK−/− mouse than the wild-type diabetic mouse. There was also a tendency for lower AR protein expression and activity in diabetic KHK−/− mice compared with wild-type diabetic mice, although this was not significant. One potential explanation may relate to uric acid; we have found that uric acid stimulates KHK expression29 and AR expression (unpublished data) in liver cells. Indeed, uric acid levels were lower in the cortex of diabetic KHK−/− mice compared with controls. However, further studies would be necessary to test this hypothesis.
One limitation of this study is that streptozotocin injection in mice is associated with only mild diabetic nephropathy, especially in the C57/BL6 background. Therefore, it would be ideal to evaluate the role of KHK in models of more advanced nephropathy, such as those observed in the endothelial nitric oxide synthase–deficient mouse or in diabetic nephropathy–associated strains, such as db/db or BTBR ob/ob.30–33 Nevertheless, the importance of this study is that it identifies fructokinase as a new target for diabetic renal disease. It also emphasizes the increasingly recognized importance of the tubulointerstitium in diabetic renal disease.34–37
Further studies investigating the role of renal fructokinase in both AKI and CKD appears to be warranted.
Concise Methods
Mice
Global khk−/− (deficient in both isoform A and C) and wild-type controls in the C57/Bl6 background were generated and bred as described previously.5,38 All mice were bred in the specific pathogen–free barrier facility at the University of Colorado Denver. All animal experiments were performed in accordance with the Animal Care and Use Committee of the University of Colorado. In all experiments described, male mice aged 6–8 weeks with a body weight of 22–25 g were used. Diabetic nephropathy was induced by intraperitoneal injections of streptozotocin (50 mg/kg per day for 5 consecutive days) dissolved in 10 mM citrate buffer, pH 4.5.39 After streptozotocin administration, 96% of mice became diabetic. Mice were divided into four subgroups (n≥6/group): (1) a nondiabetic wild-type group, (2) a nondiabetic khk−/− group, (3) a diabetic wild-type group, and (4) a diabetic khk−/− group. Body weight was measured weekly and urine was collected overnight, using metabolic cages, the day before euthanasia. All mice were euthanized 10 weeks after last streptozotocin injection to obtain blood samples and kidney tissues.
Laboratory Studies
Urine albumin and serum and urine creatinine were measured with Albuwell M (Exocell, Philadelphia, PA) and Creatinine LiquiColor Test (Enzymatic Methodology; Stanbio, Boerne, TX), respectively. Urine levels of NGAL were measured with a mouse NGAL ELISA kit (R&D Systems, Minneapolis, MN). Urinary levels of NAG were determined with a NAG ELISA kit (catalog #CS0780; Sigma-Aldrich, St. Louis, MO). Plasma and urinary phosphate were detected with a biochemical assay (Biovision, Milpitas, CA). Fractional excretion of phosphate was calculated by using the following ratio:
where U and P refer to the urine and plasma concentrations of phosphate (PO4) and creatinine (Cr). Creatinine clearance was calculated as the ratio between urinary and serum creatinine (in mg/dl) normalized by urinary volume in milliliters collected in 360 minutes.
Histologic Analysis
Formalin-fixed, paraffin-embedded sections (2.5 μm) were stained with PAS for light microscopy. Kidney sections were scanned using an Aperio Scanscope and observed by two investigators in a blinded manner. On coronal sections of the kidney, all glomeruli (50–100 glomeruli) were examined for glomerular hypertrophy and tubules were analyzed for tubular dilatation. Mesangial expansion was determined as described elsewere40 by calculating the relative mesangial area by determining the proportion of PAS-positive and nuclei-free area in the mesangium.
Immunohistochemistry
Formalin or methyl Carnoy solution–fixed, paraffin-embedded sections were used for immunohistochemistry, as previously described.39 The following antibodies were used as primary antibodies: (1) rabbit anti–type IV collagen antibody (Chemicon International, Temecula, CA), (2) rabbit anti-mouse aldose reductase (AKR1B1) antibody (Novus Biologicals, Littleton, CO), (3) rabbit anti-mouse fructokinase (KHK) antibody (for both KHK-A and KHK-C isoforms; Sigma-Aldrich); (4) goat anti–type III collagen antibody (Southern Biotech, Birmingham, AL), and (5) rabbit anti-ACE antibody (Chemicon). Briefly, after deparaffinization, the sections were treated with 3% H2O2 for 10 minutes to inactivate endogenous peroxidase activity. After incubation with a background sniper (Biocare Medical, Concord, CA) for 15 minutes, sections were incubated with primary antibodies overnight at 4°C. The sections were also incubated with rabbit anti-IgG secondary antibodies for 30 minutes before immunoperoxidase staining was conducted using the Mach2 rabbit horseradish peroxidase polymer (Biocare Medical). To assess the type III collagen–, type IV collagen–, and ACE-positive area, the digital images at ×400 magnification were analyzed using Image scope software (Aperio Technologies, Vista, CA). The percentage positive area was determined as the 3,3-diaminobenzidine-positive pixel values per examined interest area in each section. For ACE determination, every animal in each group of five random fields corresponding to the kidney cortex and outer medulla were analyzed for ACE expression. Approximately 25–40 tubules were counted per field. The intensity area obtained for each field was further normalized to the area occupied by the specific tubule analyzed.
Immunofluorescence on Mouse Kidneys
Immunofluorescence against CD68 and actin was performed as previously described.41 A laser-scanning confocal microscope LSM 510 META (Carl Zeiss Microimaging, Thornwood, NY) was used to obtain images. On coronal sections of the kidney, all glomeruli (>35 glomeruli/slide) and tubules were examined and CD68-positive cells counted per glomeruli or per area. Dihydroethidium staining was performed as previously described.42
Cell Culture
Immortalized human proximal tubule cells (HK-2) were cultured in keratinocyte–serum-free medium (Invitrogen) supplemented with 10% FBS, penicillin (100 U/L), streptomycin (100 μg/L), human recombinant epidermal growth factor, and bovine pituitary extract. Cells were cultured at 37°C to 60%–70% confluency and then exposed to normal glucose (5 mM) or high glucose alone (25 mM) or in combination with sorbinil (10 µM) for 72 hours. After exposure, total RNA was extracted from cells with the RNeasy kit (Qiagen, Gaithersburg, MD), cDNA created with the iSCript kit (Bio-Rad, Hercules, CA), and analysis of specific mRNA expression performed by real-time PCR using oligonucleotide primers specified in Supplemental Table 1. The amount of PCR products was normalized with β-actin mRNA to determine the relative expression ratio. For the generation of HK-2 cells with stable silencing of KHK, confluent cells were transduced with lentiviral particles containing specific human KHK small hairpin RNA (sc-60878-v; Santa Cruz Biotechnologies) or scramble control small hairpin RNAs. After transduction, cells were changed with medium containing puromycin (2 µg/ml) and growing clones were selected after dilution series. Selected clones were analyzed for KHK expression by quantitative PCR or Western blotting.
NF-κB Activity Assay in Cultured Cells
NF-κB activation was determined as previously described43 with modifications. Briefly, HK-2 cells were grown to 50% confluence in six-well plates and transiently transfected with a NF-κB luciferase reporter cassette and a β-galactosidase reporter (used for normalizing the transfection efficiency). Replicates were incubated at normoglycemic conditions or with acute exposure to hyperglycemia in the presence or absence of the xanthine oxidase inhibitor, allopurinol (100 µM) for 24 hours. Cells were then lysed directly in luciferase reporter lysis buffer (Promega). Supernatants from cell lysates were mixed with luciferase substrate and measured immediately with a Luminoskan Ascent DCReady luminometer (Labsystems). Luciferase activity was normalized to β-galactosidase expression as described previously.44
Determination of AR and Fructokinase Activity in Kidney Cortex Homogenates
Kidney cortex samples were homogenized in a buffer containing (in mM) KCl (150), Tris-HCl (pH 7.5) (20), EDTA (pH 8.0) (1), and dithiothreitol (1), centrifuged at maximum speed (13,000 rpm, 4°C) and the supernatant protein content quantified with the BCA assay. For AR activity, we followed the method initially developed by Hayman and Kinoshita45 with modifications.46 Briefly, 50 µg of lysate were incubated with 50 mM potassium phosphate buffer pH 6.2, 0.4 M lithium sulfate, 5 mM 2-mercaptoethanol, 10 mM DL-glyceraldehyde, 0.1 mM nicotinamide adenine dinucleotide phosphate-oxidase (NADPH). The assay mixture was incubated at 37°C and initiated by the addition of NADPH, and AR activity was determined by measuring the change in the absorbance at 340 nm with a plate reader (Biotek Synergy 2) and expressed as the μmol of DL-glyceraldehyde consumed per hour. Appropriate blanks were used to subtract the natural decay of NADPH in the samples. KHK activity was measured in lysates by determining the rapid ATP depletion that occurs after fructose load (5 mM). Briefly, tissues were homogenized in buffer containing imidazole (50 mM)/KAc (1 M) buffer, and 50 μg of lysates was exposed to 5 mM fructose and 1 mM ATP at 37°C. ATP levels were measured 2 hours after incubation using the ATP determination kit (K354–100; BioVision, Inc.) as per manufacturer's instructions. KHK activity was calculated as the ratio between ATP levels at 2 hours versus baseline for each sample, and values were compared between groups.
Determination of Cortical Sorbitol, Fructose, and Uric Acid Levels
Kidney cortex samples were homogenized in a buffer containing (in mM) MgCl2 (2), EGTA (1), dithiothreitol (1), and 0.5% Triton X-100. Homogenates were centrifuged at 13,000 rpm for 10 minutes (4°C) and protein in the collected supernatant quantified. For sorbitol determination, 5 µl of the supernatant was assayed using the sorbitol determination kit (K631–100, BioVision, Inc.) as per manufacturer’s instruction. For fructose determination, 20 µl of the supernatant was analyzed with the Bioassay Systems fructose determination kit (EFRU-100) and 5 µl of supernatant was used for uric acid determination with the Bioassay Systems determination kit (DIUA-250). Values were normalized to protein concentration in the lysate.
Statistical Analyses
All values are expressed as mean±SD. Statistical analysis was performed with ANOVA using Bonferroni method to compare the groups. P<0.05 was considered to represent statistically significant differences.
Disclosures
M.A.L., T.I., and R.J.J. are listed as inventors on a patent application from the University of Colorado related to developing isoform-specific fructokinase inhibitors in the treatment of obesity and insulin resistance and diabetic nephropathy. R.J.J. has equity with XORT Therapeutics, Inc., which is interested in pursuing xanthine oxidase inhibitors for the treatment of diabetic nephropathy. R.J.J. has consulted for Danone; is on the scientific board of Amway; and has received grants from the National Institutes of Health and from Amway, Cardero, Danone, and Questcor.
Supplementary Material
Acknowledgments
This work was supported by grants HL-68607 and RC4-DK090859-01 (to R.J.J.), grant 1K01-DK095930-01 (to M.A.L.), and grant RO1-DK082509 (to G.G.) from the National Institutes of Health, Diabetes UK (UK), grant RD04/0002833, and startup funds from the University of Colorado.
Footnotes
Published online ahead of print. Publication date available at www.jasn.org.
See related editorial, “Sweet Debate: Fructose versus Glucose in Diabetic Kidney Disease,” on pages 2386–2388.
This article contains supplemental material online at http://jasn.asnjournals.org/lookup/suppl/doi:10.1681/ASN.2013080901/-/DCSupplemental.
References
- 1.Brenner BM, Cooper ME, de Zeeuw D, Keane WF, Mitch WE, Parving HH, Remuzzi G, Snapinn SM, Zhang Z, Shahinfar S, RENAAL Study Investigators : Effects of losartan on renal and cardiovascular outcomes in patients with type 2 diabetes and nephropathy. N Engl J Med 345: 861–869, 2001 [DOI] [PubMed] [Google Scholar]
- 2.Nakayama T, Kosugi T, Gersch M, Connor T, Sanchez-Lozada LG, Lanaspa MA, Roncal C, Perez-Pozo SE, Johnson RJ, Nakagawa T: Dietary fructose causes tubulointerstitial injury in the normal rat kidney. Am J Physiol Renal Physiol 298: F712–F720, 2010 [DOI] [PMC free article] [PubMed] [Google Scholar]
- 3.Gersch MS, Mu W, Cirillo P, Reungjui S, Zhang L, Roncal C, Sautin YY, Johnson RJ, Nakagawa T: Fructose, but not dextrose, accelerates the progression of chronic kidney disease. Am J Physiol Renal Physiol 293: F1256–F1261, 2007 [DOI] [PubMed] [Google Scholar]
- 4.Burch HB, Choi S, Dence CN, Alvey TR, Cole BR, Lowry OH: Metabolic effects of large fructose loads in different parts of the rat nephron. J Biol Chem 255: 8239–8244, 1980 [PubMed] [Google Scholar]
- 5.Diggle CP, Shires M, Leitch D, Brooke D, Carr IM, Markham AF, Hayward BE, Asipu A, Bonthron DT: Ketohexokinase: expression and localization of the principal fructose-metabolizing enzyme. J Histochem Cytochem 57: 763–774, 2009 [DOI] [PMC free article] [PubMed] [Google Scholar]
- 6.Wang S, Mitu GM, Hirschberg R: Osmotic polyuria: An overlooked mechanism in diabetic nephropathy. Nephrol Dial Transplant 23: 2167–2172, 2008 [DOI] [PubMed] [Google Scholar]
- 7.Prabhakar S, Starnes J, Shi S, Lonis B, Tran R: Diabetic nephropathy is associated with oxidative stress and decreased renal nitric oxide production. J Am Soc Nephrol 18: 2945–2952, 2007 [DOI] [PubMed] [Google Scholar]
- 8.Huang SP, Palla S, Ruzycki P, Varma RA, Harter T, Reddy GB, Petrash JM: Aldo-keto reductases in the eye. J Ophthalmol 2010: 521204, 2010 [DOI] [PMC free article] [PubMed] [Google Scholar]
- 9.Ho EC, Lam KS, Chen YS, Yip JC, Arvindakshan M, Yamagishi S, Yagihashi S, Oates PJ, Ellery CA, Chung SS, Chung SK: Aldose reductase-deficient mice are protected from delayed motor nerve conduction velocity, increased c-Jun NH2-terminal kinase activation, depletion of reduced glutathione, increased superoxide accumulation, and DNA damage. Diabetes 55: 1946–1953, 2006 [DOI] [PubMed] [Google Scholar]
- 10.Cirillo P, Gersch MS, Mu W, Scherer PM, Kim KM, Gesualdo L, Henderson GN, Johnson RJ, Sautin YY: Ketohexokinase-dependent metabolism of fructose induces proinflammatory mediators in proximal tubular cells. J Am Soc Nephrol 20: 545–553, 2009 [DOI] [PMC free article] [PubMed] [Google Scholar]
- 11.Lee FT, Cao Z, Long DM, Panagiotopoulos S, Jerums G, Cooper ME, Forbes JM: Interactions between angiotensin II and NF-kappaB-dependent pathways in modulating macrophage infiltration in experimental diabetic nephropathy. J Am Soc Nephrol 15: 2139–2151, 2004 [DOI] [PubMed] [Google Scholar]
- 12.Kanamori H, Matsubara T, Mima A, Sumi E, Nagai K, Takahashi T, Abe H, Iehara N, Fukatsu A, Okamoto H, Kita T, Doi T, Arai H: Inhibition of MCP-1/CCR2 pathway ameliorates the development of diabetic nephropathy. Biochem Biophys Res Commun 360: 772–777, 2007 [DOI] [PubMed] [Google Scholar]
- 13.Ohga S, Shikata K, Yozai K, Okada S, Ogawa D, Usui H, Wada J, Shikata Y, Makino H: Thiazolidinedione ameliorates renal injury in experimental diabetic rats through anti-inflammatory effects mediated by inhibition of NF-kappaB activation. Am J Physiol Renal Physiol 292: F1141–F1150, 2007 [DOI] [PubMed] [Google Scholar]
- 14.Wang XX, Jiang T, Shen Y, Caldas Y, Miyazaki-Anzai S, Santamaria H, Urbanek C, Solis N, Scherzer P, Lewis L, Gonzalez FJ, Adorini L, Pruzanski M, Kopp JB, Verlander JW, Levi M: Diabetic nephropathy is accelerated by farnesoid X receptor deficiency and inhibited by farnesoid X receptor activation in a type 1 diabetes model. Diabetes 59: 2916–2927, 2010 [DOI] [PMC free article] [PubMed] [Google Scholar]
- 15.Breyer MD, Böttinger E, Brosius FC, 3rd, Coffman TM, Harris RC, Heilig CW, Sharma K, AMDCC : Mouse models of diabetic nephropathy. J Am Soc Nephrol 16: 27–45, 2005 [DOI] [PubMed] [Google Scholar]
- 16.Lanaspa MA, Sanchez-Lozada LG, Choi YJ, Cicerchi C, Kanbay M, Roncal-Jimenez CA, Ishimoto T, Li N, Marek G, Duranay M, Schreiner G, Rodriguez-Iturbe B, Nakagawa T, Kang DH, Sautin YY, Johnson RJ: Uric acid induces hepatic steatosis by generation of mitochondrial oxidative stress: potential role in fructose-dependent and -independent fatty liver. J Biol Chem 287: 40732–40744, 2012 [DOI] [PMC free article] [PubMed] [Google Scholar]
- 17.Sánchez-Lozada LG, Tapia E, Jiménez A, Bautista P, Cristóbal M, Nepomuceno T, Soto V, Avila-Casado C, Nakagawa T, Johnson RJ, Herrera-Acosta J, Franco M: Fructose-induced metabolic syndrome is associated with glomerular hypertension and renal microvascular damage in rats. Am J Physiol Renal Physiol 292: F423–F429, 2007 [DOI] [PubMed] [Google Scholar]
- 18.Sánchez-Lozada LG, Tapia E, Santamaría J, Avila-Casado C, Soto V, Nepomuceno T, Rodríguez-Iturbe B, Johnson RJ, Herrera-Acosta J: Mild hyperuricemia induces vasoconstriction and maintains glomerular hypertension in normal and remnant kidney rats. Kidney Int 67: 237–247, 2005 [DOI] [PubMed] [Google Scholar]
- 19.Kosugi T, Nakayama T, Heinig M, Zhang L, Yuzawa Y, Sanchez-Lozada LG, Roncal C, Johnson RJ, Nakagawa T: Effect of lowering uric acid on renal disease in the type 2 diabetic db/db mice. Am J Physiol Renal Physiol 297: F481–F488, 2009 [DOI] [PMC free article] [PubMed] [Google Scholar]
- 20.Kanellis J, Watanabe S, Li JH, Kang DH, Li P, Nakagawa T, Wamsley A, Sheikh-Hamad D, Lan HY, Feng L, Johnson RJ: Uric acid stimulates monocyte chemoattractant protein-1 production in vascular smooth muscle cells via mitogen-activated protein kinase and cyclooxygenase-2. Hypertension 41: 1287–1293, 2003 [DOI] [PubMed] [Google Scholar]
- 21.Corry DB, Eslami P, Yamamoto K, Nyby MD, Makino H, Tuck ML: Uric acid stimulates vascular smooth muscle cell proliferation and oxidative stress via the vascular renin-angiotensin system. J Hypertens 26: 269–275, 2008 [DOI] [PubMed] [Google Scholar]
- 22.Yu MA, Sánchez-Lozada LG, Johnson RJ, Kang DH: Oxidative stress with an activation of the renin-angiotensin system in human vascular endothelial cells as a novel mechanism of uric acid-induced endothelial dysfunction. J Hypertens 28: 1234–1242, 2010 [PubMed] [Google Scholar]
- 23.Sánchez-Lozada LG, Lanaspa-Garcia MA, Cristobal M: F., G-A, Soto, V, Cruz-Robles, D, Nakagawa, T, Yu, MA, Kang, DH, Johnson, RJ: Uric acid-induced endothelial dysfunction is associated with mitochondrial alterations and decreased intracellular ATP concentrations. Nephron Exp Nephrol 121: e71–78, 2012 [DOI] [PMC free article] [PubMed] [Google Scholar]
- 24.Sánchez-Lozada LG, Tapia E, Soto V, Avila-Casado C, Franco M, Zhao L, Johnson RJ: Treatment with the xanthine oxidase inhibitor febuxostat lowers uric acid and alleviates systemic and glomerular hypertension in experimental hyperuricaemia. Nephrol Dial Transplant 23: 1179–1185, 2008 [DOI] [PubMed] [Google Scholar]
- 25.Glushakova O, Kosugi T, Roncal C, Mu W, Heinig M, Cirillo P, Sánchez-Lozada LG, Johnson RJ, Nakagawa T: Fructose induces the inflammatory molecule ICAM-1 in endothelial cells. J Am Soc Nephrol 19: 1712–1720, 2008 [DOI] [PMC free article] [PubMed] [Google Scholar]
- 26.Wang H, Garvin JL, D’Ambrosio MA, Ren Y, Carretero OA: Connecting tubule glomerular feedback antagonizes tubuloglomerular feedback in vivo. Am J Physiol Renal Physiol 299: F1374–F1378, 2010 [DOI] [PMC free article] [PubMed] [Google Scholar]
- 27.Grgic I, Campanholle G, Bijol V, Wang C, Sabbisetti VS, Ichimura T, Humphreys BD, Bonventre JV: Targeted proximal tubule injury triggers interstitial fibrosis and glomerulosclerosis. Kidney Int 82: 172–183, 2012 [DOI] [PMC free article] [PubMed] [Google Scholar]
- 28.Bonventre JV: Can we target tubular damage to prevent renal function decline in diabetes? Semin Nephrol 32: 452–462, 2012 [DOI] [PMC free article] [PubMed] [Google Scholar]
- 29.Lanaspa MA, Sanchez-Lozada LG, Cicerchi C, Li N, Roncal-Jimenez CA, Ishimoto T, Le M, Garcia GE, Thomas JB, Rivard CJ, Andres-Hernando A, Hunter B, Schreiner G, Rodriguez-Iturbe B, Sautin YY, Johnson RJ: Uric acid stimulates fructokinase and accelerates fructose metabolism in the development of fatty liver. PLoS ONE 7: e47948, 2012 [DOI] [PMC free article] [PubMed] [Google Scholar]
- 30.Kanetsuna Y, Takahashi K, Nagata M, Gannon MA, Breyer MD, Harris RC, Takahashi T: Deficiency of endothelial nitric-oxide synthase confers susceptibility to diabetic nephropathy in nephropathy-resistant inbred mice. Am J Pathol 170: 1473–1484, 2007 [DOI] [PMC free article] [PubMed] [Google Scholar]
- 31.Zhao HJ, Wang S, Cheng H, Zhang MZ, Takahashi T, Fogo AB, Breyer MD, Harris RC: Endothelial nitric oxide synthase deficiency produces accelerated nephropathy in diabetic mice. J Am Soc Nephrol 17: 2664–2669, 2006 [DOI] [PMC free article] [PubMed] [Google Scholar]
- 32.Nakagawa T, Sato W, Glushakova O, Heinig M, Clarke T, Campbell-Thompson M, Yuzawa Y, Atkinson MA, Johnson RJ, Croker B: Diabetic endothelial nitric oxide synthase knockout mice develop advanced diabetic nephropathy. J Am Soc Nephrol 18: 539–550, 2007 [DOI] [PubMed] [Google Scholar]
- 33.Hudkins KL, Pichaiwong W, Wietecha T, Kowalewska J, Banas MC, Spencer MW, Mühlfeld A, Koelling M, Pippin JW, Shankland SJ, Askari B, Rabaglia ME, Keller MP, Attie AD, Alpers CE: BTBR Ob/Ob mutant mice model progressive diabetic nephropathy. J Am Soc Nephrol 21: 1533–1542, 2010 [DOI] [PMC free article] [PubMed] [Google Scholar]
- 34.Gilbert RE, Cooper ME: The tubulointerstitium in progressive diabetic kidney disease: more than an aftermath of glomerular injury? Kidney Int 56: 1627–1637, 1999 [DOI] [PubMed] [Google Scholar]
- 35.Thomas MC, Burns WC, Cooper ME: Tubular changes in early diabetic nephropathy. Adv Chronic Kidney Dis 12: 177–186, 2005 [DOI] [PubMed] [Google Scholar]
- 36.Magri CJ, Fava S: The role of tubular injury in diabetic nephropathy. Eur J Intern Med 20: 551–555, 2009 [DOI] [PubMed] [Google Scholar]
- 37.Phillips AO, Steadman R: Diabetic nephropathy: The central role of renal proximal tubular cells in tubulointerstitial injury. Histol Histopathol 17: 247–252, 2002 [DOI] [PubMed] [Google Scholar]
- 38.Ishimoto T, Lanaspa MA, Le MT, Garcia GE, Diggle CP, Maclean PS, Jackman MR, Asipu A, Roncal-Jimenez CA, Kosugi T, Rivard CJ, Maruyama S, Rodriguez-Iturbe B, Sánchez-Lozada LG, Bonthron DT, Sautin YY, Johnson RJ: Opposing effects of fructokinase C and A isoforms on fructose-induced metabolic syndrome in mice. Proc Natl Acad Sci U S A 109: 4320–4325, 2012 [DOI] [PMC free article] [PubMed] [Google Scholar]
- 39.Tanabe K, Lanaspa MA, Kitagawa W, Rivard CJ, Miyazaki M, Klawitter J, Schreiner GF, Saleem MA, Mathieson PW, Makino H, Johnson RJ, Nakagawa T: Nicorandil as a novel therapy for advanced diabetic nephropathy in the eNOS-deficient mouse. Am J Physiol Renal Physiol 302: F1151–F1160, 2012 [DOI] [PMC free article] [PubMed] [Google Scholar]
- 40.Koya D, Haneda M, Nakagawa H, Isshiki K, Sato H, Maeda S, Sugimoto T, Yasuda H, Kashiwagi A, Ways DK, King GL, Kikkawa R: Amelioration of accelerated diabetic mesangial expansion by treatment with a PKC beta inhibitor in diabetic db/db mice, a rodent model for type 2 diabetes. FASEB J 14: 439–447, 2000 [DOI] [PubMed] [Google Scholar]
- 41.Lanaspa MA, Andres-Hernando A, Li N, Rivard CJ, Cicerchi C, Roncal-Jimenez C, Schrier RW, Berl T: The expression of aquaporin-1 in the medulla of the kidney is dependent on the transcription factor associated with hypertonicity, TonEBP. J Biol Chem 285: 31694–31703, 2010 [DOI] [PMC free article] [PubMed] [Google Scholar]
- 42.Ishimoto T, Lanaspa MA, Rivard CJ, Roncal-Jimenez CA, Orlicky DJ, Cicerchi C, McMahan RH, Abdelmalek MF, Rosen HR, Jackman MR, MacLean PS, Diggle CP, Asipu A, Inaba S, Kosugi T, Sato W, Maruyama S, Sánchez-Lozada LG, Sautin YY, Hill JO, Bonthron DT, Johnson RJ: High-fat and high-sucrose (western) diet induces steatohepatitis that is dependent on fructokinase. Hepatology 58: 1632–1643, 2013 [DOI] [PMC free article] [PubMed] [Google Scholar]
- 43.Bren-Mattison Y, Meyer AM, Van Putten V, Li H, Kuhn K, Stearman R, Weiser-Evans M, Winn RA, Heasley LE, Nemenoff RA: Antitumorigenic effects of peroxisome proliferator-activated receptor-gamma in non-small-cell lung cancer cells are mediated by suppression of cyclooxygenase-2 via inhibition of nuclear factor-kappaB. Mol Pharmacol 73: 709–717, 2008 [DOI] [PubMed] [Google Scholar]
- 44.Refaat Z, Dessev C, Blaine S, Wick M, Butterfield L, Han SY, Heasley LE, Nemenoff RA, Nemenoff RA, Van Putten V : Induction of cytosolic phospholipase A2 by oncogenic Ras is mediated through the JNK and ERK pathways in rat epithelial cells. J Biol Chem 276: 1226–1232, 2001 [DOI] [PubMed] [Google Scholar]
- 45.Hayman S, Kinoshita JH: Isolation and properties of lens aldose reductase. J Biol Chem 240: 877–882, 1965 [PubMed] [Google Scholar]
- 46.Suryanarayana P, Kumar PA, Saraswat M, Petrash JM, Reddy GB: Inhibition of aldose reductase by tannoid principles of Emblica officinalis: Implications for the prevention of sugar cataract. Mol Vis 10: 148–154, 2004 [PubMed] [Google Scholar]
Associated Data
This section collects any data citations, data availability statements, or supplementary materials included in this article.