Abstract
Cancer is a complex and heterogeneous disease. Genetic methods have uncovered thousands of complex tissue-specific mutation-induced effects and identified multiple disease gene targets. Important associations between cancer and other biological entities (eg, genes and drugs) in cancer network, however, are usually scattered in biomedical publications. Systematic analyses of these cancer-specific associations can help highlight the hidden associations between different cancer types and related genes/drugs. In this paper, we proposed a novel network-based computational framework to identify statistically over-expressed subnetwork patterns called network motifs (NMs) in an integrated cancer-specific drug–disease–gene network extracted from Semantic MEDLINE, a database containing extracted associations from MEDLINE abstracts. Eight significant NMs were identified and considered as the backbone of the cancer association network. Each NM corresponds to specific biological meanings. We demonstrated that such approaches will facilitate the formulization of novel cancer research hypotheses, which is critical for translational medicine research and personalized medicine in cancer.
Keywords: network analysis, network motif, cancer, semantic MEDLINE, drug-disease-gene network
Introduction
Cancer is a complex and heterogeneous genetic disease. Decades of molecular genetic research have identified a number of susceptibility genes responsible for the underlying genesis in different types of cancers.1 It is anticipated that cancer can involve 5–10% of human genes.2 However, currently experimentally validated cancer genes only cover 1% of human genes, suggesting that there are still hundreds to thousands of cancer genes that remain to be identified. Similarly, drugs that target known mutated cancer genes have brought dramatic therapeutic advances and substantially improve and prolong the lives of cancer patients.3 Owing to extreme heterogeneity and complexity in cancer, there is a pressing need to develop individualized treatment for cancer patients. However, drug development is a costly, complex, and time-consuming process.4 Nevertheless, large amounts of biomedical data and findings provide us with unprecedented opportunities to explore associations among different types of cancers, drugs, and genes. Systematic analyses of these cancer-specific associations can help highlight the hidden associations between different cancer types and related genes and drugs.
During the last decade, network-based computational approaches gained popularity and have become a new paradigm to investigate associations among drugs, diseases, and genes. Applications of these approaches include drug repositioning,5,6 disease gene prioritization,7–9 and identification of disease relationships.10,11 Majority of these approaches focuses on relationships between only two categories (eg, association between gene and disease). For instance, a human disease–drug network was created based on genomic expression profiles collected from public GEO database. In total, 170,027 interactions between diseases and drugs were considered significant, including 645 disease–disease, 5,008 disease–drug, and 164,374 drug–drug associations.12 These expression-based associations among diseases and drugs could serve as future research directions. Bauer-Mehren et al.13 developed a comprehensive disease–gene association network by integrating associations from several sources that cover different biomedical aspects of diseases. The results indicate a highly shared genetic origin of human diseases. Functional modules were also detected in several Mendelian disorders as well as in common diseases. To systematically analyze drug–disease–gene relationships, Daminelli et al.14 proposed a network-based approach to predict novel drug–gene and drug–disease associations by completing incomplete bicliques in the network. This approach holds great potential for drug repositioning and discovery of novel associations. However, they are not comprehensive and are limited to only certain associations between drugs, genes, and diseases (ie, drug–disease and drug–gene associations). A network-based investigation considering all pair-wise associations among these entities is necessary to understand the complexity of existing associations and to infer novel associations within the context of the whole knowledge base.
Network-based computational approaches enable us to analyze heterogeneous networks such as drug–disease–gene networks by decomposing them into small subnetworks, called network motifs (NMs).15 NMs are statistically significant recurring structural patterns found more often in real networks than would be expected in random networks with the same network topologies. They are the smallest basic functional and evolutionarily conserved units in biological networks. The hypothesis is that NMs of a network are the significant sub-patterns that represent the backbone of the network, which serves as the focused portion out of hundreds of nodes (eg, drugs, diseases, and genes). These NMs could also form large aggregated modules that perform specific functions by forming associations among a large number of NMs.
In this paper, we constructed a heterogeneous cancer–drug–gene network from public literature knowledge and investigated the underlying association relationships using network-based systems biology approaches. First, we developed a domain pattern-driven approach to construct an integrated cancer–drug–gene network extracted from Semantic MEDLINE Database. Second, we proposed a network-based computational approach to mine this integrated heterogeneous network. Significant NMs were detected and evaluated for their potential biological meanings. We demonstrate that these NMs have potential to help prioritize disease genes and propose novel drug targets. The analysis of such cancer-focused network involving cancer–drug and cancer–gene associations permits researchers a more detailed evaluation of the specific relationships between individual cancers. We believe that such approaches will facilitate formulization of novel research hypotheses, which is critical for translational medicine research.
Methods
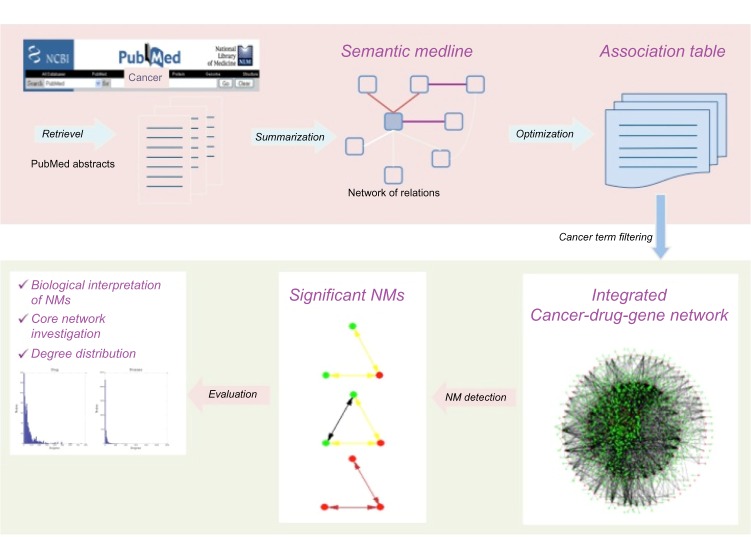
To comprehensively investigate the integrated cancer–drug–gene network formed by associations available in Semantic MEDLINE, we proposed the following two-step computational framework: (1) extraction and optimization of cancer–drug–gene network in Semantic MEDLINE and (2) network topology analysis of this heterogeneous network at two levels: statistics and degree distribution of high-confidence association networks, and distinct pattern detection at the NM level. In this section, we first describe the steps to extract association network data from MEDLINE database, followed by a description of the proposed network-based approach to investigate this heterogeneous drug–disease–gene association network. Figure 1 illustrates the steps of the proposed approach.
Figure 1.
Overview of the network-based computational framework for an integrated cancer–drug–disease network.
Data Sources and Preprocessing
Semantic MEDLINE in RDF
For this research, we used biomedical research findings extracted from MEDLINE literature as our knowledge base. MEDLINE16 contains more than 19 million references to published articles in the biomedical fields. We first downloaded the Semantic MEDLINE Database,17 which is an National Library of Medicine (NLM)-supported database that contains different biomedical entities and their relationships extracted from MEDLINE abstracts using natural language processing methods. Semantic MEDLINE provides comprehensive resources with structured annotations with Unified Medical Language System (UMLS) terms and properties. It currently contains more than 56 million relations extracted from MEDLINE articles. In our previous research, we reorganized these relations into six different Resource Description Framework (RDF) graphs based on the semantic types of the associated concepts.18 Based on the source and target concepts and their semantic groups, we extracted 843k disease–disease, 111k disease–gene, 1,277k disease–drug, 248k drug–gene, 1,900k drug–drug, and 49k gene–gene associations. Table 1 shows some basic statistics of these six groups of associations.
Table 1.
Statistics of the six extracted association groups.
| ASSOCIATION | RECORD | UNIQUE ASSOCIATION | UMLS UNIQUE ASSOCIATION |
|---|---|---|---|
| Disease to Disease | 2,516,049 | 843,221 | 2,457,748 |
| Disease to Gene | 206,155 | 111,117 | 43,368 |
| Disease to Drug | 3,021,256 | 1,277,879 | 96,290 |
| Drug to Gene | 398,572 | 248,491 | 99,275 |
| Drug to Drug | 4,780,394 | 1,900,576 | 2,113,243 |
| Gene to Gene | 108,035 | 49,593 | 218,843 |
Cancer relevant relation extraction
From the six graphs above, we further extracted those associations that are related to cancer terms. We used “Neoplastic Process” (NEOP) as the semantic type to extract the cancer disease relevant terms. NEOP is defined as a sub-type of disease or syndrome in UMLS semantic type. The associations involving NEOP were extracted and used for downstream network-based analyses.
Network Motif Analysis
The six different types of associations among cancers, drugs, and genes were integrated into a heterogeneous cancer–disease–gene network. In this network, nodes represent biomedical entities (ie, cancer terms, disease, or gene), and edges between nodes represent associations between two nodes (eg, association between drugs and genes). In this paper, we focused on three-node NM identification for this drug–disease–gene network since larger size NMs (number of nodes >3) are composed of three-node NMs in most cases.19 All connected subnetworks containing three nodes in the interaction network were collated into isomorphic patterns, and the number of times each pattern occurred was counted. By the default setting of the algorithm, if the number of occurrences was at least five, which is significantly higher than randomized networks, the pattern was considered to be an NM. Statistical significance test was performed by generating 1,000 randomized networks and computing the fraction of randomized networks in which the pattern appeared at least as often as in the interaction network.19 The z score is calculated using the following equation:
| (1) |
where Nreal is the number of times one three-node subnetwork was detected in the real network, Nrand is the mean number of times this subnetwork was detected in 1,000 randomized networks, and σrand is the standard deviation of the number of times this subnetwork was detected in randomized networks. The P value of a motif is the number of random networks in which this motif occurred more often than in the original networks, divided by the total number of random networks. A pattern with P ≤ 0.05 was considered statistically significant. This NM discovery procedure was performed using the FANMOD tool.20
Construction of the Core Cancer Association Network
It has been shown that in gene regulatory networks, for each NM, the majority of matches overlap and aggregate into homologous motif clusters.21 Many of these motif clusters largely overlap with modules of known biological processes within the gene regulatory network.22 The clusters of overlapping matches of these motifs aggregate into a superstructure that presents the backbone of the network and is assumed to play a central role in defining the global topological organization. Similarly, we aggregated matches of significant NMs as described above into a core cancer–disease–gene network. In this core network, we investigated degree distributions of different types of nodes. Nodes with significantly larger number of links in the network are called hub nodes, which are critical in the information flow exchange throughout the entire network.
Results
An integrated cancer–drug–gene network reconstructed from Semantic MEDLINE
We constructed a cancer–drug–gene network with the following two steps:
Extraction of unique association data: Using a use-case- driven database optimization approach developed in our previous work,23 we extracted six different types of associations from Semantic MEDLINE Database. Table 1 shows basic statistics of these six groups of associations. As illustrated in Table 1, the number of unique associations (the Unique Association column) for each type of associations is significantly lower than the number of total associations (the Record column).
Construction of association data involving cancer terms: We applied the filtering strategy described in the Methods section to extract association data involving only “NEOP” semantic type from the unique association data set. As shown in Table 2, the association number of each table was further reduced. We used this focused association data to construct an integrated cancer–drug–gene network for downstream network-based analyses.
Table 2.
Statistics of the six extracted association groups with at least one cancer term involved.
| ASSOCIATION | RECORD NUMBER |
|---|---|
| Disease to Disease | 6,662 |
| Disease to Gene | 5,886 |
| Disease to Drug | 8,333 |
Network Topology Analysis of the Core Drug–Disease–Gene Network
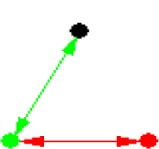
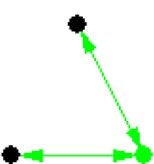
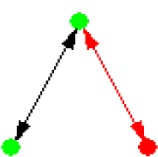
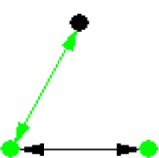
The NM analysis was performed on the integrated cancer– drug–gene network obtained above. As the network contains thousands of associations among 1,711 cancer terms, 1,704 drugs, and 2,551 genes (Table 2), it is too complex for a direct visualization. We overcame this problem by identifying enriched NMs and interpreting them through an enhanced visualization. Out of this heterogeneous network consisting of 16,028 associations among 5,966 entities (including cancers, drugs, and genes), 8 significant NMs were identified. Table 3 presents detailed statistics on these NMs.
Table 3.
Statistics of significant NMs.
| ID | NETWORK MOTIF | FREQUENCY [ORIGINAL] | MEAN-FREQ [RANDOM] | STANDARD-DEV [RANDOM] | Z-SCORE | P-VALUE |
|---|---|---|---|---|---|---|
| 1 |
|
0.10796% | 0.020394% | 8.3749e-005 | 10.455 | 0.001 |
| 2 |
|
28.502% | 28.444% | 6.5741e-005 | 8.7946 | 0.001 |
| 3 |
|
28.269% | 28.212% | 6.5204e-005 | 8.7946 | 0.001 |
| 4 |
|
10.351% | 10.33% | 2.3875e-005 | 8.7946 | 0.001 |
| 5 |
|
18.279% | 18.264% | 2.0985e-005 | 7.3299 | 0 |
| 6 |
|
8.976% | 8.9643% | 1.6581e-005 | 7.0814 | 0 |
| 7 |
|
0.0644% | 0.053421% | 2.6783e-005 | 4.0995 | 0.011 |
| 8 |
|
0.022872% | 0.019592% | 1.1281e-005 | 2.9072 | 0.013 |
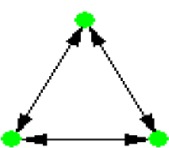
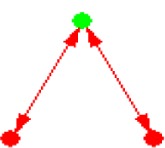
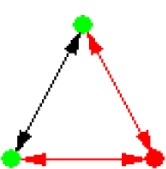
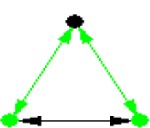
Notes: Node color: green – cancer terms, black – drug, and red – gene. Edge color denotes the associations between different biomedical entities.
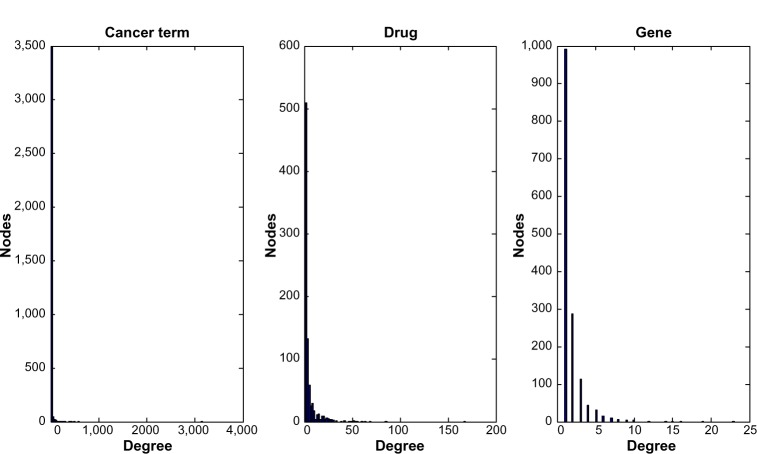
Based on the NMs identified in the analysis, we constructed a core cancer–drug–gene network aggregated from significant NM instances. We then investigated the degree distribution of different types of entities in the integrated network. Figure 2 represents the degree distribution of cancer, drug, and gene nodes in the core cancer–disease–gene network. All three distributions follow the power-law distribution, indicating that networks related to different types of nodes are scale free. The majority of the nodes in the network have only a few (less than 10) links, but a few other nodes have a large number of links. Such distributions have been observed in many studies of biological networks.24 Our analysis demonstrates that in an integrated network consisting of heterogeneous associations, the scale-free network structure still holds. The hub nodes (ie, the nodes having a large number of links) can provide scientists future research directions.
Figure 2.
Degree distribution of three biomedical entities: cancer term, drug, and gene.
Local Network Structure: From Network to NM
The eight significant NM patterns in Table 3 have strong biological meanings and could suggest scientists future directions in their research field. One example is NM 7 (Table 3), in which two cancer terms that are associated with each other are also associated with one common gene. This indicates that diseases identified to be associated in literature are more likely to share the same associated disease genes. To further investigate the relationships highlighted by NM 7, we extracted all associations among 75 cancer terms and 848 genes in NM 7. In total, there are 907 disease–disease and 2,713 disease–gene associations (Fig. 3A) in this subnetwork, suggesting that diseases that are associated with each other are more likely to be associated with a group of common disease genes. For instance, in Figure 3B, “malignant neoplasm of prostate” shares its 253 associated genes with a list of cancer-related terms, such as “neuroendocrine tumors” and “leukemia.” Specifically, five leukemia-related terms were directly associated with “malignant neoplasm of prostate.” Similar findings have also been discovered in other studies demonstrating the same functional modules/pathways being affected in both diseases.25 There are only 25 genes associated to “leukemia” in literature. Such information will help scientists generate testable hypotheses of possible roles of these genes in future leukemia research. The detailed associations in Figure 3 are presented in Supplemental File 1.
Figure 3.
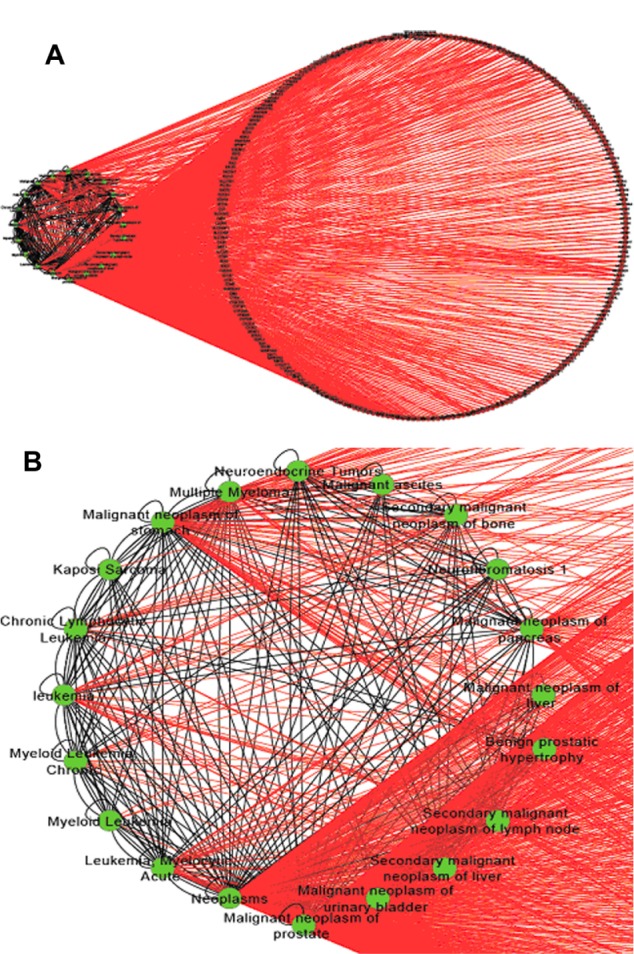
Subnetworks extracted from NM 7. (A) An overview of the subnetwork, consisting of 75 cancer terms and 848 genes. (B) A subnetwork associated with “malignant neoplasm of prostate” and “leukaemia.”
Similarly, NM 8 suggests another association pattern between diseases and drugs, in which two diseases that are associated with each other are targets for the same drug. It has been shown by Suthram et al.11 that diseases with significant correlations based on mRNA gene expression data also share common drugs. This NM supports the hypothesis that similar diseases can be treated by the same drugs, allowing us to make hypotheses of new uses of existing drugs. Three-disease motif (NM 1) was also identified in this heterogeneous network. This NM is also a very common motif pattern in the disease network or gene regulatory network,26,27 which indicates that NM detection analysis of heterogeneous networks can identify significant NMs, including those NM patterns that exist in a single type of association.
Conclusions
In this paper, we proposed a network-based computational framework to investigate integrated heterogeneous network extracted from MEDLINE literature, including associations among three major entity categories: cancer, drug, and gene. Eight significant NMs were identified and considered as the backbone of the entire network. The potential biological meanings of each NM were further investigated. The results demonstrated that the proposed approach holds the potential to prioritize disease genes for different types of cancer and propose novel drug targets, within the context of the entire knowledge. We believe that such analyses can facilitate the process of inferring novel relationships between cancers, drugs, and genes. One future direction is to develop module-based approaches to understand associations between different biomedical entities. Topology analysis of heterogeneous network in graphic theory can also be applied in future studies. Pathway level information could also be integrated.
Supplementary Data
Supplementary File 1. Associations involved in NM 7. There are 907 disease-disease associations and 2,713 disease-gene associations in in NM 7.
Footnotes
Author Contributions
Conceived and designed the experiments: YZ, CT. Analyzed the data: YZ, CT. Wrote the first draft of the manuscript: YZ, CT. Contributed to the writing of the manuscript: YZ, CT. Agree with manuscript results and conclusions: YZ, CT. Jointly developed the structure and arguments for the paper: YZ, CT. Made critical revisions and approved the final version: YZ, CT. Both authors reviewed and approved the final manuscript.
ACADEMIC EDITOR: JT Efird, Editor in Chief
FUNDING: This project was supported by the National Cancer Institute grant P30 CA 134274–04 to the University of Maryland Baltimore, the National Science Foundation under grant 0937060 and the National Center for Biomedical Ontology (NCBO) to CT, and the National Institute of Health grant 5R01LM009959–02 to HL. The authors confirm that the funder had no influence over the study design, content of the article, or selection of this journal.
COMPETING INTERESTS: Authors disclose no potential conflicts of interest.
Paper subject to independent expert blind peer review by minimum of two reviewers. All editorial decisions made by independent academic editor. Prior to publication all authors have given signed confirmation of agreement to article publication and compliance with all applicable ethical and legal requirements, including the accuracy of author and contributor information, disclosure of competing interests and funding sources, compliance with ethical requirements relating to human and animal study participants, and compliance with any copyright requirements of third parties.
REFERENCES
- 1.Futreal PA, Coin L, Marshall M, et al. A census of human cancer genes. Nat Rev Cancer. 2004;4(3):177–83. doi: 10.1038/nrc1299. [DOI] [PMC free article] [PubMed] [Google Scholar]
- 2.Strausberg RL, Simpson AJ, Wooster R. Sequence-based cancer genomics: progress lessons and opportunities. Nat Rev Genet. 2003;4(6):409–18. doi: 10.1038/nrg1085. [DOI] [PubMed] [Google Scholar]
- 3.Phelps MA, Sparreboom A. A snapshot of challenges and solutions in cancer drug development and therapy. Clin Pharmacol Ther. 2014;95(4):341–6. doi: 10.1038/clpt.2014.15. [DOI] [PubMed] [Google Scholar]
- 4.Begley CG, Ellis LM. Drug development: raise standards for preclinical cancer research. Nature. 2012;483(7391):531–3. doi: 10.1038/483531a. [DOI] [PubMed] [Google Scholar]
- 5.Arrell DK, Terzic A. Network systems biology for drug discovery. Clin Pharmacol Ther. 2010;88(1):120–5. doi: 10.1038/clpt.2010.91. [DOI] [PubMed] [Google Scholar]
- 6.Dudley JT, Deshpande T, Butte AJ. Exploiting drug-disease relationships for computational drug repositioning. Brief Bioinform. 2011;12(4):303–11. doi: 10.1093/bib/bbr013. [DOI] [PMC free article] [PubMed] [Google Scholar]
- 7.Piro RM, Di Cunto F. Computational approaches to disease-gene prediction: rationale, classification and successes. FEBS J. 2012;279(5):678–96. doi: 10.1111/j.1742-4658.2012.08471.x. [DOI] [PubMed] [Google Scholar]
- 8.Kohler S, Bauer S, Horn D, Robinson PN. Walking the interactome for prioritization of candidate disease genes. Am J Hum Genet. 2008;82(4):949–58. doi: 10.1016/j.ajhg.2008.02.013. [DOI] [PMC free article] [PubMed] [Google Scholar]
- 9.Chen J, Aronow BJ, Jegga AG. Disease candidate gene identification and prioritization using protein interaction networks. BMC Bioinformatics. 2009;10:73. doi: 10.1186/1471-2105-10-73. [DOI] [PMC free article] [PubMed] [Google Scholar]
- 10.Goh KI, Cusick ME, Valle D, Childs B, Vidal M, Barabasi AL. The human disease network. Proc Natl Acad Sci USA. 2007;104(21):8685–90. doi: 10.1073/pnas.0701361104. [DOI] [PMC free article] [PubMed] [Google Scholar]
- 11.Suthram S, Dudley JT, Chiang AP, Chen R, Hastie TJ, Butte AJ. Network-based elucidation of human disease similarities reveals common functional modules enriched for pluripotent drug targets. PLoS Comput Biol. 2010;6(2):e1000662. doi: 10.1371/journal.pcbi.1000662. [DOI] [PMC free article] [PubMed] [Google Scholar]
- 12.Hu G, Agarwal P. Human disease-drug network based on genomic expression profiles. PLoS One. 2009;4(8):e6536. doi: 10.1371/journal.pone.0006536. [DOI] [PMC free article] [PubMed] [Google Scholar]
- 13.Bauer-Mehren A, Bundschus M, Rautschka M, Mayer MA, Sanz F, Furlong LI. Gene-disease network analysis reveals functional modules in Mendelian, complex and environmental diseases. PLoS One. 2011;6(6):e20284. doi: 10.1371/journal.pone.0020284. [DOI] [PMC free article] [PubMed] [Google Scholar]
- 14.Daminelli S, Haupt VJ, Reimann M, Schroeder M. Drug repositioning through incomplete bi-cliques in an integrated drug-target-disease network. Integr Biol (Camb) 2012;4(7):778–88. doi: 10.1039/c2ib00154c. [DOI] [PubMed] [Google Scholar]
- 15.Milo R, Itzkovitz S, Kashtan N, et al. Superfamilies of evolved and designed networks. Science. 2004;303(5663):1538–42. doi: 10.1126/science.1089167. [DOI] [PubMed] [Google Scholar]
- 16.MEDLINE. Available at http://www.nlm.nih.gov/bsd/pmresources.html.
- 17.Rindflesch TC, Kilicoglu H, Fiszman M, Rosemblat G, Shin D. Semantic MEDLINE: an advanced information management application for biomedicine. Inf Serv Use. 2011;31(1/2):15–21. [Google Scholar]
- 18.Tao C, Zhang Y, Jiang G, Bouamrane M-M, Chute CG. Optimizing semantic MEDLINE for translational science studies using semantic web technologies; Proceedings of the 2nd International Workshop on Managing Interoperability and Complexity in Health Systems; Maui, HI, USA: ACM; 2012. pp. 53–8. [Google Scholar]
- 19.Yeger-Lotem E, Sattath S, Kashtan N, et al. Network motifs in integrated cellular networks of transcription-regulation and protein-protein interaction. Proc Natl Acad Sci USA. 2004;101(16):5934–9. doi: 10.1073/pnas.0306752101. [DOI] [PMC free article] [PubMed] [Google Scholar]
- 20.Wernicke S, Rasche F. FANMOD: a tool for fast network motif detection. Bioinformatics. 2006;22(9):1152–3. doi: 10.1093/bioinformatics/btl038. [DOI] [PubMed] [Google Scholar]
- 21.Barabasi AL, Oltvai ZN. Network biology: understanding the cell’s functional organization. Nat Rev Genet. 2004;5(2):101–3. doi: 10.1038/nrg1272. [DOI] [PubMed] [Google Scholar]
- 22.Dobrin R, Beg QK, Barabasi AL, Oltvai ZN. Aggregation of topological motifs in the Escherichia coli transcriptional regulatory network. BMC Bioinformatics. 2004;5:10. doi: 10.1186/1471-2105-5-10. [DOI] [PMC free article] [PubMed] [Google Scholar]
- 23.Tao C, Zhang Y, Jiang G, Bouamrane M, Chute C. Optimizing semantic MEDLINE for translational science studies using semantic web technologies; Proceedings of the 2nd international workshop on Managing interoperability and compleXity in health systems; pp. 53–8. [Google Scholar]
- 24.Stelzl U, Worm U, Lalowski M, et al. A human protein-protein interaction network: a resource for annotating the proteome. Cell. 2005;122(6):957–68. doi: 10.1016/j.cell.2005.08.029. [DOI] [PubMed] [Google Scholar]
- 25.Kakoki K, Kamiyama H, Izumida M, et al. Androgen-independent proliferation of LNCaP prostate cancer cells infected by xenotropic murine leukemia virus-related virus. Biochem Biophys Res Commun. 2014;447(1):216–22. doi: 10.1016/j.bbrc.2014.03.154. [DOI] [PubMed] [Google Scholar]
- 26.Zhang Y, Xuan J, de los Reyes BG, Clarke R, Ressom HW. Network motif-based identification of transcription factor-target gene relationships by integrating multi-source biological data. BMC Bioinformatics. 2008;9:203. doi: 10.1186/1471-2105-9-203. [DOI] [PMC free article] [PubMed] [Google Scholar]
- 27.Zhang Y, Xuan J, de Los Reyes BG, Clarke R, Ressom HW. Network motif-based identification of breast cancer susceptibility genes; Conference Proceedings IEEE Engineering in Medicine and Biology Society (EMBC 2008); August 20–24, 2008; Vancouver, BC, Canada: IEEE; 2008. pp. 5696–9. [DOI] [PubMed] [Google Scholar]
Associated Data
This section collects any data citations, data availability statements, or supplementary materials included in this article.
Supplementary Materials
Supplementary File 1. Associations involved in NM 7. There are 907 disease-disease associations and 2,713 disease-gene associations in in NM 7.


