

A combination of biochemical, genetic, and imaging approaches is used to show that phosphorylation and lipidation exhibit a complex interplay in sorting of GAP43. Palmitoylation tags GAP43 for global sorting by inducing piggybacking on exocytic vesicles, whereas phosphorylation locally regulates plasma membrane targeting of palmitoylated GAP43.
Abstract
Phosphorylation and lipidation provide posttranslational mechanisms that contribute to the distribution of cytosolic proteins in growing nerve cells. The growth-associated protein GAP43 is susceptible to both phosphorylation and S-palmitoylation and is enriched in the tips of extending neurites. However, how phosphorylation and lipidation interplay to mediate sorting of GAP43 is unclear. Using a combination of biochemical, genetic, and imaging approaches, we show that palmitoylation is required for membrane association and that phosphorylation at Ser-41 directs palmitoylated GAP43 to the plasma membrane. Plasma membrane association decreased the diffusion constant fourfold in neuritic shafts. Sorting to the neuritic tip required palmitoylation and active transport and was increased by phosphorylation-mediated plasma membrane interaction. Vesicle tracking revealed transient association of a fraction of GAP43 with exocytic vesicles and motion at a fast axonal transport rate. Simulations confirmed that a combination of diffusion, dynamic plasma membrane interaction and active transport of a small fraction of GAP43 suffices for efficient sorting to growth cones. Our data demonstrate a complex interplay between phosphorylation and lipidation in mediating the localization of GAP43 in neuronal cells. Palmitoylation tags GAP43 for global sorting by piggybacking on exocytic vesicles, whereas phosphorylation locally regulates protein mobility and plasma membrane targeting of palmitoylated GAP43.
INTRODUCTION
Efficient delivery of proteins to their final location is fundamental for neurons. This is in particular important for proteins operating at the tip of processes, which can be far from the cell soma. Mechanisms of polarized membrane trafficking to establish the composition of the growth cone membrane have been described (Lasiecka and Winckler, 2011). However, the molecular determinants that generate and maintain the distribution of cytosolic proteins in neurons are less well understood.
Posttranslational modifications such as phosphorylation and lipidation may tag cytosolic proteins for transport and regulate their distribution between soma and processes. Phosphorylation adds negative charge and can switch the protein conformation to affect protein–protein or protein–lipid interactions. Lipidation increases the hydrophobicity of proteins, and the lipid anchor may attach the intrinsically soluble protein to a membrane (Magee and Seabra, 2005). S-palmitoylation is the most frequently observed lipid modification of neuronal proteins. It is unique in that this lipidation is reversible (Fukata and Fukata, 2010). Thus dynamic and reversible phosphorylation and S-palmitoylation may determine the rate and direction of protein shuttling between intracellular compartments according to physiological needs.
Essentially all protein palmitoylation depends on DHHC proteins, which are polytopic membrane proteins. As a result, palmitoylation of proteins is restricted to the cytoplasmic surface of intracellular membrane compartments (Chamberlain et al., 2013), mainly at the Golgi as a super-reaction center for palmitoylation (Salaun et al., 2010). Active DHHC proteins have also been detected at post-Golgi membranes, including the plasma membrane of neuronal dendrites (Noritake et al., 2009) and recycling endosomes and the plasma membrane in PC12 cells (Greaves et al., 2011). In contrast, phosphorylation can occur in all intracellular compartments. Thus the question arises whether and how palmitoylation and phosphorylation interplay in regulating the sorting of cytosolic proteins in neurons.
Here the neuronal growth-associated protein GAP43 (also known as F1, B-50, GAP-48, 48K4.5, P-57, pp46, and neuromodulin) serves as a model protein to analyze the role of phosphorylation and lipidation in protein sorting between the soma and the growth cone of a nerve cell. GAP43 is a phosphorylated and S-palmitoylated protein and is enriched in the tips of extending neurites during nerve cell growth and regeneration (Skene, 1989). GAP43 is subject to phosphorylation by several kinases, including protein kinase C (PKC), casein kinase II, and proline-directed kinases (Apel et al., 1990, 1991; Taniguchi et al., 1994). With respect to a regulatory role, phosphorylation of GAP43 by PKC at a unique site (Ser-41) appears to be most relevant. In vivo, PKC phosphorylation of GAP43 is enhanced in the distal axon and growth cone via the βII PKC isoform, where it can be stimulated by extracellular factors, thereby coupling GAP43 phosphorylation to neuronal guidance cues (Meiri et al., 1991). Phosphorylated GAP43 appears to represent the functionally active form, since it is found in growth cones that establish stable contacts with other cells, whereas unphosphorylated GAP43 is present in retracting growth cones (Dent and Meiri, 1992). In agreement, transgenic mice overexpressing pseudophosphorylated GAP43 show enhanced sprouting, whereas animals with nonphosphorylatable GAP43 exhibit less sprouting (Aigner et al., 1995). Because the activation state of GAP43 appears to correlate with its localization, phosphorylation may directly or indirectly influence the intracellular distribution of GAP43. Indeed, phosphorylation at Ser-41 affects the association of GAP43 with the membrane skeleton (Meiri et al., 1996); however, the relevance of this interaction for regulating GAP43 trafficking remains to be shown.
The first 10 amino acids, which are encoded by exon 1, are important for membrane binding of GAP43. Within this region, Cys-3 and Cys-4 are crucial and undergo reversible, covalent addition of palmitic acid (Skene, 1989). Mutation of Cys-3 and Cys-4 prevents membrane binding (Zuber et al., 1989). GAP43 is initially synthesized as a soluble protein on free ribosomes in the cell body and becomes palmitoylated and attached to membranes posttranslationally (Skene, 1989). About 30% of GAP43 was found to travel at fast axonal transport rate in regenerating sciatic nerves in vivo (Tetzlaff et al., 1989), whereas GAP43 was found mostly to be localized at the cytosolic face of the plasma membrane in the adult pyramidal tract (Gorgels et al., 1989). Ultrastructural analysis revealed that a minor portion of GAP43 is also associated with vesicles (Verkade et al., 1996b), where it colocalizes with the synaptic vesicle marker synaptophysin (Verkade et al., 1996a). This poses the question how GAP43 gets sorted to the distal process under conditions in which only a minority is localized to vesicles.
To scrutinize the interplay of phosphorylation and lipidation in sorting of GAP43 to neuronal growth cones, we prepared a panel of photoactivatable green fluorescent protein (PAGFP)–tagged GAP43 constructs. We analyzed their distribution between plasma membrane and cytosol by microsphere separation, followed their mobility by time-lapse fluorometry, and determined retention and diffusion constants by spatially restricted photoactivation experiments. Using total internal reflection fluorescence (TIRF) microscopy, we determined association and transport of GAP43 with exocytic vesicles. Simulations were performed to determine the relative contribution of diffusion, membrane reaction, and transport for sorting to growth cones.
RESULTS
Expression of PAGFP-tagged GAP43 constructs in neuronally differentiated cells
To generate a neuronal model to allow us to determine the dynamics and distribution of wild-type and modified GAP43 in living cells, we prepared a panel of constructs in which PAGFP was fused to GAP43wt and phosphoblocking (GAP43S41A) and phosphomimicking GAP43 mutants (GAP43S41D) at Ser-41 (Figure 1A). According to Simple Modular Architecture Research Tool (SMART) analysis (Schultz et al., 1998; Letunic et al., 2012), Ser-41 is located in an IQ domain, which serves as a binding site for EF-hand proteins such as calmodulin (Rhoads and Friedberg, 1997). For comparison, we used a cytosolic reference protein (3×PAGFP) and a PAGFP construct with a farnesylation signal from c-Ha-Ras fused to the C-terminus (PAGFP-F). Note that PAGFP-F most likely becomes also palmitoylated, since the sequence, which is fused to PAGFP, also contains palmitoylatable cysteine residues (Aronheim et al., 1994). Bioinformatic analysis revealed two potential palmitoylation sites in addition to the farnesylation site (CSS-Palm 2.0; Ren et al., 2008). Thus PAGFP-F could serve as a reference protein for membrane attachment, which requires at least dual lipidation (Shahinian and Silvius, 1995). The constructs were expressed in PC12 cells, which provide a well-established model for differentiating neurons. The GAP43 fusion proteins separated at an apparent molecular weight of ∼80 kDa (Figure 1B). The retarded mobility compared with the calculated molecular weight (52.6 kDa) is in agreement with the fact that GAP43 alone separates at higher molecular weight than calculated (Benowitz et al., 1987). 3×PAGFP separated at an apparent molecular weight of ∼95 kDa, which makes it appropriate as a cytosolic control construct of similar size. PAGFP-F separated at 32 kDa, close to the calculated molecular mass. We did not observe major degradation, indicating that the constructs are stable within the cells. Endogenous GAP43 and the GAP43wt and GAP43S41A fusion proteins were detected by an antibody against GAP43 (Figure 1B, middle, arrow). The antibody did not detect GAP43S41D, suggesting that the phosphomimicking mutation abolished antibody reactivity.
FIGURE 1:

Expression of PAGFP-tagged GAP43 constructs in neuronally differentiated PC12 cells. (A) Schematic representation of the PAGFP-tagged GAP43 constructs. PAGFP with a farnesylation signal (PAGFP-F) and 3×PAGFP were prepared as reference constructs. PAGFP is indicated as a green box, the IQ domain (position 30–52 in rat GAP43) containing the phosphorylation site (Ser-41) as a red box, and the farnesylation signal, which directs lipidation of PAGFP-F, as a blue box. Right, calculated relative molecular weights. (B) Immunoblots of lysates of transfected PC12 cells expressing the respective constructs. Blots were developed using anti-GFP (left and right) and anti-GAP43 antibody (middle). GFP-tagged constructs are indicated by arrowheads, endogenous GAP43 by an arrow. The phosphomimicking GAP43 construct is not recognized by the anti-GAP43 antibody (JP91), suggesting that mutation of Ser-41 to Asp blocks binding of the antibody. Numbers to the sides of the blots indicate molecular mass standards in kilodaltons. (C) Fluorescence micrographs of PC12 cells transfected with the respective GAP43 constructs and controls. Cells were treated with NGF for 6 d. Exogenous proteins were detected using anti-GFP antibody. Note the enrichment of the GAP43 constructs in the tip of the processes. Scale bar, 50 μm.
To determine the intracellular localization of the different constructs at steady state, we performed immunocytochemical stainings from neuronally differentiated PC12 cells that had been transfected with the different constructs (Figure 1C). All constructs showed ubiquitous staining patterns, with the GAP43 constructs being clearly present in the tip. We did not observe major morphological differences between cells that expressed the different GAP43 constructs as judged by their mean process lengths 6 d after transfection (40.4 ± 1.5, 43.2 ± 2.2, and 44.4 ± 2.3 μm for GAP43wt, GAP43S41A, and GAP43S41D, respectively; mean ± SEM, n = 134–269 processes from three or four independent experiments).
Phosphorylation at Ser-41 is required for plasma membrane association of GAP43
Previous experiments using detergent-extraction protocols suggested that GAP43 associates with the membrane skeleton in a phosphorylation-dependent manner (Meiri et al., 1996). To determine a potential association of GAP43wt and phosphorylation mutants with the cell periphery in living cells, we determined the distribution of GAP43-PAGFP constructs in living transfected PC12 cells. PAGFP was activated in the whole field of view, followed by confocal laser scanning microscopy (cLSM). GAP43wt and GAP43S41D showed clear enrichment at the periphery in single focal planes (Figure 2A, left). In contrast, the phosphoblocking variant of GAP43 (GAP43S41A) was mostly present in the cytoplasm. Quantification by densitometric analysis of single z-stack images (for details see Materials and Methods) revealed that phosphorylation-mimicking GAP43 (GAP43S41D) exhibited significant higher and phosphorylation blocking GAP43 (GAP43S41A) significant lower peripheral enrichment than wild-type GAP43, consistent with the view that phosphorylation at Ser-41 is required for plasma membrane association (Figure 2A, right).
FIGURE 2:

Phosphorylation at Ser-41 is required for plasma membrane association of GAP43. (A) High-resolution images of single focal planes of living PC12 cells expressing the constructs as indicated. Photoactivation was performed in the whole field of view before imaging. Right, quantitation of peripheral enrichment by densitometric analysis of single z-stack images (for details see Materials and Methods). Mean ± SEM, n = 29–35 cells from three of four independent experiments. ***Significantly different values compared with GAP43wt. Note that GAP43S41D-PAGFP exhibits higher and GAP43S41A-PAGFP lower peripheral enrichment than wild-type GAP43-PAGFP. Arrowheads indicate examples for obvious enrichment of GAP43S41A-PAGFP at the periphery. Scale bar, 10 μm. (B) Schematic representation of the plasma membrane fractionation assay to analyze the interaction of GAP43 with the neural plasma membrane (left). Immunoblots show the distribution of PAGFP-tagged GAP43 constructs (GFP), tubulin (tub), and transferrin receptor (TFR) in the cytosolic (cyt), membrane wash (mw), and plasma membrane (pm) fractions. Note that GAP43wt is present in the cytosolic and pm fractions, whereas GAP43S41A is mainly present in the cytosol and GAP43S41D in the pm fraction. Detection of GAP43-PAGFP and endogenous GAP43 with a Ser-41 phosphorylation-specific antibody (anti-phosphoneuromodulin) indicates that phosphorylated GAP43 is mainly present in the pm fraction. (C) Image of a single focal plane of a living PC12 cell expressing PAGFP-F (top) and immunoblot showing the distribution of PAGFP-F (GFP), tubulin (tub), and transferrin receptor (TFR) in the indicated fractions. Note the high enrichment of PAGFP-F in the pm fraction. Scale bar, 10 μm. Numbers to the sides of the gel blots indicate molecular mass standards in kilodaltons (B, C). Statistical analysis was performed using Student's t test. ***, p < 0.001.
To distinguish between a direct plasma membrane association and binding to the membrane skeleton, we used a subcellular fractionation protocol based on magnetic sphere separation of surface-biotinylated cells. The procedure allows us to enrich for plasma membranes together with proteins of the associated membrane cortex (bound fraction; Figure 2B, left; Maas et al., 2000; Gauthier-Kemper et al., 2011). The bound fraction was further separated by a high-pH wash to selectively remove peripherally bound proteins (membrane wash) from a plasma membrane fraction (pm; Wiedenmann et al., 1985). As expected, a plasma membrane marker (transferrin receptor) was exclusively present in the pm fraction, whereas tubulin, which behaves under the conditions of fractionation as a cytosolic protein, was mostly present in the cytosol. A small portion of tubulin was also present in the pm fraction, which probably reflects the presence of lipid-modified tubulin, as reported earlier (Wolff, 2009; Figure 2B, right).
GAP43wt-PAGFP was present in both the pm and cytosol fractions, whereas the majority of GAP43S41D was plasma membrane–associated at the conditions of separation. In contrast, only a small amount of GAP43S41A was present in the pm fraction, which agreed well with its distribution in living cells (Figure 2A). No GAP43 was observed in the membrane wash, indicating that the presence of GAP43 in the pm fraction was due to tight lipid interaction. Thus the data suggest a requirement for Ser-41 phosphorylation for the association of GAP43 with the plasma membrane. In agreement, plasma membrane–associated GAP43wt was preferentially detected with an antibody that was specific for GAP43 phosphorylated at Ser-41 (P-GAP43; Figure 2B, middle). Phosphorylated endogenous GAP43 was also highly enriched in the pm fraction (Figure 2B, bottom), indicating that overexpression of GAP43 or presence of the PAGFP tag does not interfere with plasma membrane association of GAP43.
To confirm the use of PAGFP-F as a reference for a plasma membrane–associated protein, we also determined the distribution of PAGFP-F in living, transfected PC12 cells. PAGFP-F showed clear enrichment at the periphery in single focal planes (Figure 2C, top) and in the pm fraction after subcellular fractionation (Figure 2C, bottom), indicating preferential lipid interaction. The fact that PAGFP-F is highly enriched in the pm fraction also suggests that PAGFP-F exhibits lipid modifications in addition to farnesylation to mediate strong membrane attachment (Shahinian and Silvius, 1995).
To determine whether phosphorylation of GAP43 at Ser-41 is sufficient to induce plasma membrane association, we created a palmitoylation-deficient GAP43 construct by mutating the two cysteine residues at positions 3 and 4 to serine (GAP43C3,4S; Liu et al., 1994) and also as a combination with the two phosphomutations at Ser-41. None of the three constructs showed detectable enrichment at the cell periphery in living cells (Figure 3A, left). Quantification by densitometric analysis confirmed the absence of peripheral enrichment (Figure 3A, right), indicating an absolute requirement for palmitoylation for plasma membrane association. The fact that all palmitoylation-deficient GAP43 constructs exhibited a significant lower peripheral enrichment than the respective palmitoylatable counterparts indicates that palmitoylation alone mediates some, albeit apparently weak, association with the plasma membrane, which is increased after phosphorylation. This is also detectable in the images of the single focal plane of the respective nonphosphorylatable but palmitoylatable GAP43S41A-expressing cells (e.g., arrows in Figure 2A).
FIGURE 3:
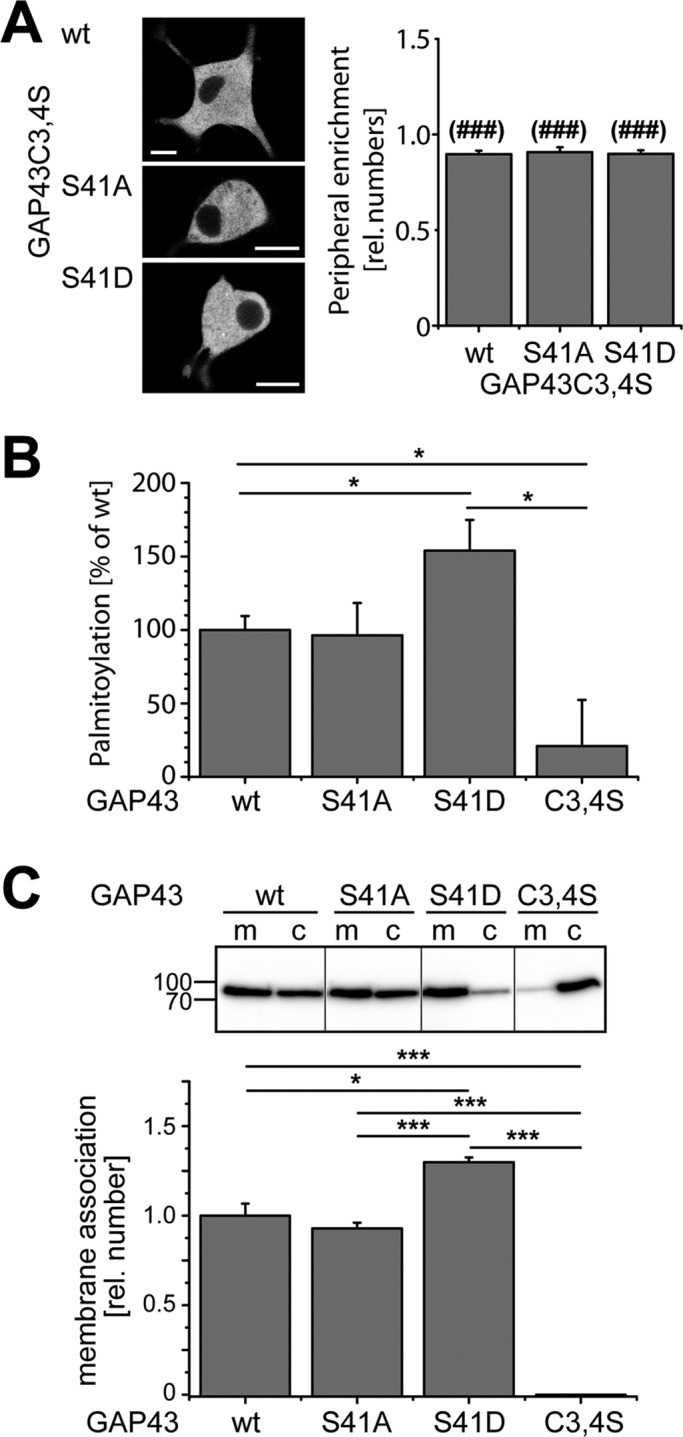
Palmitoylation of GAP43 is required for membrane association. (A) Images of single focal planes of living PC12 cells expressing different PAGFP-tagged palmitoylation-deficient constructs (GAP43C3,4S) as indicated. Photoactivation was performed in the whole field of view before imaging. Right, quantitation of peripheral enrichment by densitometric analysis of single z-stack images. Mean ± SEM, n = 13–20 cells from two independent experiments. ###Significantly different values compared with GAP43wt or the respective phosphomutants without the C3,4S mutation (Figure 2A, right). Note the complete absence of peripheral enrichment in all palmitoylation-negative mutants. Scale bar, 10 μm. (B) Quantitation of the palmitoylation state of GAP43 and the two phosphomutants by [3H]palmitate labeling. The value for GAP43wt was set as 100%. Experiments were conducted two times with three biological repetitions. Mean ± SEM, three to five independent experiments. (C) Subcellular fractionation of PC12 cells that have been lentivirally transduced to express the different PAGFP-tagged GAP43 constructs as indicated. Immunoblot showing membrane (m) and cytosolic (c) fractions (top) and the respective quantitation (bottom). Blots were developed using anti-GFP antibody. Quantitation was performed by determining the ratio of the membrane (m) to total (m + c) signal after densitometric analysis. The value for GAP43wt was set as 1.0. Mean ± SEM from three to five independent experiments. Numbers to the side of the gel blot indicate molecular mass standards in kilodaltons. Statistical analysis was performed using Student's t test. p values are as follows: *, p < 0.05 ***(###), p < 0.001.
GAP43 palmitoylation might be dynamic, being potentially subject to cycles of addition and removal (Kang et al., 2004). To address the question of whether the extent of palmitoylation is different between the constructs, we created PC12 cells that stably expressed PAGFP-tagged GAP43wt, GAP43S41A, GAP43S41D, and GAP43C3,4S by lentiviral transduction and determined the palmitoylation state by a radioactive labeling approach. As expected, GAP43C3,4S yielded only background levels, confirming that the C3,4S mutations block palmitoylation (Figure 3B). We did not detect a major difference in the extent of palmitoylation between GAP43wt and the phosphorylation-deficient GAP43S41A mutant despite our finding that GAP43S41A was much less associated with the plasma membrane.
The results could indicate that whereas palmitoylation generally mediates membrane association, phosphorylation could serve as a switch to direct palmitoylated GAP43 predominantly to the plasma membrane. To test this hypothesis, we used a subcellular fractionation protocol, which separates total membrane-associated GAP43 from the cytosolic pool. GAP43C3,4S was almost completely cytosolic, confirming that palmitoylation is required for membrane interaction (Figure 3C). Remarkably, the pattern in total membrane association closely resembled palmitoylation of GAP43wt, GAP43S41A, and GAP43S41D, confirming that general membrane association is determined by the palmitoylation level. We also observed that the phosphomimicking variant GAP43S41D exhibited a significant increase in palmitoylation, as well as membrane association. Although this could suggest that phosphorylation of Ser-41 increases membrane association via an increase in the level of palmitoylation, it could also result from the fact that palmitoylation is restricted to membranes and that therefore proteins with a long residence time at the membrane have a higher probability to be palmitoylated. It needs also to be taken into account that [3H]palmitate labeling is complex and depends on integrating rates of palmitoylation, rates of protein synthesis, rates of depalmitoylation, and rates at which the label equilibrates into cellular palmitoyl-CoA pools.
Taken together, the data suggest that phosphorylation at Ser-41 provides a switch to induce tight plasma membrane association of palmitoylated GAP43, which indicates a complex interplay between palmitoylation and phosphorylation.
Plasma membrane association decreases diffusion of GAP43 in the cell body and neuritic shaft
To determine whether plasma membrane association affects the intracellular mobility of GAP43, we performed photoactivation experiments in the cell body and in processes of neuronally differentiated cells. Photoactivation was performed by a laser flash at 405 nm in a 5-μm spot, and GFP fluorescence was followed by time-lapse imaging at an excitation wavelength of 488 nm as described previously (Weissmann et al., 2009). Photoactivated GAP43wt-PAGFP quickly dissipated within the cell and showed partial association with the periphery both in the cell body and the process, indicative for plasma membrane association of a subpopulation (Figure 4A, arrowheads). To quantitatively analyze protein mobility, we recorded fluorescence decay in activated regions in the cell body and middle of neurites over time and plotted the result. Total fluorescence did not decrease with time, confirming high photostability of PAGFP at the conditions of imaging (example shows recording in the cell body; Figure 4B). Thus fluorescence decay after photoactivation (FDAP) directly reflected differences in the mobility of the activated proteins.
FIGURE 4:

Plasma membrane association decreases diffusion of GAP43 in the cell body and neuritic shaft. (A) Time-lapse microscopy of PC12 cells transfected with GAP43wt-PAGFP after fluorescence photoactivation in the cell body (top) or in the middle of a process (bottom). The position of photoactivation is indicated by a red circle in the preactivation image (pre). Arrowheads mark regions where plasma membrane association is evident. Scale bar, 10 μm. (B) FDAP of cells expressing GAP43 constructs (top) or reference constructs (bottom) after photoactivation in the cell body. The plots represent the fraction of fluorescence measured in the activated region and total fluorescence of cells. FDAP is fastest with GAP43S41A-PAGFP and 3×PAGFP, indicating quick dissipation of the cytsosolic constructs. FDAP is slowest with GAP43S41D-PAGFP and PAGFP-F, which exhibit plasma membrane association. GAP43wt-PAGFP exhibits intermediate FDAP, reflecting partial binding to the plasma membrane. Mean ± SEM, n = 10–39. (C) Determination of diffusion constants after modeling of FDAP curves as shown in B. Diffusion in the cell body was determined only for the plasma membrane–associated proteins since the geometry of activation did not permit modeling of the dissipation of cytosolic proteins. Mean ± SEM. *,***Significantly lower values compared with the cytosolic reference protein (3×PAGFP); osignificantly lower value compared with the diffusion of the same construct in the process. Statistical analysis was performed using Student's t test. p values are as follows: *(o), p < 0.05 ***, p < 0.001.
We observed that the preferentially plasma membrane–associated phosphomimicking GAP43 mutant (GAP43S41D) showed slowest decay, whereas the mostly cytoplasmic phosphoblocking GAP43 mutant (GAP43S41A) showed fastest decay. GAP43wt displayed intermediate FDAP (Figure 4B, top). Thus the data indicate that the extent of plasma membrane association determines the mobility of GAP43 in living cells. In agreement with this hypothesis, we observed that FDAP curves for the plasma membrane–associated reference protein (PAGFP-F) were very similar to those for the plasma membrane–associated GAP43 mutant, whereas a purely cytosolic construct (3×PAGFP) distributed more like GAP43S41A (Figure 4B, bottom).
To describe quantitatively local protein mobility, we calculated diffusion constants of the different constructs. Diffusion constants were considered as effective quantities, and influences from cell compartments were not taken into account (see Materials and Methods for details). For processes, one-dimensional diffusion was assumed, which is justified by the fact that activation occurs over the full width of the process, and reflection at the tip and the sink effect of the cell body were taken into account. Diffusion constants of plasma membrane–associated proteins (PAGFP-F and GAP43S41D-PAGFP) were also calculated in the cell body, where two-dimensional diffusion could be assumed. Owing to the complex morphology of the cell soma, we refrained from calculating diffusion constants for cytoplasmic constructs in this compartment.
Diffusion constants were slightly lower for the plasma membrane–associated constructs in the cell body compared with neurites, which reached significance for PAGFP-F and might reflect minor differences in the membrane composition (Figure 4C). However, in general, the numbers fit well with previous data on the diffusion of plasma membrane–associated proteins (e.g., 0.2–0.5 μm2/s for Thy-1 in fibroblast and lymphoid cells; Jacobson et al., 1987), demonstrating that our modeling approaches were adequate. In neurites, we observed a significant decrease in the diffusion constant of the plasma membrane–associated constructs compared with the cytosolic reference protein (3×PAGFP). With respect to the effect of Ser-41 phosphorylation, we observed approximately fourfold difference in the diffusion constants of GAP43S41D versus GAP43S41A, further confirming that plasma membrane association decreases diffusion of GAP43 in living neuronal cells.
Trapping in growth cones is independent of GAP43 phosphorylation
Regulation of protein mobility by dynamic plasma membrane association may also contribute to the anchorage of proteins in specific compartments of a neuron, such as the growth cone. To test this hypothesis, we determined the retention of GAP43, the different phosphomutants, and the two reference proteins in the cell body, the process shaft, and the tip of processes using spatially restricted photoactivation experiments (Figure 5, top). Retention was quantified by determining the fraction of the fluorescent protein population in the activated segment 10 s after photoactivation (see Materials and Methods).
FIGURE 5:

Retention of GAP43 constructs differs in the cell body, the process shaft, and the tip of processes. Top, schematic representation of the position of photoactivation in neuronally differentiated PC12 cells. Bottom, fractions of fluorescence as indicator for the retention at the respective position. Note that retention correlates with the ability of the GAP43 constructs to interact with the plasma membrane except at the process tip. Mean ± SEM, n = 10–39.
The plasma membrane–associated reference protein (PAGFP-F) exhibited significantly increased retention compared with the soluble control (3×PAGFP) in all compartments (Figure 5, bottom), indicating that association with the plasma membrane generally increases retention. Accordingly, the membrane-associated GAP43 mutant (GAP43S41D) showed increased retention compared with the cytoplasmic GAP43 mutant (GAP43S41A) in the cell body and the process shaft (Figure 5, left and middle). Surprisingly, no difference between GAP43wt and the phosphomutants was observed in the tip of processes. Potential mechanisms that increase tip retention could include lipidation-induced interactions or anterograde axonal transport, which would lead to constant flow toward the end of processes.
Sorting of GAP43 to growth cones requires palmitoylation and active transport
Immunofluorescence micrographs indicated that GAP43 constructs were clearly present in the tip of growth cones (Figure 1C). To follow the kinetics of potential sorting to the tip, we performed experiments in which we photoactivated the somatic population of GAP43 constructs and followed their distribution into neurites by long-term time-lapse fluorescence microscopy (Figure 6A). Ten minutes after photoactivation, GAP43wt-PAGFP and both phosphomutants could be detected in individual growth cones. Pronounced labeling of process tips was observed after 50 min for all constructs and persisted over time (Figure 6A, arrowheads). To determine sorting efficiency quantitatively, we recorded fluorescence increase in the distal process (Figure 6B, green box) by time lapse imaging after photoactivation in the cell body (Figure 6B, red box). Plots were normalized to the maximum intensity for the respective construct (set as 1.0) and time constants (τ) were calculated.
FIGURE 6:

Sorting of GAP43 to growth cones is independent of phosphorylation but requires palmitoylation and active transport. (A) Long-term imaging of neuronally differentiated PC12 cells expressing GAP43 constructs after photoactivation of the cell body. The region of activation is indicated by a red square in the preactivation image (pre). Note that all GAP43 constructs can be detected in the tips (arrows) already 10 min after photoactivation. Scale bar, 50 μm. (B) Quantification of the kinetics of GAP43 sorting to growth cones. Increase of tip fluorescence was recorded as schematically indicated in the distal 10 μm of processes (green box) after photoactivation of the cell body (red box) from exemplary experiments as shown in B. Mean ± SEM, n = 6–16. Time constants τ (mean ± SEM) are given for the different constructs. ***Significantly different values compared with GAP43wt. Note that sorting does not differ between the phosphoblocking S41A and the phosphorylation-mimicking S41D construct. Statistical analysis was performed using Student's t test. ***, p < 0.001.
GAP43wt appeared in the tip region with a τ of 5.8 min (Figure 6B, right, top), which was ∼10 times faster than PAGFP-F (τ = 66.4 min), indicating efficient sorting of GAP43 to the growth cone. To test whether plasma membrane association of GAP43 contributes to sorting efficiency, we performed similar experiments with GAP43S41D and GAP43S41A phosphomutants. The two constructs exhibited similar time constants, indicating that sorting efficiency is not affected by the phosphorylation state of Ser-41. Note, however, that τ of the phosphomutants was slower by a factor of approximately three than the time constant of GAP43wt, suggesting that phosphorylation-mediated membrane reaction (i.e., dynamic phosphorylation-mediated plasma membrane interaction) increases sorting efficiency.
To test for a role of palmitoylation in sorting to the growth cone, we tested the palmitoylation-deficient GAP43 mutant (GAP43C3,4S). As reported previously and also shown in Figure 4A, the C3,4S mutation rendered GAP43 to be uniformly distributed in the cytosol without apparent enrichment in the periphery. GAP43C3,4S was highly mobile in the cells (note that τ is in range of seconds), closely reflecting the behavior of 3×PAGFP (Figure 6B, left, bottom), indicating pure diffusion-guided dissipation of nonpalmitoylated GAP43.
The finding that GAP43 reached process tips much faster than a plasma membrane–associated reference protein could argue for involvement of fast axonal transport. To test this hypothesis, we treated cells with the drug brefeldin A immediately before imaging. At these conditions, brefeldin A inhibits protein secretion at an early step in the secretory pathway, thus providing a tool to inhibit membrane transport (Klausner et al., 1992). In the presence of brefeldin A, the time constant for sorting of GAP43 to the tip decreased approximately ninefold to a value close to PAGFP-F as plasma membrane–associated reference protein (Figure 6B, right, bottom), indicating that fast axonal transport contributes to efficient sorting of GAP43.
Directed transport of GAP43 by transient piggybacking on exocytic vesicles
Pharmacologic inhibition of transport indicated that a fraction of GAP43 is anterogradely transported. If true, a flux of GAP43 toward the tip of the process should be observed. To test this hypothesis, we photoactivated a population of GAP43 in the middle of the process and recorded changes in the fluorescence distal to and proximal from the center of activation (Figure 7A, top). Flux should then become evident by a ratio of distal/proximal fluorescence higher than one in the majority of the processes. Indeed, we observed increased distal/proximal ratios for GAP43wt, which became significant at 25 min (Figure 7A, middle). No flux was observed with the cytosolic control protein (3×PAGFP). Treatment with brefeldin A abolished distal flux, supporting a requirement for vesicle transport in trafficking of GAP43. Distal flux was also observed with the phosphoblocking GAP43 construct (GAP43S41A), supporting that phosphorylation-mediated membrane reaction is not required for transport of GAP43 (Figure 7A, bottom, right).
FIGURE 7:

Directed transport of GAP43 by transient piggybacking on exocytic vesicles. (A) Flux analysis of photoactivated protein in processes of transfected PC12 cells. Top, schematic showing the region of photoactivation (gray box) and the position of the recording regions distal and proximal from the center of activation. Bottom, ratios of distal to proximal fluorescence at different times after activation. Mean ± SEM, n = 7–9. The percentage of processes that show higher distal than proximal fluorescence is given in the boxes. *Significantly higher values compared with 1.0. (B) TIRF image of a part of a cell body of a living PC12 cell expressing GAP43-HaloTag (labeled with HTL-OG; green) and synaptophysin-mCherry (red). The focal plane was adjusted in such a way as to visualize a region above the cellular contact site, and the nucleus is visible at the right. Note the presence of green and red structures with vesicular appearance. Note that some structures show yellow fluorescence (arrowheads) indicative of colocalization of GAP43 with vesicular structures. Scale bar, 10 μm. Bottom, time series of TIRF micrographs at the transition of a neurite shaft (n.s.) to the growth cone (g.c.). An example of a particle showing colocalization of GAP43 and synaptophysin, which can be tracked for several seconds, is shown. Scale bar, 10 μm (left), 5 μm (right). The table gives numbers for individual tracking events with colocalization of HTL-OG–labeled GAP43-HaloTag and synaptophysin-mCherry. Note that double-labeled particles move with an average speed of 1.5 ± 0.2 μm/s (n = 10), similar to the speed of fast axonal transport. Statistical analysis was performed using Student's t test. *, p < 0.05.
To visualize potential colocalization of GAP43 with moving vesicles, we prepared a GAP43 construct with a carboxy-terminal HaloTag, which allows specific and irreversible posttranslational protein labeling with synthetic ligands, yielding high fluorescence intensity (Los et al., 2008). Cells were transfected to express mCherry-tagged synaptophysin, a membrane marker of synaptic vesicles and synaptic-like microvesicles (Regnier-Vigouroux et al., 1991). As reported previously, fluorescent vesicles could be observed in the cell body, processes, and growth cone–like structures, which are likely to reflect a mixture of endocytic and exocytic vesicles (Figure 7B; Kaether et al., 2000). Mobility of GAP43- or synaptophysin-positive structures was observed, and, in some cases, costaining and comobility of vesicular structures could be detected (Figure 7B, bottom). Tracking of some individual costained structures was possible for several seconds, and distal movement occurred over distances from 3 to 6 μm (Figure 7B, right), suggesting transport of GAP43 via association with exocytic vesicles. Determination of mean velocity of the costained structures revealed an average speed of 1.5 μm/s, similar to the speed of fast axonal transport in cultured neurons (Kaether et al., 2000). The data indicate that a fraction of GAP43 exhibits fast axonal transport, presumably by transient piggybacking on exocytic vesicles.
Simulations
Our experimental data provided evidence that the distribution of GAP43 is guided by diffusion, phosphorylation-mediated plasma membrane association, and transport. To dissect the contribution of the different mechanisms in sorting of GAP43 to the growth cone, we developed a simulation based on three factors: 1) diffusion in the plasma membrane; 2) membrane reactions, that is, phosphorylation-mediated exchange between plasma membrane–bound and cytoplasmic protein; and 3) axonal transport of a fraction of the protein (Figure 8, A and B). The simulation showed that diffusion in the plasma membrane with a value that we had experimentally determined for PAGFP-F (∼0.4 μm2/s) as sole mechanism of distribution results in a high time constant for appearance in the growth cone. Such behavior is in agreement with the distribution of PAGFP-F as a plasma membrane–associated reference protein (red curve in Figure 8C and respective curve in Figure 6B). Inclusion of the occurrence of membrane reactions with a pseudoequilibrium constant similar to what we observed for GAP43wt (Kd* = 1 [50% bound]) and diffusion of the cytosolic component with a value that we had experimentally determined for 3×PAGFP resulted in the reduction of τ by a factor of approximately four (Figure 8C, dashed blue line). Addition of a transport component led to a further decrease of τ by a factor of two, resulting in kinetics similar to the behavior of GAP43wt (blue curve in Figure 8C and respective curve in Figure 6B). Remarkably, a fraction of only 10% of the molecules undergoing fast axonal transport was sufficient to simulate the experimental data for sorting of GAP43.
FIGURE 8:

Simulation of kinetic curves for sorting of proteins at different conditions. (A) Table showing the parameters used for the simulations. We used values that we experimentally determined in this study. (B) Schematic outline of the model. Technical details are given in Materials and Methods. (C) Simulated kinetic curves for sorting of the proteins at different conditions using the values given in A and the model shown in B. Note that a combination of diffusion, phosphorylation-regulated membrane reaction, and transport of a small fraction (10%) of protein with the speed of fast axonal transport suffices to simulate the experimental data for sorting of GAP43wt (blue lines in C vs. Figure 6B).
DISCUSSION
Posttranslational modifications can dramatically change the function and interactions of cytosolic proteins and are likely to contribute to protein sorting. This is of particular importance for highly polarized cells such as neurons. An instructive example is GAP43, which is synthesized on free ribosomes in the neuronal cell body, is susceptible to phosphorylation and lipidation, and becomes highly enriched in the tips of extending neurites. To scrutinize how phosphorylation and lipidation mediate sorting of GAP43, we used a combination of biochemical, genetic, and imaging approaches. Our results are summarized in Figure 9 and demonstrate a complex interplay of phosphorylation and palmitoylation in plasma membrane targeting and sorting of GAP43. In particular, we showed that 1) phosphorylation at Ser-41 directs palmitoylated GAP43 to the plasma membrane, 2) plasma membrane association decreases diffusion of GAP43 in the cell body and neuritic shaft, and 3) S-palmitoylation tags GAP43 for global sorting by inducing piggybacking on exocytic vesicles. Furthermore, we showed that plasma membrane association exhibits an absolute requirement for palmitoylation and that palmitoylation-mediated sorting to the growth cone is increased by phosphorylation-mediated membrane reaction.
FIGURE 9:

Schematic representation summarizing our results, demonstrating the interplay of phosphorylation (P) and palmitoylation (L) in plasma membrane targeting and sorting of GAP43. The data indicate that phosphorylation at Ser-41 serves as a switch to regulate local diffusion by inducing plasma membrane association of lipidated GAP43, whereas palmitoylation tags a fraction of proteins for global sorting by inducing piggybacking on exocytic vesicles.
Previous results and our data indicate an important role of lipidation in sorting of GAP43. However, it is still a matter of debate to what extent GAP43 is palmitoylated in neural cells. A previous mass spectroscopic study reported a surprisingly low stoichiometry of palmitoylation and found only ∼35% of total GAP43 being lipidated in PC12 cells (Liang et al., 2002). It should be taken into account, however, that direct analysis of palmitoylation is difficult, relating to the chemical survival of the thioester-linked acyl moiety and the potential loss of the modification during isolation due to the presence of depalmitoylases. These issues may bias detection of nonpalmitoylated versus palmitoylated GAP43 and could argue for a higher palmitoylation stoichiometry. In fact, another study did not find evidence of free cysteines in GAP43, implying high palmitoylation stoichiometry (Skene and Virag, 1989). In the same study, it was demonstrated that GAP43 in isolated growth cones could be labeled with [3H]palmitate, arguing for local palmitoylation/depalmitoylation dynamics. Thus GAP43 palmitoylation, like that of PSD-95, could be dynamic, being potentially subject to cycles of addition and removal (Kang et al., 2004). With respect to the requirement of lipidation for plasma membrane association, it has been suggested that, once initial binding has taken place, palmitate chains might not longer be needed and can be removed (Linder and Deschenes, 2003), which could explain the presence of membrane association despite a potentially low general palmitoylation level. It should be noted, however, that our fractionation experiments, which demonstrate binding of GAP43 after a high-pH wash, which is known to remove peripherally bound proteins, argue in favor of a lipid–lipid interaction of a palmitoylated protein.
Previous electron microscopic studies revealed that the majority of GAP43 is associated with the plasma membrane and that only ∼25% of GAP43 is associated with vesicles (Verkade et al., 1996b). This poses the question of how GAP43 gets sorted to the distal process under conditions in which only a minority is localized to vesicles at steady state. We showed that conditions that block vesicle transport or abolish palmitoylation prevent distal flux of GAP43, indicating vesicle-mediated transport of palmitoylated GAP43. TIRF microscopy confirmed translocation of a fraction of GAP43 with individual exocytic vesicles, probably via a piggybacking mechanism. Of interest, even the predominantly cytoplasmic phosphoblocking GAP43 construct (GAP43S41A) exhibited membrane binding and some enrichment with the periphery, suggesting that lipidation by itself induced weak plasma membrane interaction, which suffices for piggybacking. Our simulation approach revealed that a fraction of only 10% of the molecules undergoing fast axonal transport was sufficient to simulate the experimental data for sorting of GAP43 to the growth cone. Thus, even at a very low steady-state level of palmitoylation or weak plasma membrane interaction, efficient sorting to growth cones could be expected. Remarkably, transport was not dependent on Ser-41 phosphorylation but increased when phosphorylation was possible, indicating that phosphorylation-mediated exchange between a plasma membrane–bound and a cytoplasmic state increases sorting efficiency.
We showed that phosphorylation at Ser-41 is required for plasma membrane association of palmitoylated GAP43 in neuronal cells. However, how phosphorylation affects membrane association is unclear. Binding of GAP43 to the plasma membrane appears to be mediated by a combination of electrostatic interactions and lipidation. Previous results implied three basic residues (Arg-6, Arg-7, and Lys-9) to be involved in membrane interaction (Denny, 2006), and palmitoylation might help to align these residues with the membrane. GAP43 is phosphorylated by PKC at Ser-41, which is the only PKC site and is located in the IQ domain (amino acids 30–52), an extremely basic unit with α-helical secondary structure (Coggins and Zwiers, 1989). Phosphorylation at Ser-41 disrupts the structure of the IQ domain, leading to a conformational change of the protein (Trenchi et al., 2009). It has been shown that Ser-41 phosphorylation affects binding of the IQ domain to calmodulin (Chapman et al., 1991; Coggins and Zwiers, 1989) and induces release of calmodulin from GAP43, which may permit membrane association. In turn, dephosphorylation may induce calmodulin binding and subsequent release from the membrane. In addition, it has been shown that GAP43 directly binds to acidic phospholipids, including phosphoinositide (PI) lipids, by electrostatic interaction though its IQ domain, which might guide plasma membrane interaction (Houbre et al., 1991; Laux et al., 2000). However, phosphorylation of Ser-41 would be expected to weaken the membrane interaction, which is opposite to our observation and would imply that electrostatic interaction with PI lipids is not directly responsible for phosphorylation-induced plasma membrane association of GAP43. It is also possible that Ser-41 phosphorylation plays a role in regulating palmitoylation/depalmitoylation dynamics of GAP43, perhaps by blocking interaction with the putative depalmitoylase. Alternatively, phosphorylation could enhance the membrane interaction by leading to an increased palmitoylation. We did not observe a difference in the palmitoylation level of the mostly cytosolic phosphoblocking mutant (GAP43S41A) and GAP43wt, which might argue against a scenario in which phosphorylation regulates membrane interaction through changes in the palmitoylation level.
We found that plasma membrane association had a major effect on the local mobility of GAP43, as indicated by a change in the diffusion constant by a factor of four. Thus changes in the extent of phosphorylation at Ser-41 have the potential to affect local mobility of GAP43 in a temporally and spatially defined manner. It is known that PKC phosphorylates GAP43 at Ser-41 and that phosphorylation of this residue can be stimulated by chemotrophic factors and cell adhesion molecules (Meiri et al., 1991). Phosphorylated Ser-41 can then be dephosphorylated by Ca2+-independent phosphatases type 1 and 2A and by the calcium/calmodulin-dependent phosphatase calcineurin. Thus phosphorylation/dephosphorylation of GAP43 at Ser-41 could provide a physiological mechanism to regulate the mobility of GAP43 in response to extracellular cues. In turn, disturbance of the phosphorylation dynamics at Ser-41 could contribute to abnormal GAP43 localization and behavior. In fact, evidence exists that translocation of PKC is impaired during aging and in several neurodegenerative diseases (Pascale et al., 2007) and that the level of PKC is decreased by 50% in particulate (i.e., putatively membranous) fractions of Alzheimer's disease (AD) versus control brains (Cole et al., 1988). This could explain why membrane-associated GAP43 is reduced in regions of degeneration in AD patients (Martzen et al., 1993). However, whether phosphorylation-mediated mislocalization of GAP43 directly contributes to neurodegeneration or represents a side effect of disturbed phosphorylation/dephosphorylation kinetics remains to be determined.
MATERIALS AND METHODS
Materials and antibodies
Chemicals and antibodies were purchased from Sigma-Aldrich (Deisenhofen, Germany) unless stated otherwise. Cell culture media and supplements were obtained from Sigma-Aldrich and Invitrogen (Gaithersburg, MD); culture flasks, plates, and dishes from Thermo Fisher Scientific (Schwerte, Germany); and primers from Biomers (Ulm, Germany) or Thermo Fisher Scientific. Brefeldin A was purchased from AppliChem (Darmstadt, Germany), and HaloTag Oregon Green Ligand (HTL-OG) was obtained from Promega (Madison, WI). The following antibodies were used: anti-GFP (rabbit polyclonal; Millipore, Billerica, MA), anti-phosphoneuromodulin (rabbit antiserum; Upstate, Lake Placid, NY), anti-tubulin (DM1A; mouse monoclonal), and anti-TRF (mouse monoclonal; Invitrogen). In addition, a novel mouse monoclonal antibody against total GAP43 was used, which we generated using an immunological screen against proteins of the membrane skeleton (clone JP91; the antibody had been prepared as described in Piontek et al., 2002). As secondary antibodies, we used anti-rabbit Cy3- and peroxidase-conjugated anti-mouse and anti-rabbit antibodies (Jackson ImmunoResearch Laboratories, West Grove, PA).
Construction of expression vectors, transfections, and lentiviral infections
Rat GAP43 cDNA (Karns et al., 1987) was generated by reverse transcriptase (RT)-PCR using SuperScript One-Step RT-PCR Kit (Invitrogen) from RNA extracts of PC12 cells using the following primers (5′ to 3′; sense primers are listed first): atgctgtgctgtatgagaagaaccaaacag and tcaggcatgttcttggtcagcctcggg; for cloning; restriction sites for AfeI and AgeI were added using primers cttggggccagcgctatgctgtgctgtatgagaagaacc and cttcaccggaccggttcaggcatgttcttggtcagcctc. The resulting PCR product was sequentially cut with the respective enzymes (Fermentas, St. Leon-Rot, Germany) and cloned into a pRc/CMV-based pPAGFP(A206K)-N1 expression vector containing a cytomegalovirus (CMV) promoter and kanamycin and neomycin resistance genes. A206K mutation to prevent dimerization of PAGFP was included before using cctgagccaccagtccaaactgagcaaagacccc primer (Zhang et al., 2002). Mutations at Ser-41 were included via site-directed mutagenesis using gcaaccaaaattcaggctgcgttccgtggacacataacaagg for S41A and gcaaccaaaattcaggctgacttccgtggacacataacaagg for S41D. The C3,4S mutation was generated via site-directed mutagenesis using gctagcgctatgctgtcctctatgagaagaaccaaacagg primer. To construct a GAP43-HaloTag fusion, restriction sites for EcoRI and EcoRV were added using primers cagatccgctgatatcatgctgtgctgtatgag and gcagaattcaagcttatgttcttgg. The resulting PCR product was sequentially cut with the respective enzymes (Fermentas) and cloned into pSems-Halo-1-26m (Wilmes et al., 2012). To construct pPAGFP-F, we used pEGFP-F (Clontech/Takara, Shiga, Japan), which contains the 20–amino acid farnesylation signal from c-Ha-Ras fused to the C-terminus of enhanced GFP (EGFP), and exchanged the EGFP part against PAGFP from pPAGFP(A206K)×1-C1. Mouse synaptophysin-mCherry was synthesized by custom gene synthesis (Life Technologies, Darmstadt, Germany) containing restriction sites for BamHI and XbaI and cloned into pCDNA3.1(+) (Invitrogen). Lentiviral vectors were constructed in L26 FSy(1.1)GW-EGFP (Dittgen et al., 2004) by replacing the EGFP part with GAP43wt-, GAP43S41A-, GAP43S41D-, and GAP43C3,4S-PAGFP sequence. All constructs were confirmed by sequencing.
Transfections of PC12 cells were performed with Lipofectamine 2000 (Invitrogen) essentially as described previously (Gauthier-Kemper et al., 2011). For production of lentivirus, human embryonic kidney cells 293FT (Invitrogen) were transfected with the expression vector, and two helper plasmids and viral particles from the supernatant were concentrated by ultracentrifugation as described previously (Bakota et al., 2012).
Cell culture and drug treatment
PC12 cells were cultured in serum-DMEM as described previously (Gauthier-Kemper et al., 2011). Undifferentiated cells were plated on 35-mm poly-l-lysine– and collagen-coated glass-bottom culture dishes (MatTek, Ashland, MA) at 1 × 10³ cells/cm2 and cultured in DMEM with 1% (vol/vol) serum. Cells were neuronally differentiated by addition of 100 ng/ml 7S mouse nerve growth factor (mNGF; Alomone Labs, Munich, Germany) for 4–6 d, with a medium change after 2–3 d. Before imaging, the medium was exchanged against the same medium containing DMEM without phenol red. Brefeldin A was added to the culture directly before imaging at a final concentration of 5 μg/ml. For TIRF imaging, cells were plated on 24-mm PLL-PEG-RGD (VandeVondele et al., 2003)–coated glass coverslips (No. 1; VWR, Darmstadt, Germany).
Immunocytochemistry
Cells were fixed with 4% (wt/vol) formaldehyde in phosphate-buffered saline (PBS), and staining was performed essentially as described earlier (Gauthier-Kemper et al., 2011) in PBS containing 1% (wt/vol) bovine serum albumin using the respective antibodies.
Photoactivation and live-cell imaging
Imaging was performed on a Nikon laser scanning microscope (Nikon Eclipse TE2000-U inverted; Nikon, Tokyo, Japan), equipped with a C1 confocal laser scanning unit, argon (488 nm), helium/neon (543 nm), and blue diode (405 nm) lasers and EZ-C1 software essentially as described earlier (Weissmann et al., 2009). Microscope objectives used were an oil-immersion Nikon Plan Fluor 60× (numerical aperture [NA], 1.4) ultraviolet-corrected (VC) objective. The microscope was enclosed in an incubation chamber maintained at 37°C and 5% CO2 (Solent Scientific Limited, Fareham, UK). Images were collected at 256 × 256 pixels. Photoactivation was performed with the 405-nm blue diode with two scans at a pixel dwell time of 4.08 μs. Subsequent frames were obtained at a frequency of 1 frame/s (short-term imaging) or 1 frame/min (long-term imaging), and 112 frames were collected per experiment. It was verified by software tools that no pixels in the initial frames were saturated, and movies including the “preactivation image” were created in 12-bit format. For high-resolution imaging of optical slices, z-stacks of living cells were collected at 1024 × 1024 pixels with a step size of 0.5 μm immediately after whole-cell activation.
TIRF microscopy was performed using an Olympus excellence cell⊥TIRF microscope equipped with 405-, 488-, 561-, and 647-nm lasers, as well as a backilluminated electron-multiplied charge-coupled device camera (C9100-13; Hamamatsu, Hamamatsu City, Japan). A 150× (NA: 1.45; UAPON; Olympus, Tokyo, Japan) oil objective was used for TIRF excitation. The excitation beam was reflected into the objective by a quad-line dichroic beam splitter for reflection at 405, 488, 568, and 647 nm (Di01 R405/488/561/647; Semrock, Rochester, NY). The emitted light from the sample was filtered using a quad-band bandpass filter (FF01 446/523/600/677; Semrock). Image series with two colors were acquired using alternating excitation.
Image analysis
For quantification of peripheral enrichment by densitometric analysis, optical slices of living cells, which were collected after whole-cell activation, were evaluated. Slices in the middle of the z-stacks were selected and grayscale intensities in 2-μm disks determined using Fiji software (Schindelin et al., 2012). Maximal intensities from five randomly chosen positions at the periphery, the central portion, and the surrounding background, respectively, were determined per cell and averaged. The background value was subtracted and peripheral enrichment was defined as (signal periphery)/(signal center).
To determine the kinetics of tip fluorescence after activation in the cell body, we evaluated movies from long- or short-term imaging experiments. From all frames, the zero-level (“preactivation intensity”) was subtracted in order to exclude the preactivation fluorescence. Raw curves were generated by determining the fluorescence intensity in the distal 10 μm of the processes, then normalized to the corresponding saturation value by fitting it to a simple exponential recovery profile, A(1 − e−t/τ), where A denotes the saturation amplitude of the curve and τ the recovery time. Then we used A to normalize the raw curves, and we averaged all curves.
To determine the retention of photoactivated proteins, we determined It/Itot from the fluorescence intensity at time t after activation in the activated segment and the fluorescence signal from total photoactivation. This value reflects the immobile fraction of the activated population in the activated segment at time t.
Flux analysis was performed using a program developed in Matlab as described in Weissmann et al. (2009). Appearance of photoactivated protein populations was recorded in 5-μm spots 10 μm distal and 10 μm proximal from the center of activation, as shown in Figure 7A, top.
Determination of diffusion constants
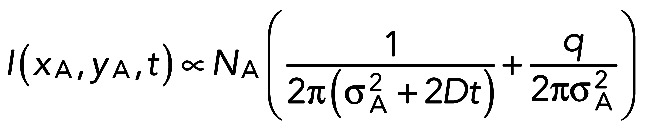
The diffusion constant, D, was evaluated by determining the decay of fluorescence after activation of PAGFP at a suitable fixed position RA by time-lapse scans. The normalized signal is called FDAP in Figure 4B, that is, the fluorescence intensity I(RA, t) divided by I(RA, t = 0), the value of the first frame after activation. If RA was located in a process, the expressions for I(t) reported in Weissmann et al. (2009) and Gauthier-Kemper et al. (2012) were applied. This approach is based on one-dimensional diffusion, which is justified because activation occurs over the full width of the process. Reflection at the tip and the sink effect at the soma transition were taken into account by the “method of images.” Diffusion constants of membrane-associated proteins PAGFP-F and GAP43S41D-PAGFP were further determined in the cell body (see table in Figure 4C), where the one-dimensional approach is clearly inadequate. In the cell body, two-dimensional diffusion was observed for these species if the activation was done in a spot near the basal plane (with coordinates x, y) and if this spot was well separated from the cell border. With ρ(x, y) being the density of the activated species in the first frame after activation at position xA, yA, analysis of the intensity initial distribution  showed that it could well be fitted by two-dimensional Gaussians:
 |
where aA characterizes the distribution width. It is well known that such an initial distribution develops by diffusion according to
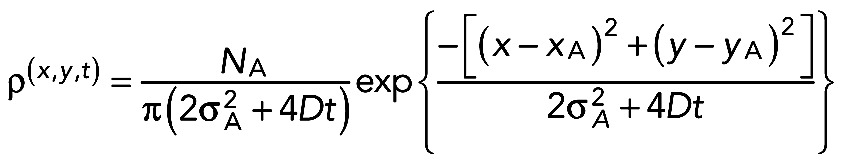 |
Here D is the diffusion constant and NA is the number of activated fluorophores. Analysis of the results showed that an immobile fraction of NA has to be taken into account. We write NA as a sum of mobile (NAm) and immobile (NAi) species and introduce the coefficient q = NAi/NAm. Hence, one finds for the decay of the intensity at the activation spot
 (1) (1)
|
This expression is the two-dimensional equivalent of Eq. 1 in Weissmann et al. (2009), without, however, the terms due to images (at xT and xB) and without the bleaching factor exp(−λt). The constant term
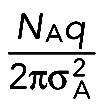 |
has been lumped together as offset o in Weissmann et al. (2009). Because σA can be found from the first frame (after activation), D can be deduced by fits to the experimentally observed decays using D and q as fit parameters. Typically, q is of the order of several 10%.
Subcellular fractionations
Separation in a total membrane and a cytosol fraction was performed essentially as described previously (Vogel et al., 2000). PC12 cells that had been lentivirally infected with the respective construct were cultured on a 10-cm cell culture dish until confluency, washed with PBS, and homogenized on ice in 0.5 ml of hypotonic buffer (10 mM Tris, 10 mM KCl, 1 mM ethylene glycol tetraacetic acid [EGTA], and 0.5 mM MgCl2, pH 7.4, containing 1 mM phenylmethylsulfonyl fluoride [PMSF], 10 μg/ml leupeptin, 10 μg/ml pepstatin, 1 mM sodium orthovanadate, 20 mM NaF, and 1 mM sodium pyrophosphate) using a Dounce stainless steel homogenizer (Wheaton, Millville, NJ). The homogenate was centrifuged for 5 min at 2000 × g to obtain a postnuclear supernatant, which was then centrifuged for 20 min at 110,000 × g. The supernatant (cytosolic) fraction was saved and the pellet (membrane) fraction resuspended in 50 μl of hypotonic buffer. Same volumes of cytosolic and membrane fraction were separated by SDS–PAGE and analyzed by immunoblot.
Microsphere separation of the plasma membrane was performed from PC12 cells based on a method that has been described previously (Maas et al., 2000). Cells that had been transiently transfected with the respective construct were cultured on a 10-cm cell culture dish, surface labeled with sulfosuccinimidyl-2-(biotinamido)ethyl-1,3-dithiopropionate (Pierce, Thermo Scientific, Rockford, IL), and incubated with streptavidin-coated microspheres. Cellular homogenates were prepared by freeze-thawing the scraped-off cells in a separation buffer (0.25 M sucrose containing 1 mM ATP, 1 mM MgCl2, 1 mM EGTA, 1 mM PMSF, 10 μg/ml leupeptin, 10 μg/ml pepstatin, 1 mM sodium orthovanadate, 20 mM NaF, and 1 mM sodium pyrophosphate), and the plasma membrane/membrane cortex fraction was separated with a magnetic bead attractor. The unbound material was separated by ultracentrifugation into an organelle/membrane pellet and a cytosol fraction. The organelle/membrane pellet was homogenized (five strokes) in 100 mM sodium carbonate buffer, pH 11.5, to remove peripherally bound proteins (Wiedenmann et al., 1985). After incubation for 30 min on ice, the membrane pellet was collected by centrifugation for 1 h at 190,000 × g and washed in PBS. The final pellet was resuspended in a small volume of 0.25 M sucrose–containing protease inhibitors. Cytosolic fractions were precipitated with trichloroacetic acid/Na-deoxycholate (Bensadoun and Weinstein, 1976).
Palmitoylation analysis of GAP43
PC12 cells that were transduced with lentivirus expressing different GAP43-PAGFP variants were incubated with 400 μCi/ml [3H]palmitate in 600 μl of medium for 2 h or 160 μCi/sample (PerkinElmer, Waltham, MA) for 4 h. Cells were then washed three times with the medium to remove unincorporated palmitate. Cells were scraped and lysed with RIPA buffer for 15 min on ice and centrifuged at 16,000 rpm for 30 min to remove cell debris. Cleared-up lysates were subjected to immunoprecipitation with GFP traps (ChromoTek, Martinsried, Germany) for 4 h at 4°C. GFP traps were washed four times with RIPA buffer. Amount of incorporated palmitate into GAP43 variants was measured using a Berthold scintillation counter. Results were similar for both incubation conditions and combined for presentation and statistical analysis.
Modeling
Problem formulation.
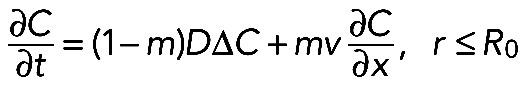
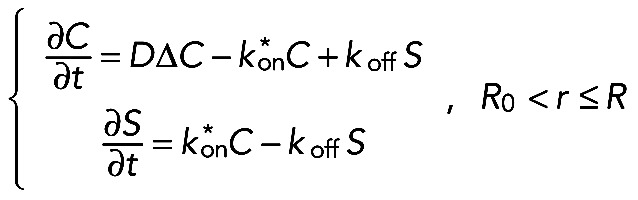
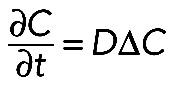
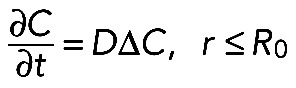
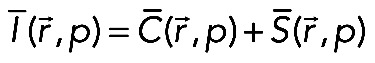
We outlined first the general equations underlying fluorescence recovery at a cellular tip. In a three-dimensional space with the cylindrical coordinate system, we introduced two cylindrical surfaces with the radii R and R0, relating as R > R0 and R/R0 ≈ 1 (see Figure 8B). We assumed a cellular process to be a two-part half-infinite cylinder bounded by the bigger surface from the outer side and separated into two parts by the smaller one. We considered molecules that diffuse with diffusion constant D inside the cylinder and bind to immobile binding sites within the outer part of the cylinder (“reaction layer,” R0 < r ≤ R) with association and dissociation rates kon and koff, respectively. In the inner part of the cylinder (“cytosol,”r ≤ R0), the molecules do not undergo any reactions but are partly transported toward the cellular tip at a fraction m < 1 and with an average velocity v. Here C(r→,t) and S(r→,t) are the concentrations of free and bound molecules, respectively. If the nonactivated system is at equilibrium and the number of binding sites for the molecules is not affected by photoactivation, the resulting transport-reaction-diffusion system appears as follows:
 (2) (2)
|
 (3) (3)
|
where  , Beq is the equilibrium concentration of free binding sites, and D is the 3D Laplacian operator. Boundary conditions were chosen in such a way that there is no flux of proteins through the outer membrane, as well as through the closed end of the process. Another important requirement was the matching condition on the surface separating the “reaction” and “cytosolic” layers. This demanded that the concentration of free molecules
 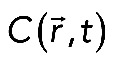 be continuous everywhere on the surface r = R0 together with its first derivative. The last requirement consisted in the finiteness of the solution at the point r = 0. Finally, the boundary and matching conditions were mathematically expressed as
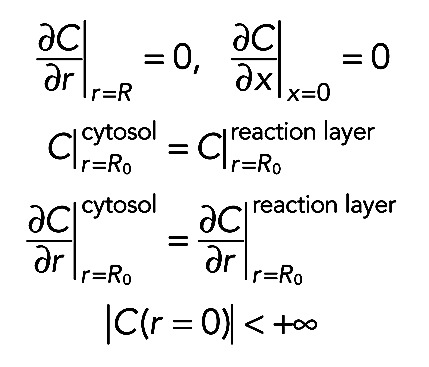 (4) (4)
|
Because the fluorescence recovery at the tip of the process had to be analyzed, it was necessary to define the tip and the corresponding activation region. In our case we introduced a cross section {x = L}, which was supposed to serve as a boundary between the tip and the activation region (AR).
Initial conditions represented the distribution of activated proteins over the process at the initial time point, t = 0. At this time point, it was assumed that all the activated proteins are kept out of the tip. Hence, the initial conditions are given by
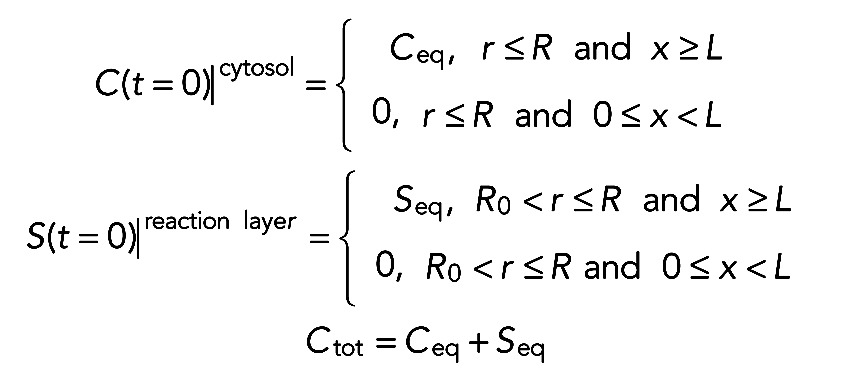 (5) (5)
|
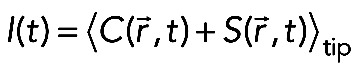
where Ceq is the equilibrium concentration of the activated proteins within the process, Seq is the equilibrium concentration of the bound proteins within the reaction layer, and Ctot is the total concentration of the activated proteins. The last step in the problem formulation was to define the fluorescence recovery at the tip. To do this, we used the fact that the intensity observed in the LSM system was proportional to the concentration of visible proteins averaged over the cellular tip. This resulted in the following expression for unitless normalized intensity:
 (6) (6)
|
where the angle brackets denote the spatial averaging over the tip and normalization of the intensity to the 0–1 range.
Simplified systems.
The full model (Eqs. 2 and 3) described possible behavior of a protein diffusing in a strongly heterogeneous medium where the protein, depending on the location in the process, was either partly transported or underwent a reversible single-binding reaction with an immobile substrate. However, simplified scenarios could be considered. The first simplification arises if we assume all the proteins to be neither transported nor reacting. Under these circumstances, we can set the fraction of transported proteins in Eq. 2, m, equal to zero. Binding in Eq. 3 can be ignored in the same way, and the system of Eqs. 2 and 3 reduces to the diffusion equation
 (7) (7)
|
Thus, in the case when both the binding and transport are negligible, the fluorescence recovery at the tip can be determined only by two parameters, namely, the diffusion constant D and the tip length L. The second simplification arises when only the fraction of transported proteins m is negligible but the reaction plays a considerable role in trapping the proteins within the reaction layer. Hence, the system of Eqs. 2 and 3 changes to
 (8) (8)
|
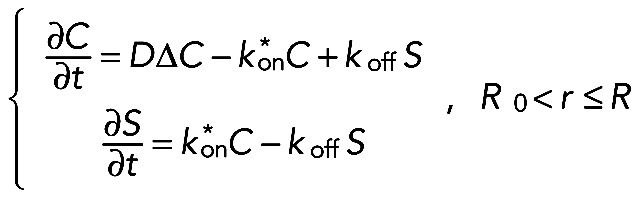 (9) (9)
|
The choice of the foregoing simplified cases was not accidental but was believed to describe the behavior of two control constructs: 3×PAGFP and PAGFP-F. Whereas 3×PAGFP displayed fully cytosolic distribution and acted most likely as a freely diffusing protein, PAGFP-F was mostly located at the membrane, suggesting a strong interaction with it. Thus the simplified cases could characterize the dynamics of the control constructs.
Analysis of the transport-reaction-diffusion equations
The transport-reaction-diffusion equations were analyzed in order to obtain analytical solutions for I(t). The solutions for the simplified cases have been found in closed form using the Laplace transform method, 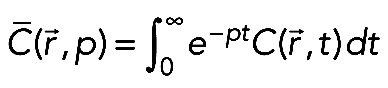 , taken from the whole system of equations. The analytical solution for the full system could be found only up to the point where the inverse Laplace transform had to be calculated. The numerical algorithm (Valsa and Brancˇik, 1998) was therefore used to compute the inverse Laplace transform. Because the fluorescence recovery at the tip was the sum of free and bound fluorescence averaged over the tip, we first had to compute the Laplace transform for this sum:
 (10) (10)
|
where p is the Laplace variable (the inverse time). Then we performed the averaging over the tip region by calculating the following integral:
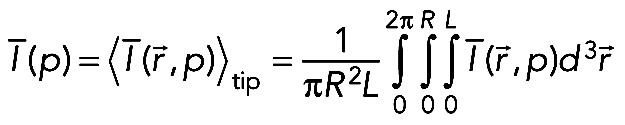 (11) (11)
|
The final expression for I(t) was obtained either via the inverse Laplace integral or by applying the aforementioned numerical algorithm.
Other methods
SDS–PAGE and immunoblot analysis were performed as described previously (Leschik et al., 2007). Statistical evaluation was performed using two-tailed, unpaired Student's t test to compare two means and one-sample Student's t test to compare the mean with a hypothetical value. Data are shown as mean ±SEM. p values for all analysis are set as follows: *(o)p < 0.05, **p < 0.01, and ***p < 0.001.
Acknowledgments
We thank Amrei Jänicke, Nina Jödden, and Ira Strübing for help with immunofluorescence microscopy and morphometric evaluation, Benedikt Niewidok for help with cloning, and Vanessa Herkenhoff for technical assistance. We also thank Michael Kemper for helpful suggestions on the manuscript. W.J. holds a Niedersachsen-Professur, awarded by the state of Lower Saxony. This work was supported by a fellowship of the Graduate College 612 of the Deutsche Forschungsgemeinschaft (A.G.) and by Deutsche Forschungsgemeinschaft Grant SFB944, Z-project.
Abbreviations used:
- AD
Alzheimer's disease
- FDAP
fluorescence decay after photoactivation
- GAP43
growth-associated protein 43
- PAGFP
photoactivatable green fluorescent protein
- PKC
protein kinase C
- TIRF
total internal reflection fluorescence
Footnotes
This article was published online ahead of print in MBoC in Press (http://www .molbiolcell.org/cgi/doi/10.1091/mbc.E13-12-0737) on August 27, 2014.
REFERENCES
- Aigner L, Arber S, Kapfhammer JP, Laux T, Schneider C, Botteri F, Brenner HR, Caroni P. Overexpression of the neural growth-associated protein GAP-43 induces nerve sprouting in the adult nervous system of transgenic mice. Cell. 1995;83:269–278. doi: 10.1016/0092-8674(95)90168-x. [DOI] [PubMed] [Google Scholar]
- Apel ED, Byford MF, Au D, Walsh KA, Storm DR. Identification of the protein kinase C phosphorylation site in neuromodulin. Biochemistry. 1990;29:2330–2335. doi: 10.1021/bi00461a017. [DOI] [PubMed] [Google Scholar]
- Apel ED, Litchfield DW, Clark RH, Krebs EG, Storm DR. Phosphorylation of neuromodulin (GAP-43) by casein kinase II. Identification of phosphorylation sites and regulation by calmodulin. J Biol Chem. 1991;266:10544–10551. [PubMed] [Google Scholar]
- Aronheim A, Engelberg D, Li N, al-Alawi N, Schlessinger J, Karin M. Membrane targeting of the nucleotide exchange factor Sos is sufficient for activating the Ras signaling pathway. Cell. 1994;78:949–961. doi: 10.1016/0092-8674(94)90271-2. [DOI] [PubMed] [Google Scholar]
- Bakota L, Brandt R, Heinisch JJ. Triple mammalian/yeast/bacterial shuttle vectors for single and combined Lentivirus- and Sindbis virus-mediated infections of neurons. Mol Genet Genomics. 2012;287:313–324. doi: 10.1007/s00438-012-0680-1. [DOI] [PubMed] [Google Scholar]
- Benowitz LI, Perrone-Bizzozero NI, Finklestein SP. Molecular properties of the growth-associated protein GAP-43 (B-50) J Neurochem. 1987;48:1640–1647. doi: 10.1111/j.1471-4159.1987.tb05713.x. [DOI] [PubMed] [Google Scholar]
- Bensadoun A, Weinstein D. Assay of proteins in the presence of interfering materials. Anal Biochem. 1976;70:241–250. doi: 10.1016/s0003-2697(76)80064-4. [DOI] [PubMed] [Google Scholar]
- Chamberlain LH, Lemonidis K, Sanchez-Perez M, Werno MW, Gorleku OA, Greaves J. Palmitoylation and the trafficking of peripheral membrane proteins. Biochem Soc Trans. 2013;41:62–66. doi: 10.1042/BST20120243. [DOI] [PubMed] [Google Scholar]
- Chapman ER, Au D, Alexander KA, Nicolson TA, Storm DR. Characterization of the calmodulin binding domain of neuromodulin. Functional significance of serine 41 and phenylalanine 42. J Biol Chem. 1991;266:207–213. [PubMed] [Google Scholar]
- Coggins PJ, Zwiers H. Evidence for a single protein kinase C-mediated phosphorylation site in rat brain protein B-50. J Neurochem. 1989;53:1895–1901. doi: 10.1111/j.1471-4159.1989.tb09259.x. [DOI] [PubMed] [Google Scholar]
- Cole G, Dobkins KR, Hansen LA, Terry RD, Saitoh T. Decreased levels of protein kinase C in Alzheimer brain. Brain Res. 1988;452:165–174. doi: 10.1016/0006-8993(88)90021-2. [DOI] [PubMed] [Google Scholar]
- Denny JB. Molecular mechanisms, biological actions, and neuropharmacology of the growth-associated protein GAP-43. Curr Neuropharmacol. 2006;4:293–304. doi: 10.2174/157015906778520782. [DOI] [PMC free article] [PubMed] [Google Scholar]
- Dent EW, Meiri KF. GAP-43 phosphorylation is dynamically regulated in individual growth cones. J Neurobiol. 1992;28:1037–1053. doi: 10.1002/neu.480230809. [DOI] [PubMed] [Google Scholar]
- Dittgen T, Nimmerjahn A, Komai S, Licznerski P, Waters J, Margrie TW, Helmchen F, Denk W, Brecht M, Osten P. Lentivirus-based genetic manipulations of cortical neurons and their optical and electrophysiological monitoring in vivo. Proc Natl Acad Sci USA. 2004;101:18206–18211. doi: 10.1073/pnas.0407976101. [DOI] [PMC free article] [PubMed] [Google Scholar]
- Fukata Y, Fukata M. Protein palmitoylation in neuronal development and synaptic plasticity. Nat Rev Neurosci. 2010;11:161–175. doi: 10.1038/nrn2788. [DOI] [PubMed] [Google Scholar]
- Gauthier-Kemper A, Weissmann C, Golovyashkina N, Sebö-Lemke Z, Drewes G, Gerke V, Heinisch JJ, Brandt R. The frontotemporal dementia mutation R406W blocks tau's interaction with the membrane in an annexin A2-dependent manner. J Cell Biol. 2011;192:647–661. doi: 10.1083/jcb.201007161. [DOI] [PMC free article] [PubMed] [Google Scholar]
- Gauthier-Kemper A, Weissmann C, Reyher HJ, Brandt R. Monitoring cytoskeletal dynamics in living neurons using fluorescence photoactivation. Methods Enzymol. 2012;505:3–21. doi: 10.1016/B978-0-12-388448-0.00009-7. [DOI] [PubMed] [Google Scholar]
- Gorgels TG, Van Lookeren Campagne M, Oestreicher AB, Gribnau AA, Gispen WH. B-50/GAP43 is localized at the cytoplasmic side of the plasma membrane in developing and adult rat pyramidal tract. J Neurosci. 1989;9:3861–3869. doi: 10.1523/JNEUROSCI.09-11-03861.1989. [DOI] [PMC free article] [PubMed] [Google Scholar]
- Greaves J, Carmichael JA, Chamberlain LH. The palmitoyl transferase DHHC2 targets a dynamic membrane cycling pathway: regulation by a C-terminal domain. Mol Biol Cell. 2011;22:1887–1895. doi: 10.1091/mbc.E10-11-0924. [DOI] [PMC free article] [PubMed] [Google Scholar]
- Houbre D, Duportail G, Deloulme JC, Baudier J. The interactions of the brain-specific calmodulin-binding protein kinase C substrate, neuromodulin (GAP 43), with membrane phospholipids. J Biol Chem. 1991;266:7121–7131. [PubMed] [Google Scholar]
- Jacobson K, Ishihara A, Inman R. Lateral diffusion of proteins in membranes. Annu Rev Physiol. 1987;49:163–175. doi: 10.1146/annurev.ph.49.030187.001115. [DOI] [PubMed] [Google Scholar]
- Kaether C, Skehel P, Dotti CG. Axonal membrane proteins are transported in distinct carriers: a two-color video microscopy study in cultured hippocampal neurons. Mol Biol Cell. 2000;11:1213–1224. doi: 10.1091/mbc.11.4.1213. [DOI] [PMC free article] [PubMed] [Google Scholar]
- Kang R, Swayze R, Lise MF, Gerrow K, Mullard A, Honer WG, El-Husseini A. Presynaptic trafficking of synaptotagmin I is regulated by protein palmitoylation. J Biol Chem. 2004;279:50524–50536. doi: 10.1074/jbc.M404981200. [DOI] [PubMed] [Google Scholar]
- Karns LR, Ng SC, Freeman JA, Fishman MC. Cloning of complementary DNA for GAP-43, a neuronal growth-related protein. Science. 1987;236:597–600. doi: 10.1126/science.2437653. [DOI] [PubMed] [Google Scholar]
- Klausner RD, Donaldson JG, Lippincott-Schwartz J. Brefeldin A: insights into the control of membrane traffic and organelle structure. J Cell Biol. 1992;116:1071–1080. doi: 10.1083/jcb.116.5.1071. [DOI] [PMC free article] [PubMed] [Google Scholar]
- Lasiecka ZM, Winckler B. Mechanisms of polarized membrane trafficking in neurons—focusing in on endosomes. Mol Cell Neurosci. 2011;48:278–287. doi: 10.1016/j.mcn.2011.06.013. [DOI] [PMC free article] [PubMed] [Google Scholar]
- Laux T, Fukami K, Thelen M, Golub T, Frey D, Caroni P. GAP43, MARCKS, and CAP23 modulate PI(4,5)P(2) at plasmalemmal rafts, and regulate cell cortex actin dynamics through a common mechanism. J Cell Biol. 2000;149:1455–1472. doi: 10.1083/jcb.149.7.1455. [DOI] [PMC free article] [PubMed] [Google Scholar]
- Leschik J, Welzel A, Weissmann C, Eckert A, Brandt R. Inverse and distinct modulation of tau-dependent neurodegeneration by presenilin 1 and amyloid-beta in cultured cortical neurons: evidence that tau phosphorylation is the limiting factor in amyloid-beta-induced cell death. J Neurochem. 2007;101:1303–1315. doi: 10.1111/j.1471-4159.2006.04435.x. [DOI] [PubMed] [Google Scholar]
- Letunic I, Doerks T, Bork P. SMART 7: recent updates to the protein domain annotation resource. Nucleic Acids Res. 2012;40:D302–305. doi: 10.1093/nar/gkr931. [DOI] [PMC free article] [PubMed] [Google Scholar]
- Liang XYL, Neubert TA, Resh MD. Mass spectrometric analysis of GAP-43/neuromodulin reveals the presence of a variety of fatty acylated species. J Biol Chem. 2002;277:33032–33040. doi: 10.1074/jbc.M204607200. [DOI] [PubMed] [Google Scholar]
- Linder ME, Deschenes RJ. New insights into the mechanisms of protein palmitoylation. Biochemistry. 2003;42:4311–4320. doi: 10.1021/bi034159a. [DOI] [PubMed] [Google Scholar]
- Liu Y, Fisher DA, Storm DR. Intracellular sorting of neuromodulin (GAP-43) mutants modified in the membrane targeting domain. J Neurosci. 1994;14:5807–5817. doi: 10.1523/JNEUROSCI.14-10-05807.1994. [DOI] [PMC free article] [PubMed] [Google Scholar]
- Los GV, Encell LP, McDougall MG, Hartzell DD, Karassina N, Zimprich C, Wood MG, Learish R, Ohana RF, Urh M, et al. HaloTag: a novel protein labeling technology for cell imaging and protein analysis. ACS Chem Biol. 2008;3:373–382. doi: 10.1021/cb800025k. [DOI] [PubMed] [Google Scholar]
- Maas T, Eidenmuller J, Brandt R. Interaction of tau with the neural membrane cortex is regulated by phosphorylation at sites that are modified in paired helical filaments. J Biol Chem. 2000;275:15733–15740. doi: 10.1074/jbc.M000389200. [DOI] [PubMed] [Google Scholar]
- Magee T, Seabra MC. Fatty acylation and prenylation of proteins: what's hot in fat. Curr Opin Cell Biol. 2005;17:190–196. doi: 10.1016/j.ceb.2005.02.003. [DOI] [PubMed] [Google Scholar]
- Martzen MR, Nagy A, Coleman PD, Zwiers H. Altered phosphorylation of growth-associated protein B50/GAP-43 in Alzheimer disease with high neurofibrillary tangle density. Proc Natl Acad Sci USA. 1993;90:11187–11191. doi: 10.1073/pnas.90.23.11187. [DOI] [PMC free article] [PubMed] [Google Scholar]
- Meiri KF, Bickerstaff LE, Schwob JE. Monoclonal antibodies show that kinase C phosphorylation of GAP-43 during axonogenesis is both spatially and temporally restricted in vivo. J Cell Biol. 1991;112:991–1005. doi: 10.1083/jcb.112.5.991. [DOI] [PMC free article] [PubMed] [Google Scholar]
- Meiri KF, Hammang JP, Dent EW, Baetge EE. Mutagenesis of ser41 to ala inhibits the association of GAP-43 with the membrane skeleton of GAP-43-deficient PC12B cells: effects on cell adhesion and the composition of neurite cytoskeleton and membrane. J Neurobiol. 1996;29:213–232. doi: 10.1002/(SICI)1097-4695(199602)29:2<213::AID-NEU7>3.0.CO;2-D. [DOI] [PubMed] [Google Scholar]
- Noritake J, Fukata Y, Iwanaga T, Hosomi N, Tsutsumi R, Matsuda N, Tani H, Iwanari H, Mochizuki Y, Kodama T, et al. Mobile DHHC palmitoylating enzyme mediates activity-sensitive synaptic targeting of PSD-95. J Cell Biol. 2009;186:147–160. doi: 10.1083/jcb.200903101. [DOI] [PMC free article] [PubMed] [Google Scholar]
- Pascale A, Amadio M, Govoni S, Battaini F. The aging brain, a key target for the future: the protein kinase C involvement. Pharmacol Res. 2007;55:560–569. doi: 10.1016/j.phrs.2007.04.013. [DOI] [PubMed] [Google Scholar]
- Piontek J, Régnier-Vigouroux A, Brandt R. Contact with astroglial membranes induces axonal and dendritic growth of human CNS model neurons and affects the distribution of the growth-associated proteins MAP1B and GAP43. J Neurosci Res. 2002;67:471–483. doi: 10.1002/jnr.10094. [DOI] [PubMed] [Google Scholar]
- Regnier-Vigouroux A, Tooze SA, Huttner WB. Newly synthesized synaptophysin is transported to synaptic-like microvesicles via constitutive secretory vesicles and the plasma membrane. EMBO J. 1991;10:3589–3601. doi: 10.1002/j.1460-2075.1991.tb04925.x. [DOI] [PMC free article] [PubMed] [Google Scholar]
- Ren J, Wen L, Gao X, Jin C, Xue Y, Yao X. CSS-Palm 2.0: an updated software for palmitoylation sites prediction. Protein Eng Des Sel. 2008;21:639–644. doi: 10.1093/protein/gzn039. [DOI] [PMC free article] [PubMed] [Google Scholar]
- Rhoads AR, Friedberg F. Sequence motifs for calmodulin recognition. FASEB J. 1997;11:331–340. doi: 10.1096/fasebj.11.5.9141499. [DOI] [PubMed] [Google Scholar]
- Salaun C, Greaves J, Chamberlain LH. The intracellular dynamic of protein palmitoylation. J Cell Biol. 2010;191:1229–1238. doi: 10.1083/jcb.201008160. [DOI] [PMC free article] [PubMed] [Google Scholar]
- Schindelin J, Arganda-Carreras I, Frise E, Kaynig V, Longair M, Pietzsch T, Preibisch S, Rueden C, Saalfeld S, Schmid B, et al. Fiji: an open-source platform for biological-image analysis. Nat Methods. 2012;9:676–682. doi: 10.1038/nmeth.2019. [DOI] [PMC free article] [PubMed] [Google Scholar]
- Schultz J, Milpetz F, Bork P, Ponting CP. SMART, a simple modular architecture research tool: identification of signaling domains. Proc Natl Acad Sci USA. 1998;95:5857–5864. doi: 10.1073/pnas.95.11.5857. [DOI] [PMC free article] [PubMed] [Google Scholar]
- Shahinian S, Silvius JR. Doubly-lipid-modified protein sequence motifs exhibit long-lived anchorage to lipid bilayer membranes. Biochemistry. 1995;34:3813–3822. doi: 10.1021/bi00011a039. [DOI] [PubMed] [Google Scholar]
- Skene J. Axonal growth-associated proteins. Annu Rev Neurosci. 1989;12:127–156. doi: 10.1146/annurev.ne.12.030189.001015. [DOI] [PubMed] [Google Scholar]
- Skene JH, Virag I. Posttranslational membrane attachment and dynamic fatty acylation of a neuronal growth cone protein, GAP-43. J Cell Biol. 1989;108:613–624. doi: 10.1083/jcb.108.2.613. [DOI] [PMC free article] [PubMed] [Google Scholar]
- Taniguchi H, Suzuki M, Manenti S, Titani K. A mass spectrometric study on the in vivo posttranslational modification of GAP-43. J Biol Chem. 1994;269:22481–22484. [PubMed] [Google Scholar]
- Tetzlaff W, Zwiers H, Lederis K, Cassar L, Bisby MA. Axonal transport and localization of B-50/GAP-43-like immunoreactivity in regenerating sciatic and facial nerves of the rat. J Neurosci. 1989;9:1303–1313. doi: 10.1523/JNEUROSCI.09-04-01303.1989. [DOI] [PMC free article] [PubMed] [Google Scholar]
- Trenchi A, Gomez GA, Daniotti JL. Dual acylation is required for trafficking of growth-associated protein-43 (GAP-43) to endosomal recycling compartment via an Arf6-associated endocytic vesicular pathway. Biochem J. 2009;421:357–369. doi: 10.1042/BJ20090484. [DOI] [PubMed] [Google Scholar]
- Valsa J, Brančik L. Approximate formulae for numerical inversion of Laplace transforms. Int J Numer Model. 1998;11:153–166. [Google Scholar]
- VandeVondele S, Voros J, Hubbell JA. RGD-grafted poly-L-lysine-graft-(polyethylene glycol) copolymers block non-specific protein adsorption while promoting cell adhesion. Biotechnol Bioeng. 2003;82:784–790. doi: 10.1002/bit.10625. [DOI] [PubMed] [Google Scholar]
- Verkade P, Verkleij AJ, Annaert WG, Gispen WH, Oestreicher AB. Ultrastructural localization of B-50/growth-associated protein-43 to anterogradely transported synaptophysin-positive and calcitonin gene-related peptide-negative vesicles in the regenerating rat sciatic nerve. Neuroscience. 1996a;71:489–505. doi: 10.1016/0306-4522(95)00463-7. [DOI] [PubMed] [Google Scholar]
- Verkade P, Verkleij AJ, Gispen WH, Oestreicher AB. Ultrastructural evidence for the lack of co-transport of B-50/GAP-43 and calmodulin in myelinated axons of the regenerating rat sciatic nerve. J Neurocytol. 1996b;25:583–595. doi: 10.1007/BF02284826. [DOI] [PubMed] [Google Scholar]
- Vogel K, Cabaniols JP, Roche PA. Targeting of SNAP-25 to membranes is mediated by its association with the target SNARE syntaxin. J Biol Chem. 2000;275:2959–2965. doi: 10.1074/jbc.275.4.2959. [DOI] [PubMed] [Google Scholar]
- Weissmann C, Reyher HJ, Gauthier A, Steinhoff HJ, Junge W, Brandt R. Microtubule binding and trapping at the tip of neurites regulate tau motion in living neurons. Traffic. 2009;10:1655–1668. doi: 10.1111/j.1600-0854.2009.00977.x. [DOI] [PubMed] [Google Scholar]
- Wiedenmann B, Lawley K, Grund C, Branton D. Solubilization of proteins from bovine brain coated vesicles by protein perturbants and Triton X-100. J Cell Biol. 1985;101:12–18. doi: 10.1083/jcb.101.1.12. [DOI] [PMC free article] [PubMed] [Google Scholar]
- Wilmes S, Staufenbiel M, Lisse D, Richter CP, Beutel O, Busch KB, Hess ST, Piehler J. Triple-color super-resolution imaging of live cells: resolving submicroscopic receptor organization in the plasma membrane. Angew Chem Int Ed Engl. 2012;51:4868–4871. doi: 10.1002/anie.201200853. [DOI] [PubMed] [Google Scholar]
- Wolff J. Plasma membrane tubulin. Biochim Biophys Acta. 2009;1788:1415–1433. doi: 10.1016/j.bbamem.2009.03.013. [DOI] [PubMed] [Google Scholar]
- Zhang J, Campbell RE, Ting AY, Tsien RY. Creating new fluorescent probes for cell biology. Nat Rev Mol Cell Biol. 2002;3:906–918. doi: 10.1038/nrm976. [DOI] [PubMed] [Google Scholar]
- Zuber MX, Strittmatter SM, Fishman MC. A membrane-targeting signal in the amino terminus of the neuronal protein GAP-43. Nature. 1989;341:345–348. doi: 10.1038/341345a0. [DOI] [PubMed] [Google Scholar]