

Abstract
A detailed study of hypertonically stimulated Na-K-2Cl cotransport (NKCC1) in Xenopus laevis oocytes was carried out to better understand the 1 K+:1 Cl− stoichiometry of transport that was previously observed. In this study, we derived the velocity equations for K+ influx under both rapid equilibrium assumptions and combined equilibrium and steady-state assumptions and demonstrate that the behavior of the equations and curves in Lineweaver-Burke plots are consistent with a model where Cl− binds first, followed by Na+, a second Cl−, and then K+. We further demonstrate that stimulation of K+ movement by K+ on the trans side is an intrinsic property of a carrier that transports multiple substrates. We also demonstrate that K+ movement through NKCC1 is strictly dependent upon the presence of external Na+, even though only a fraction of Na+ is in fact transported. Finally, we propose that the larger transport of K+, as compared with Na+, is a result of the return of partially unloaded carriers, which masks the net 1Na+:1K+:2Cl− stoichiometry of NKCC1. These data have profound implications for the physiology of Na-K-2Cl cotransport, since transport of K-Cl in some conditions seems to be uncoupled from the transport of Na-Cl.
Keywords: rapid equilibrium, steady state, transport velocity, unidirectional ion fluxes
cells from many aquatic species experience frequent changes in the osmolarity of their environment. This is particularly true for osmoconformers, organisms with their internal milieu following the external osmolarity (22). Mammalian cells, however, exist in an environment in which the composition is maintained within very narrow margins by tightly controlled kidney function. As a result, with the exception of cells located in the outer and inner medulla of the kidney, where the osmolarity changes with the diuretic state of the organism (46, 47), few cells experience large fluctuations in their external osmolarity. Most mammalian cells have, however, conserved a variety of response mechanisms to hyperosmolarity, which include the activation of receptors (48) and ion transport mechanisms (2, 14, 24, 34, 40, 41, 54); transcriptional activation of organic solute transporters (7, 15, 57); and the stimulation of stress response genes (3, 9, 13, 48).
Among the many transport mechanisms sensitive to small changes in cell volume are cation-chloride cotransporters, such as the K-Cl cotransporters (KCC1-KCC4), which are activated by cell swelling (for reviews, see Refs. 25 and 28), and the Na-K-2Cl cotransporters (NKCC1–2), which are stimulated by cell shrinkage (for reviews, see Refs. 20 and 45). Activation of NKCC1 by hypertonicity has been historically demonstrated through bumetanide-sensitive unidirectional K+ influx measurements (e.g., 5, 19, 27, 30, 37, 39, 51, 56). In a recent study performed in Xenopus laevis oocytes injected with mouse NKCC1 cRNA (17), we showed that hypertonicity stimulated bumetanide-sensitive K+ and Cl− influxes, but with a unidirectional K+:Cl− transport ratio of 1:1. This behavior clearly did not reflect typical Na-K-2Cl cotransport function. Based on previous reports that suggested NKCC can function as a K+/K+ exchanger (29), we proposed that under hypertonic conditions, NKCC1 mediates more than the classical 1Na+:1K+:2Cl− transport observed by Geck et al. (21) in Ehrlich ascites tumor cells. Several studies have mathematically modeled NKCC1 and NKCC2 cotransport and demonstrated a close fit between their simulations and experimental data (4, 34, 55). These simulations agreed with the sequential binding of Na+, Cl−, K+, and Cl−, with a first-on/first-off kinetics.
In this study, we present transport and kinetic data that challenge some of the accepted features of the cotransporter and provide a model that explains unusual transport stoichiometries observed in this manuscript and in several previously published studies (e.g., Refs. 6 and 8). We used transport kinetic analysis to further characterize the behavior of NKCC1 function and derived the velocity equations of ion influx under different modalities of transport. We show that stimulation of K+ flux by trans K+ is an intrinsic property of the cotransporter. We further show that hypertonic movement of K+ is dependent on binding of external Na+. Our data also indicate that hypertonicity must markedly increase the binding of one of the two Cl− ions and suggests the existence of partial transport reactions of K+ and Cl−, without transport of Na+ (and possibly the second Cl− ion). Furthermore, we show that a partial transport of K+ and Cl− without transport of Na+ necessitates internal release of K+ before Na+. Therefore, the order of external ion binding is: Cl−, followed by Na+, the second Cl−, and then K+, and the order of release inside is K+, the second Cl−, Na+, and then the first Cl−, differentiating our model from the glide symmetry model proposed by McManus and colleagues (32).
MATERIALS AND METHODS
Isolation of Xenopus Laevis Oocytes
All animal procedures and experiments were approved by the Vanderbilt University Institutional Animal Care and Use Committee. Oocyte-positive Xenopus laevis pigmented female frogs were housed in an environmental chamber maintained at 16°C on a 12-h:12-h on/off light cycle (11). For oocyte collection, frogs were first anesthetized with buffered tricaine (1.7 g/l Tricaine, 3.4 g/l sodium bicarbonate), then a small 5- to 10-mm incision was made on the lower abdomen with a disposable sterile scalpel. Ovarian lobes were externalized with sterile curved forceps, removed with sharp scissors, and placed in a 10-cm plastic petri dish containing ice-cold modified L15 solution. The modification consisted of adding 200 ml deionized water, 952 mg HEPES (acid form), and 400 ml gentamicin (50 mg/ml) to 250 ml Leibovitz L15 ringer from Invitrogen (Carlsbad, CA). The final pH and osmolarity were adjusted to 7.4 and 195–200 mosM, respectively. The incision was then closed with three to four stitches using Ethicon 4/0 nylon monofilament suture (VWR, West Chester, PA). Stage V-VI Xenopus laevis oocytes were manually defolliculated from ovarian lobes of 14 different frogs and maintained at 16°C in modified L15 medium. Oocytes were injected on day 2 with 50 nl water containing 15 ng wild-type NKCC1 cRNA (see cRNA Synthesis). Some groups of oocytes were also injected on day 3 with 50 nl water containing constitutively active SPAK (Ste20-related proline and alanine-rich kinase) cRNA or constitutively active OSR1 (oxidative stress response) cRNA (18). Tracer fluxes were performed on day 5 postisolation.
cRNA Synthesis
All cDNA clones in the amphibian expression vector pBF were linearized with MluI and transcribed into cRNA using Ambion's mMESSAGE mMACHINE SP6 transcription system (Ambion, Austin, TX). RNA quality was verified by gel electrophoresis (1% agarose, 0.693% formaldehyde) and quantitated by measurement of absorbance at 260 nm.
K+ and Na+ Uptakes in Xenopus Laevis Oocytes
Groups of 20–25 oocytes in a 35-mm dish were washed once with 3 ml isotonic saline containing 96 mM NaCl, 4 mM KCl, 2 mM CaCl2, 1 mM MgCl2, 5 mM HEPES buffered to pH 7.4, and 195–200 mosM and preincubated for 15 min in 1 ml isotonic or hypertonic saline, containing 1 mM ouabain. Hypertonic saline (260–265 mosM) was obtained by adding 65 mM sucrose to the isotonic saline. The preincubation solution was then aspirated, and the oocytes were rinsed once with a solution of specific ionic composition (see Table 1), then with 1 ml of identical solution containing either 5 μCi radio-labeled rubidium (86Rb) or 10 μCi 22Na and 1 mM ouabain (Perkin Elmer Life Science, Boston, MA). Two 5 μl aliquots of flux solution were sampled at the beginning of each uptake period and used as standards. After 1 h for regular (or 10 min for kinetic) uptake, the radioactive solution was aspirated and the oocytes were washed four times with 3 ml ice-cold isotonic or hypertonic solution. Individual oocytes were then transferred into glass vials, lysed for 1 h with 200 μl 0.25N NaOH, and neutralized with 100 μl glacial acetic acid and 86Rb tracer activity was measured by β-scintillation counting. Individual oocytes were also placed in plastic tubes for direct measurement of 22Na tracer activity using a solid Packard γ-radiation counter. NKCC1-mediated influxes were expressed in nanomoles K+ or Na+ per oocyte per hour (or min−1).
Table 1.
Composition of the flux solutions
| Regular | Regular | 92 Na+ | 10 Na+ | 92 Na+ | 10 Na+ | |
|---|---|---|---|---|---|---|
| Isosmotic | Hyperosmotic | 30 Cl− | 30 Cl− | 10 Cl− | 10 Cl− | |
| NaCl | 96 | 96 | 22 | 10 | 2 | 2 |
| NaOH | – | – | 70 | – | 90 | 8 |
| HCl | – | – | – | 12 | – | – |
| CH4O3S | – | – | 70 | 70 | 90 | 90 |
| C7H17NO5 | – | – | – | 82 | – | 82 |
| KCl | 4 | 4 | 4 | 4 | 4 | 4 |
| 80 Na+ | 10 Na+ | 80 Na+ | 10 Na+ | |||
| 20 K+ | 20 K+ | 2 K+ | 2 K+ | |||
| NaCl | 80 | 10 | 80 | 10 | ||
| NaOH | – | – | – | – | ||
| HCl | – | 70 | 18 | 88 | ||
| CH4O3S | – | – | – | – | ||
| C7H17NO5 | – | 70 | 18 | 88 | ||
| KCl | 20 | 20 | 2 | 2 | ||
| 45 Cl− | 15 Cl− | 45 Cl− | 15 Cl− | |||
| 8 K+ | 8 K+ | 1 K+ | 1 K+ | |||
| NaCl | 33 | 3 | 40 | 10 | ||
| NaOH | 59 | 89 | 52 | 82 | ||
| HCl | – | – | – | – | ||
| CH4O3S | 59 | 89 | 52 | 82 | ||
| C7H17NO5 | – | – | – | – | ||
| KCl | 8 | 8 | 1 | 1 | ||
| All solutions above also contain | ||||||
| CaCl2 | 2 | 2 | 2 | 2 | 2 | 2 |
| MgSO4 | 1 | 1 | 1 | 1 | 1 | 1 |
| HEPES/C7H17NO5 | 10 | 10 | 10 | 10 | 10 | 10 |
| Sucrose | – | 65 | 65 | 65 | 65 | 65 |
| pH | 7.4 | 7.4 | 7.4 | 7.4 | 7.4 | 7.4 |
| Osmolarity (mosM) | 200 | 265 | 265 | 265 | 265 | 265 |
All concentrations are given in millimolars per liter. For kinetics, the solutions were mixed to provide solutions with intermediate concentrations. CH4O3S, methanesulfonic acid; C7H17NO5, N-methyl-d-glucamine.
Isotonic K+ Efflux Measurements in Xenopus Laevis Oocytes
Groups of six oocytes were injected 15 ng NKCC1 cRNA and 10 ng of constitutively active SPAK cRNA (18) on days 2 and 3, respectively. Oocytes were preloaded for 24 h with 2.5 μCi ml−1 86Rb in L15 before measurement of efflux on day 5. Individual wells of a 24-well cell culture plate were filled with 1 ml of regular isotonic saline or 1 ml of K+-free isotonic saline (K+ replaced with an equivalent amount of Na+). An oocyte transfer device (17) was back-loaded with six oocytes and transferred from well to well every min for the first 4 min and every 2 min for an additional 26 min. At the end of the 30-min efflux, the six oocytes were recovered and transferred to glass vials, lysed for 1 h with 200 μl 0.25N NaOH, and neutralized with 100 μl glacial acetic acid and 86Rb content was determined by β-scintillation counting. The loss of 86Rb+ was determined at every time point by transferring 300 μl of solution from each well into glass vials for β-scintillation counting. The amount of 86Rb+ in the oocytes (in counts per minute) was back-calculated for every time point and plotted in natural logarithmic scale as a function of time. Note that the first data 4 to 5 points (rapid drop) correspond to the washout of contaminating external 86Rb, which is carried by the transfer device. Rate constant for 86Rb efflux, expressed as min−1, was determined as the slope after regression analysis of the data points that form the linear component of the efflux.
Hypertonic K+ Efflux Measurements in Xenopus Laevis Oocytes
Groups of six oocytes were injected with 15 ng NKCC1 cRNA on day 2 and placed in L15 containing 5 μCi/ml86Rb on day 3. On day 5, two 24-well cell culture plates were prepared by filling the first 15 wells with 1 ml of hypertonic saline containing 4 mM K+ and the next nine wells with 1 ml of hypertonic saline containing 4 mM Rb+. A second set of 24-well plates was prepared by reversing the order of the hypertonic saline with the first 15 wells containing 4 mM Rb+ and the remaining nine wells containing 4 mM K+. The oocyte transfer device was back-loaded with six oocytes and transferred from well to well every min for the first 4 min and every 2 min for an additional 38 min. At the end of the 42-min efflux, the oocytes were treated as described earlier (see isotonic K+ efflux above).
Water Content of Xenopus Laevis Oocytes
The water content was measured using the fresh weight minus dry weight method and corrected for extracellular water by using inulin as a marker for extracellular space (42). Inulin was weighed and solubilized in deionized water by heating at 60°C. The inulin-containing water was cooled down and used to dilute the L15 to the desired osmolarity (200 mosM, see above). As a large polymer of fructose, inulin does not contribute to the solution's osmolarity. Groups of 10 oocytes were rapidly washed in inulin containing L15 (final concentration of 1% weight/volume) and placed onto a preweighed 1 cm2 piece of aluminum foil. Excess water was pipetted away, and the 10 oocytes were weighed (fresh weight). The aluminum boats were placed in an oven at 110°C for 24 h and then weighed again (dry weight). Total water content was calculated as the fresh weight minus dry weight. Extracellular water was determined by placing the aluminum boats in 750 μl water for 48 h at 4°C. Inulin content was measured by adding 500 μl resorcinol reagent (0.1 g resorcinol, 0.25 g thiourea dissolved in 100 ml glacial acetic acid) and 3.5 ml 30% HCl to 500 μl sample, incubating at 80°C for 10 min, cooling down, and measuring the absorbance at 520 nm. Standard curve was made using 1–5 μl inulin-containing L15 in 500 μl water. Oocyte water was calculated as total water minus extracellular water.
Ion Content of Xenopus Laevis Oocytes
The intracellular Na+, K+, and Cl− concentrations were determined in oocytes coinjected with NKCC1 cRNA and constitutively active SPAK cRNA via isotope equilibration. In brief, groups of 20–25 oocytes were incubated for 24 h with L15 containing 1 μCi/ml of either 22Na, 86Rb, or 36Cl. Preliminary experiments have shown that oocytes injected with NKCC1 cRNA and constitutively active SPAK cRNA equilibrate the isotopes to the outside specific activity within 12–24 h. After two 5-μl samples were collected to calculate the outside specific activity, the oocytes were rapidly washed four times with ice-cold L15 and individually counted. Each ion concentration was calculated based on the outside specific activity and the oocyte water content.
Nystatin Treatment of Xenopus Laevis Oocytes
To modify the concentration of intracellular ions, groups of 20–25 oocytes were first incubated on ice in 3 ml isotonic solutions containing 10 mM NaCl, 0–29 mM KCl, 0–50 mM K-acetate, 0–29 mM LiCl, 0–50 mM Li-acetate, 2 mM Ca(NO3)2, 1 mM MgSO4, 5 mM HEPES/NMDG (pH 7.4), and 200 mosM and 20 μg/ml nystatin (Sigma). After 1 h nystatin treatment, the solution was aspirated and the oocytes were incubated for 30 min on ice with an identical solution free of nystatin before four washes at 30°C with an identical solution containing 0.5 mg/ml BSA and 1 mM ouabain. Finally, the oocytes were washed twice with a regular isotonic solution before use.
Simulation of Na-K-2Cl Cotransport
To simulate K+ transport (influx and efflux) and Na+ influx, source code was written in VisualBasic (Version 2.0, Microsoft, Redmond, WA) (See Fig. 3). After compilation, the executable file was run on Dell computers with Intel Core 2 Duo processors at 2.66 GHz, 2 GB of RAM. We used Eqs. 11 and 12 as well as an equation for K+ efflux and assigned values for translocation rate constants, binding affinities, and ion concentrations. Although some of these parameters were fixed at specific values, others were allowed to vary within specific ranges. Simulation data were filtered to fit specific criteria, and if all criteria were met, the data were written in separate files for analysis.
Fig. 3.
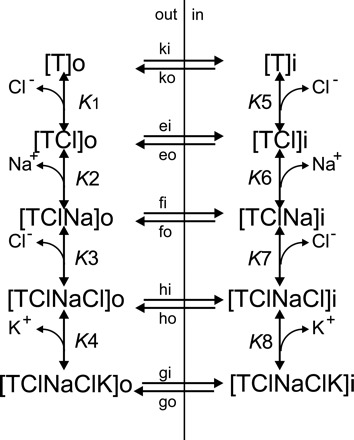
Steady-state model of Na-K-Cl cotransport with partial transport reactions. The order of ion binding is identical to the order in Fig. 2, with Cl− binding first, followed by Na+, Cl−, and K+. The order of ion release on the inside of the cell is K+ followed by Cl−, then Na+ and the second Cl−. In the steady-state model, transporter complexes at the trans side affect the rate of transport at the cis side. Note that translocation reactions are allowed for all partially loaded carriers, to allow all possible transport reactions in the derivation of transport velocity.
Theoretical Considerations
The kinetic rate equations for Na-K-2Cl transport can be written using either rapid equilibrium assumptions or combined assumptions of equilibrium and steady state. The first method considers the transporter and the substrate only on one side of the membrane, whereas the second method considers all possible states of the transporter on both sides of the membrane. Although the equations are quite different, under double reciprocal form, they have the same general structure and, therefore, share similar properties.
Rapid equilibrium equations.
Under the rapid equilibrium assumption, the overall reaction is defined by its rate limiting step, which in the case of transport is the translocation of the fully loaded carrier to the other side of the membrane. To conform with nomenclature of rapid equilibrium kinetics for enzyme systems proposed by Segel (49), we define the rate constant for this limiting step as kp. As a starting point, we adopted the ion binding model proposed by Lytle et al. (32) with the free transporter outside binding Na+ first, followed by Cl−, K+, and a second Cl− ion (Fig. 1). We demonstrate here that under rapid equilibrium assumptions, the behavior of equations for curves in Lineweaver-Burke plots closely reflects the order of ion binding.
Fig. 1.

Rapid equilibrium model of Na-K-2Cl cotransport with the Na+ ion binding first. A: on the outside, the cotransporter exists in 5 different configurations, from empty to fully loaded. Once fully loaded, the translocation of the ions across the plasma membrane constitutes a rate limiting step of transport (rate constant = kp). Dissociation constants K1–K4 characterize the binding of each ion. B: simulation of Lineweaver-Burke plot of K+ influx−1 versus [Na+]o−1 based on Eq. 5 demonstrates that with this order of ion binding, the flux is almost independent of external Na+. The intercept of the lines in the left quadrant, which represents the reciprocal of the apparent affinity for Na+, is located far outside the range of the plot. Simulation was done with K1 set at 25 mM, K2 set at 1 mM, K3 set at 2 mM, and K4 set at 200 mM.
In rapid equilibrium, the velocity of transport is defined as:
| (1) |
As the total number of transporters (Tot) is [T]o + [TNa]o + [TNaCl]o + [TNaClK]o + [TNaClKCl]o,
| (2) |
After reversing and defining Vmax as the product of kp * Tot, the equation becomes:
| (3) |
Equation 3 can be written as a function of 1/[K]o, 1/[Na]o, and 1/[Cl]o:
| (4) |
| (5) |
| (6) |
It can be seen that Eqs. 4 and 5 are linear equations (y = ax + b), whereas Eq. 6 is a second-order polynomial equation (y = ax2 + bx + c). For Eq. 4, the intercept on the y-axis is independent of [Na]o, but dependent of [Cl]o, whereas for Eq. 5, the intercept on the y-axis is dependent of both [K]o and [Cl]o. Simulation of Eq. 5 reveals that if Na+ binds first, the influx shows very little dependence on the external Na+ concentration (Fig. 1B). Interestingly, if we set the affinity for the first Cl− ion very high (e.g., 1), the numerator in the constant in front of 1/[Cl]o2 becomes small. Division of this smaller numerator by a large denominator causes the constant to approach zero, eliminating the squared term, which linearizes Eq. 6 with a y-intercept independent of Na+ or K+.
Let's now consider an alternative binding model where Cl− binds first, followed by Na+, the second Cl−, and K+ (Fig. 2). In this case, the velocity for influx is defined as:
| (7) |
After reversing and redistributing the terms as a function of 1/[K]o, 1/[Na]o, and 1/[Cl]o, we obtain:
| (8) |
| (9) |
| (10) |
Fig. 2.

Rapid equilibrium model of Na-K-2Cl cotransport with one of the Cl− ions binding first. A: order of ion binding is different from the order of ion binding in Fig. 1, and the dissociation constants have been reassigned accordingly. B: simulation of Lineweaver-Burke plot of K+ influx−1 vs. [Na+]o− based on Eq. 9 demonstrates that with this order of ion binding, the flux is dependent upon external Na+. The intercept of the lines in the left quadrant, which represents the reciprocal of the apparent affinity for Na+, is located within the range of the plot. Simulation was done with K1 set at 1 mM, K2 set at 25 mM, K3 set at 200 mM, and K4 set at 2 mM.
In this scenario, the y intercept Eq. 8 is still independent of external Na+, but now is also independent of external Cl−. Similar to Eq. 5, the y intercept as a function of [Na]o−1 in Eq. 9 is still dependent on [K]o and [Cl]o. Note that now, when we set the dissociation constant for the first Cl− ion to 1 (very high affinity for the first Cl− binding), Eq. 10 becomes linear similar to Eq. 6 with the exception that now the y intercept is K+ dependent. Furthermore, simulation of Eq. 9 reveals that if Cl− binds first, the influx shows a dependency on the external Na+ concentration (Fig. 2B).
Steady-state equations.
In the previous section, we show that the model proposed by Lytle et al. (32) could not be supported under rapid equilibrium assumptions (Fig. 1); therefore, we proposed an alternative order of ion binding for the Na-K-2Cl cotransporter (Fig. 2). Here, we consider an alternative to the first-on/first-off concept of Na+ being the first ion released inside (32) by having K+ and Cl− being released before Na+ (Fig. 3). Furthermore, we allow for partially loaded transporters to translocate across the plasma membrane. Under combined equilibrium and steady-state assumptions, the number of transporters existing on the trans side of the membrane (i.e., the inside for an influx measurement) are taken into account when deriving the equations. In this model, because the binding of ions to the transporter is much faster than the translocation steps, the partial binding steps on each side of the membrane reach near equilibrium as the overall transport reaction reaches a steady state. The methods of Cha (10) and King and Altman (26) are used to simplify the kinetic scheme and derive the steady-state equations for influx in the format of Stein (50).
The derivation yielded Eq. 11 for K+ influx and Eq. 12 for Na+ influx:
| (11) |
In this case, the equation for Na+ influx is different, since Na+ is not always released:
| (12) |
with:
n = number of transporter units.
Thermodynamic constraints (for ho, hi, eo, ei = 0):
In this scenario, the amount of K+ transported is greater than the amount of Na+ transported, unless the rate constants fo/fi and ho/hi are set to zero.
Under double reciprocal form, Eq. 11 becomes Eq. 13:
| (13) |
By defining T1 = Ki′Cli′Cli″Nai′; T2 = n gi (go Cli′Ki′Nai′Cli″ + ho Cli′Nai′Cli″ + fo Nai′Cli′ + eo Cli′ + ko); and T3 = Clo′Nao′Clo″.
When expressed as a function of external Ko, Eq. 13 takes the following form:
| (14) |
Similar to Eq. 8, as T1, T2, and Re are independent of Nao and Clo, Eq. 14 has a single intercept on y axis.
RESULTS
In a previous study, we observed that under hyperosmotic conditions, K+ moved together with Cl− in a 1:1 ratio, rather than following the expected 1K+:2Cl− stoichiometry of the Na-K-2Cl cotransporter. We also observed that NKCC1-mediated K+ efflux required the presence of external K+ (17). These data suggested that hypertonicity transitioned the heterologously expressed mouse NKCC1 from a Na-K-2Cl cotransporter to a ′K+/K+ and Cl−/Cl− exchanger′, masking the ′net′ 1Na+:1K+:2Cl− stoichiometry of the carrier. Here, we expand on those studies by measuring Na+ transport and using transport kinetic analysis to account for our observations.
The unidirectional transport of 1 K+ and 1 Cl− that we observed under hypertonicity (17) cannot be explained by the kinetic model of a true cotransporter. Because previous studies had demonstrated that the K+/K+ exchange mode of transport through NKCC1 was sensitive to internal Na+ but insensitive to external Na+ (29), we measured hyperosmotically stimulated K+ influx in a Na+-free solution. As shown in Fig. 4, the K+ uptake was greatly reduced by the absence of external Na+. However, because the uptake was measured over a 60-min period, we considered the possibility that the observed effect was due to a loss of internal Na+ during the course of the uptake experiment. To eliminate this as a possibility, we repeated the uptake experiment at 10-, 4-, 2-, and 1-min time points. In all conditions the absence of external Na+ significantly reduced the uptake of K+.
Fig. 4.

Dependence of NKCC1-mediated K+ uptake on the external Na+ concentration. Hyperosmotic ouabain-resistant K+ uptake was measured using 86Rb tracer in NKCC1 cRNA-injected oocytes for 60 min, 10 min, 4 min, 2 min, and 1 min in the presence (96 mM) and absence (0 mM) of external Na+. Solutions were made hyperosmotic (265 mosM) with addition of 65 mM sucrose. Na+-free solution was made by replacing Na+ with N-methyl d-glucamine. Ouabain-resistant K+ uptake is expressed in nanomoles K+ per oocyte. Bars represent means ± SE (n = 20–25 oocytes).
Because the requirement for external Na+ is not necessarily equivalent to Na+ being transported, we next utilized 22Na to measure the movement of Na+ through NKCC1. In this experiment, oocytes were injected with NKCC1 cRNA alone or coinjected with the constitutively active SPAK cRNA, and the bumetanide-sensitive unidirectional influxes of K+ and Na+ were measured, under either isosmotic or hyperosmotic conditions, in separate groups to avoid overlap of radiation emission signals. Under isotonic conditions, the amount of Na+ movement matched the amount of K+ movement. However, under kinase-stimulated isosmotic conditions and under hyperosmotic conditions, the movement of Na+ was significantly less than that of K+, 58% and 25%, respectively (Fig. 5).
Fig. 5.
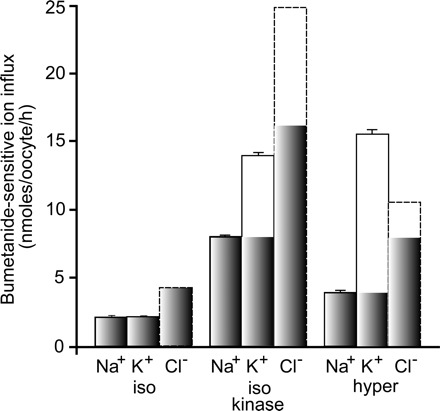
NKCC1 transports less Na+ than K+. Ouabain-resistant unidirectional 86Rb and 22Na fluxes were measured in NKCC1 cRNA-injected oocytes incubated in isosmotic (200 mosM) and hyperosmotic (265 mosM) solution, in the presence and absence of 20 μM bumetanide. Fluxes were also measured in oocytes coinjected with NKCC1 cRNA and constitutively active SPAK cRNA in isosmotic solution. Bumetanide-sensitive K+ and Na+ influxes are expressed in nanomoles cation·oocyte−1·h−1. Bars represent means ± SE (n = 20–25 oocytes). SEs for bumetanide-sensitive flux were calculated as square roots of (SEM12 n1−1 + SEM22 n2−1). Cl− influxes (dotted lines) are taken from earlier studies (17). Shaded bars indicate the classical 1Na+:1K+:2Cl−1 component of transport.
Because the movement of K+ was measured using 86Rb instead of 42K, we considered the possibility that the two cations might have different binding affinities and introduce a systematic error in the measurement of K+ uptake. Because 42K is currently unavailable, we performed an experiment in which we measured isosmotic and hyperosmotic 86Rb influx in the presence and absence of bumetanide containing either 4 mM K+ or 4 mM Rb+. If K+ had a higher binding affinity than Rb+, it would out compete the tracer at the K+ binding site and reduce tracer movement. As seen in Fig. 6A, there was no significant ion flux difference (P > 0.05) under either isosmotic or hyperosmotic conditions between the two cations, indicating no difference between the affinities of Rb+ or K+ at the K+ binding site of the cotransporter.
Fig. 6.

Ouabain-resistant influx and efflux measured through 86Rb movement. A: K+ and Rb+ influx was measured in NKCC1 cRNA-injected oocytes in the presence and absence of 20 μM bumetanide in isosmotic or hyperosmotic media containing either 4 mM KCl or 4 mM RbCl. Bars represent means ± SE (n = 20–25 oocytes). B: oocytes injected with NKCC1 cRNA were preloaded with 86Rb, and washout kinetics was measured in hyperosmotic solutions containing 4 mM K+ or 4 mM Rb+. After reconstituting the content of 86Rb in the oocytes at each time point and plotting the data [exponential decrease: 86Rb(t) = 86Rbt=0 e−kt] in semi-logarithmic form, the first-order rate constant for K+ efflux in the absence (○) or presence of 20 μM bumetanide (■) was measured as the slope of the linear component. Arrow indicates a change in external solution. Experiments were done in duplicate.
A second possible systematic error when using 86Rb+ to trace K+ movement might involve different translocation rates of the carrier. Because 42K isotope is unavailable, we designed an experiment that indirectly compares the translocation rates of the K+-loaded versus Rb+-loaded transporters. Because the rate of efflux is dependent upon the return of loaded transporters, we measured the rate of 86Rb efflux in the presence of 4 mM K+ or 4 mM Rb+. NKCC1-injected oocytes were loaded with 86Rb, and the rate constant of tracer efflux was first measured in a hyperosmotic solution containing K+, followed by a solution containing Rb+ (or the reverse). A break in the slope would indicate different rate constants or translocation rates between the two cations. As shown in Fig. 6B, the rate constants determined from the slopes of tracer efflux were not significantly different (P > 0.5; n = 4) between 4 mM external K+ (−2.208 ± 0.13 × 10⁻² min−1) and 4 mM external Rb+ (−2.323 ± 0.14 × 10⁻² min−1). Note that addition of 20 μM bumetanide completely abrogated the efflux.
Steady-state kinetic modeling of Na-K-2Cl cotransport predicts that external K+ increases K+ efflux (see Table 3). To test this prediction, we coinjected oocytes with wild-type NKCC1 cRNA and constitutively active SPAK cRNA. After loading the oocytes overnight with 86Rb, the rate constant of tracer efflux was measured in the presence (4 mM) and absence (0 mM) of external K+. As shown in Fig. 7A, the rate constant of Rb+ efflux decreased from −1.599 × 10⁻² min−1 (r2 = 0.9971) with 4 mM external K+ to 0.579 × 10⁻² min−1 (r2 = 0.9994) in the absence of external K+.
Table 3.
Model coefficients for NKCC1 transport under hypertonic conditions
| Simulation |
|||
|---|---|---|---|
| 1 | 2 | 3 | |
| Number of transporters | 1,000 | 2,100–2,300 | 3,000 |
| ki | 0.5 | 2.4–2.5 | 0.5 |
| ko | 1 | 1 | 1 |
| fi | 0.7 | 0.2 | 0.3 |
| fo | 10 | 6–10 | 2–4 |
| gi | 8 | 2.7–3 | 2 |
| go | 2–4 | 2–4 | 2 |
| K1 | 5–7 | 4 | 5 |
| K2 | 25–30 | 22–24 | 30 |
| K3 | 170–200 | 180–220 | 200 |
| K4 | 9–11 | 7–9 | 7 |
| K5 | 10–160 | 14–24 | 40–160 |
| K6 | 1–19 | 1–11 | 4–19 |
| K7 | 40–160 | 5–9 | 10–160 |
| K8(*) | 5–40 | 100–200 | 19–195 |
| K+ influx/K+ efflux | 1.7 | 1.6 | 1.8 |
| K+ influx/Na+ influx | 3.1–4.9 | 3.0–3.2 | 2.1–3.5 |
| K+ efflux ([K+]o = 4)/K+ efflux ([K+]o = 0) | 2.5–2.6 | 3.0–3.2 | 2.1 |
In this series of simulations, we varied 13 of the 15 kinetic parameters. Translocation rate constants ko was set at 1. (*)K8 was mathematically derived based on thermodynamic constraints (see materials and methods, Theoretical Considerations, Fig. 3). We varied the number of transporters (1,000–8,000), the remaining translocation rate constants ki (0.1–3), fo (1–10), fi (0.1–1), gi (1–10), go (1–10); and the binding affinities (mM) as follows: K1 (1–19); K2 (20–30); K3 (10–200); K4 (1–30); K5 (10–190); K6 (1–20); and K7 (1–10 or 10–160). Reported parameter values were obtained using Eqs. 11 and 12 for conditions were 1) compatible with Table 2; 2) K+ influx > Na+ influx; 3) K+ efflux ([K+]o = 4) > K+ efflux ([K+]o = 0); and 4) fit the data of Fig. 8. Note that when the products of ion concentrations inside and outside are equal (Nai × Ki × Cli2 = Nao × Ko × Clo2), the simulation resulted in no net flux.
Fig. 7.
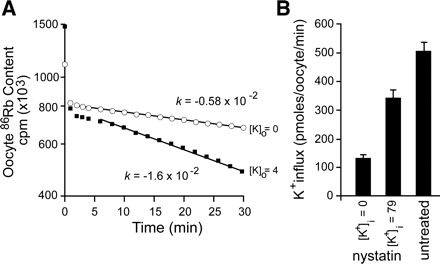
Trans effect of K+ on NKCC1-mediated K+ flux. A: effect of external K+ on the rate constant for 86Rb loss. Oocytes injected with NKCC1 cRNA and constitutively active SPAK cRNA were loaded overnight with 86Rb, and washout kinetics were measured in isosmotic solutions containing 4 mM K+ (■) or 0 mM K+ (○). After reconstituting the content of 86Rb in the oocytes at each time point and plotting the data [exponential decrease: 86Rb(t) = 86Rbt=0 e−kt] in semi-logarithmic form, the first-order rate constant for K+ efflux was measured as the slope of the linear component. Experiments were done in duplicate. B: effect of internal K+ on K+ influx. Oocytes injected with NKCC1 cRNA were treated with nystatin in solutions containing 79 mM Li+ (0 mM K+) or 79 mM K+, then fluxed with 86Rb in the regular hyperosmotic solution. A third untreated group consisted of NKCC1 cRNA-injected oocytes. Bars represent means ± SE (n = 20–25 oocytes).
Next, to assess whether K+ influx is also trans stimulated by internal K+, we sought to modify the internal K+ concentration in Xenopus laevis oocytes. To perform this experiment, we first had to use the isotope equilibrium method to determine the intracellular concentration of the three major ions, Na+, K+, and Cl−. To do this, we incubated oocytes in L15 media containing a small amount of isotopic ion until the isotope reached an internal specific activity equal to the extracellular specific activity. Because the ion permeability of the oocyte membrane is extremely low, preliminary work showed that only oocytes injected with NKCC1 cRNA and constitutively active SPAK cRNA equilibrated isotopes within 12–24 h (data not shown). To determine the ion concentrations, the water content of oocytes was determined by weighing oocytes before and after drying them at 110°C for 24 h. Extracellular water was quantitated using inulin as an extracellular marker. Table 2 reports the water content, as well as the internal Na+, K+, and Cl− concentrations of Xenopus laevis oocytes maintained in L15 medium. We then manipulated the ion concentrations of two groups of oocytes using nystatin as an ionophore and kept a third untreated group, as control. To assess the effectiveness of the nystatin treatment, we preloaded a group of oocytes overnight with 86Rb. After treatment with the antibiotic (and subsequent washes) in a solution containing 0 mM K+, 96% of 86Rb was lost, indicating the successful formation of pores. The two treatment groups were incubated with nystatin in solutions containing 10 mM Na+, 39 mM Cl−, and 79 mM K+ or 79 mM Li+ (K+ replacement). After the nystatin was washed away, the oocytes were preincubated in a regular hypertonic solution containing ouabain and then fluxed with 86Rb in the same solution. As seen in Fig. 7B, although K+ influx was lower in oocytes containing 79 mM internal K+ versus untreated, it was significantly greater than oocytes with 0 mM internal K+.
Table 2.
Oocyte water and ion concentrations
| Water, mg or μl | 0.58 ± 0.02 | n = 5* |
| Na+, mM | 10 ± 0.7 | n = 20 |
| K+, mM | 79 ± 0.9 | n = 19 |
| Cl−, mM | 39 ± 1.2 | n = 24 |
Values are means ± SE. The water content was measured using the fresh weight/dry weight method and correcting for extracellular water. Ion concentration was determined in single oocyte using isotope (22Na, 86Rb, and 36Cl) equilibrium.
Water was measured using 5 groups of 10 oocytes.
To understand the unusual transport stoichiometries observed in terms of a cotransport model, we also characterized the binding of each ionic species to the configuration of the cotransporter on the outside. This was achieved by examining the behavior of the K+ influx, while varying the external concentrations of Na+, K+, and Cl−. Hypertonically stimulated K+ influx was measured first by varying both the external Na+ and K+ concentrations. Double reciprocal plots for various [Na+]o intercept the y axis in a K+-dependent manner. The common intercept is located in the left quadrant and corresponds to an apparent affinity for Na+ of 20–25 mM (Fig. 8A). In the alternate plot, with [K+]o varied, the common intercept is located in the right quadrant very close to the y axis (Fig. 8B), indicating that Na+ binds before K+. At high (physiological) external Na+ concentrations, the apparent affinity for K+ was determined to be 7.9 mM. Hypertonically stimulated K+ influx was also measured varying both the external Na+ and Cl− concentrations. Double reciprocal plots for various [Na+]o intercept the y axis in a Cl−-dependent manner (Fig. 8C). The x axis intercept corresponds to an apparent affinity for Na+ of 20–30 mM, consistent with the values observed in Fig. 8A. All curves in the alternate plot (Fig. 9D) with [Cl−]o being varied intersect on the y axis, leading to the conclusion that Na+ binds to the transporter prior to Cl−. Interestingly, all curves in Fig. 8D are linear and not quadratic, as would be anticipated for a model where two Cl− ions bind and are transported (see materials and methods, Theoretical considerations). We also addressed the third combinatorial possibility by measuring hypertonically stimulated K+ influx while varying the external Cl− and K+ concentrations. First, as anticipated from the data of Fig. 8D, when flux−1 is plotted as a function of external Cl−1, the data are also best fitted by linear instead of quadratic regressions (Fig. 8E). Second, the affinity for external Cl− at 4 mM external K+ is very low, measured at 200 mM. Third, when flux−1 was plotted as a function of external K+, the lines representing the different Cl− concentrations have a single intercept on the y axis (Fig. 8F). This behavior indicates that Cl− binds to the cotransporter before K+. Therefore, the order of binding outside derived from our kinetics data under hypertonicity is: Na+ first, followed by Cl−, followed by K+.
Fig. 8.

Double reciprocal plots of ouabain-resistant K+ influx at various external Na+, K+, and Cl− concentrations. A and B: [Na+]o at different external K+ concentrations or [K+]o at different external Na+ concentrations. External Na+ was varied from 10 mM to 80 mM (N-methyl d-glucamine substitution), whereas external K+ was varied from 2 mM to 20 mM. External Cl− was kept constant at 104 mM (see Table 1). C and D: [Na+]o at different external Cl− concentrations or [Cl−]o at different external Na+ concentrations. External Na+ was varied from 10 mM to 92 mM (N-methyl d-glucamine substitution), whereas external Cl− was varied from 10 mM to 30 mM (methysulfamate substitution). External K+ was kept constant at 4 mM (see Table 1). E and F: [Cl−]o at different external K+ concentrations or versus [K+]o at different external Cl− concentrations. External K+ was varied from 1 mM to 8 mM (N-methyl d-glucamine substitution), whereas external Cl− was varied from 15 mM to 45 mM (methysulfamate substitution). External Na+ was kept constant at 92 mM (see Table 1). Each point represents means ± SE (n = 16 oocytes). Points were fitted by linear regression using Prism 3.0 (GraphPad).
Fig. 9.

Ouabain-resistant versus ouabain-resistant and bumetanide-sensitive K+ influx measured at various Cl− concentrations under isosmotic conditions. A: K+ uptake was measured in NKCC1 cRNA-injected oocytes at Cl− concentrations ranging from 80 to 10 mM in the absence (empty columns) or presence (solid columns) of 20 μM bumetanide. Bars represent means ± SE (n = 20–25 oocytes). B: data from A were plotted in double-reciprocal form with bumetanide-sensitive flux determined as the difference between total flux and flux in the presence of bumetanide.
The fact that our kinetic data demonstrated linearity of the Lineweaver-Burke plots as a function of external Cl− was puzzling. Because the plots were all derived from total 86Rb (K+) influxes instead of bumetanide-sensitive components, we considered the possibility that the linearity of the flux as a function of external Cl− in the double reciprocal plot could be the result of unspecific background uptake. We also wondered whether the influx would still be linear with a kinase-stimulated cotransporter fluxed under isosmotic conditions. To address these questions, we measured K+ influx under isosmotic conditions in the absence and presence of 20 μM bumetanide, in solutions of varying Cl− concentration. Figure 9A shows that the fluxes in the presence of the NKCC1 inhibitor were negligible when compared with the total flux, irrespective of the external Cl− concentration. When either the total flux or the bumetanide-sensitive flux was plotted in double-reciprocal form, the data were nearly identical and showed a quadratic relationship (Fig. 9B). These data demonstrate that the unspecific or background transport is negligible, and consequently the overwhelming majority of K+ transport is mediated by NKCC1. They also show that under isosmotic conditions, the NKCC1-mediated K+ influx has a quadratic relationship with respect to the external Cl− concentration, which contrasts with the linearity of the K+ influx under hypertonic conditions (Fig. 10).
Fig. 10.

Ouabain-resistant flux as a function of external Cl− through NKCC1 under isosmotic and hyperosmotic conditions. K+ influx was measured in NKCC1 cRNA-injected oocytes at Cl− concentrations ranging from 80 to 10 mM. The cotransporter was stimulated either by coinjection of constitutively active kinase cRNA under isosmotic (○) or hyperosmotic (■) conditions. Each point represents mean ± SE (n = 16 oocytes).
DISCUSSION
We previously demonstrated that hyperosmolarity altered the “classical” 1K+:2Cl− stoichiometry of NKCC1 in Xenopus laevis oocytes (17), an observation that was unlikely to be oocyte-specific since atypical NKCC1 transport stoichiometries had been observed in many other cell types (8, 23, 31, 38, 43). We considered the possibility that the cotransporter binding affinity and translocation rate for 86Rb might be different than that of K+, and therefore not be the best tracer for K+ movement. Ideally, radiolabeled 42K would best trace the movement of K+; unfortunately, the 42K isotope is no longer available. However, using a simple competition experiment, we verified that the two cations have similar binding affinities for the cotransporter. These results are supported by studies that showed similar binding constants for K+ and Rb+ in HeLa cells (35, 36), Madin-Darby canine kidney (MDCK) cells (1), and Ehrlich ascites tumor cells (21). In addition, because the rate of efflux is dependent upon the return of loaded carriers, by using different external cations (i.e., K+ vs. Rb+) in an efflux experiment, we also verified identical NKCC1-mediated translocation rates for K+ and Rb+.
Given that we only observed a 1K+:1Cl− stoichiometry under hyperosmotic conditions (17), we felt that it was important to determine the amount of Na+ movement under different conditions using 22Na+ in unidirectional tracer flux studies. Under isosmotic conditions, we observed equivalent transport of Na+ and K+. Because we previously demonstrated 1K+:2Cl− stoichiometry under similar conditions (17), this 1Na+:1K+:2Cl− ratio represents true Na-K-2Cl cotransport. However, under kinase or hypertonic stimulations, the movement of Na+ no longer matched the movement of K+, indicating atypical modes of transport. The discrepancy between K+ relative to Na+ [and Cl− (17)] movement likely represents a combination of Na-K-2Cl cotransport (shaded columns in Fig. 5) and other NKCC1-mediated modes of transport.
In previous studies, McManus and colleagues (29, 32) proposed a K+/K+ exchange mechanism that was dependent on internal Na+ but independent on external Na+. However, their first-on/first-off glide symmetry model with Na+ binding first outside and releasing first inside makes it unclear how K+/K+ exchange through the cotransporter could be independent of external Na+. In our current study, K+ movement clearly required the presence of external Na+ (Fig. 4). Additionally, our steady-state kinetic model depicted in Fig. 3 illustrates how partial transport cycles through gi/fo and go/fi could mask the complete transport cycle of the Na-K-2Cl carrier (gi/ko) in both of the stimulated transport modalities, thereby resulting in the observed atypical stoichiometries. This kinetic model of transport is also consistent with NKCC1-mediated Cl− transport in rat neonatal CA1 pyramidal neurons (6). In that study, they approximated the transport ratio as 1Na+:4K+:5Cl−, which could also be 1Na+:1K+:2Cl− cotransport activity and partial reactions mediating 3K+:3Cl− transport.
We experimentally tested the trans effect of K+ on the Na-K-2Cl cotransporter by K+ efflux and K+ influx experiments (Fig. 7, A and B). Under both conditions, K+ at the trans side stimulated the NKCC1-mediated K+ flux. Although it was straightforward to measure K+ efflux while manipulating the composition of the external solution, it was far more challenging to measure K+ influx because it was necessary to both determine and control the composition of the internal environment. In this case, we used nystatin and Li+ to modify the intracellular K+ concentration. Although Li+ might not be a completely neutral ion due to its partial transport through NKCC1 (for review see Ref. 45), we did not have any alternative, since no other cation could be used as a nystatin-permeable and neutral replacement of K+. However, simulating an increase in intracellular Li+ (Na+) using Eq. 11 resulted in trans stimulation of K+ influx, instead of trans inhibition. Therefore, the marked decrease in K+ influx measured upon removal of internal K+ is due to the decrease in K+ and not to a kinetic effect of adding Li+. Because Li+ has previously been shown to inhibit K-Cl cotransport through phosphoregulation (16), we also needed to consider the possibility that adding Li+ might have reduced NKCC1 function through phosphoregulation. However, because the regulation of Na-K-2Cl cotransport is opposite to K-Cl cotransport regulation, the expectation would be that Li+ stimulates K+ influx. Therefore, the difference in K+ influx between oocytes containing 79 mM K+ vs. 0 mM K+ (79 mM Li+) cannot be accounted for by either the kinetic or regulatory effects of Li+ and is likely due to trans effects of K+. The fact that the influx at 79 mM internal K+ after nystatin treatment was lower than that measured in untreated oocytes was also not an effect of Li+, since the cation was not present in this latter condition. We hypothesize that the reduction in K+ influx was likely due to the extensive manipulation required to perform the nystatin treatment. Wilfred Stein in his two monographies on membrane transport (50, 51) provides explanations of how carriers are often stimulated by the presence of their substrate on the trans side of the membrane. Trans stimulation of transport is only possible if the translocation rate of the empty carrier is much slower than the translocation rate of the fully loaded carrier (i.e., rate limiting). In this case, in the absence of K+, transporters at the trans side are immobilized in the [T], [TCl], [TClNa], and [TClNaCl] configurations and do not participate in transport. Upon addition of K+ at the trans side, these previously unavailable transporters are now able to return to the cis side and participate in transport. Because this unidirectional transport depends on the return of the fully loaded carrier, this transport is equivalent to an exchange. However, exchange of K+ exclusively through go/gi seems unlikely based on thermodynamic considerations.
In this study, we considered both the inward and outward kinase-stimulated NKCC1-mediated K+ movement. When we combine a measured internal K+ concentration of 79 mM, a measured oocyte volume of 0.58 μl (Table 2), and a measured isosmotic 86Rb(K+) efflux rate constant of 1.6 × 10⁻² min−1 (Fig. 7), we arrive at a calculated K+ efflux of 733 pmol·oocyte−1·min−1. Comparison of this calculated efflux value with the measured isosmotic K+ influx of 1,560 pmol·oocyte−1·min−1 yields an influx twofold greater than efflux, which is consistent with the driving forces acting on the cotransporter. When we combine the same internal K+ concentration and oocyte volume with the hypertonically stimulated efflux rate constant of 2.2 × 10⁻² min−1 (Fig. 6B), we arrive at a calculated K+ efflux of 1,012 pmol·oocyte−1·min−1, which is now 35% less than the hypertonically stimulated influx (Fig. 4 at 1 min).
Our experimental data indicate Na+ binding before K+, Na+ binding before Cl−, and Cl− binding before K+ (Fig. 8, A–F). This order of ion binding is consistent with that proposed by Miyamoto et al. (35) and Lytle et al. (32). However, the question of where the second Cl− ion binds remains unanswered. In Fig. 8A, our experimental data show the slope of K+ influx−1 versus [Na+]o−1 approaching a nearly horizontal line as the external K+ concentration increases. Based on rapid equilibrium kinetics, this indicates that the Na+ ion must bind before K+ (12, 49). Our plots of K+ influx−1 versus [Cl−]o−1 at different [Na+]o (Fig. 8D) or [K+]o (Fig. 8E) were linear and not quadratic, suggesting that under hyperosmotic conditions the binding affinity of one of the two Cl− ions significantly increases. Therefore, we propose that Cl− binds first, followed by Na+, Cl−, and K+. This order of ion binding is illustrated in Fig. 3 and mathematically derived in Eqs. 11 and 12. If the binding of the first Cl− is very tight (i.e., the dissociation constant K1 approaches 0), then K1 × [Cl]o−1 in Eq. 9 becomes insignificant, and the slope flattens at high K+ concentrations (just like if Na+ was binding first), and all Lineweaver-Burke plots are linear.
Using the velocity equations for K+ (Eq. 11) and Na+ (Eq. 12) influx derived from Fig. 3, we simulated ion fluxes by inputting different values for the binding affinities (K1-K8), the translocation rates (gi, go, fi, fo), and the number of transporter units (n). We also set values for all parameters in the two thermodynamic constraints equations with the exception of K6 and K7. In Table 3, our simulations done using physiological ionic concentrations have identified sets of coefficients that: 1) model the experimental data of Fig. 8, 2) have a K+ influx ∼1.5-fold greater than K+ efflux, 3) a K+ influx threefold greater than Na+ influx, and 4) exhibit a K+ efflux that is trans-stimulated by external K+. To meet these requirements, the rate constant fo must be much larger than the rate constant fi, indicating asymmetry of the carrier. Our simulations also show that go and gi must be greater than ko and ki, indicating that translocation of loaded carrier is greater than the translocation of empty carrier. Second, our slippage translocation rate constants gi/fo and go/fi must be equal or greater than the unloaded translocation rate constants (ko/ki). Third, and as anticipated, the external affinity of the first Cl− is much higher than the second Cl−. Fourth, we observed that the true affinity for external Na+ binding is close to the 20–30 mM apparent affinity obtained through the common intercept in Fig. 8A. Fifth, we found that the external binding affinity for K+ was very high, which intuitively seems logical as the external K+ concentration is very low. Finally, we found that the inside binding affinities for K+ and the second Cl− are significantly lower than Na+ and the first Cl− ion, facilitating the release of the first two ions before the slippage translocation steps (fi/fo). However, only efflux experiments performed while varying the intracellular ion concentrations can provide the precise values for binding affinities on the inside.
In Fig. 9, we verified that the observed transport is mediated by NKCC1 since it only occurs in NKCC1 cRNA-injected oocytes and is bumetanide sensitive. Furthermore, for the K+ transport to be larger than the Na+ transport, the order of internal ion release challenges the glide symmetry model proposed by McManus and coworkers (32). Indeed, if Na+ was released first as proposed, there would be no exchange conditions that would explain a transport of Na+ lower than K+. In contrast, if K+ is released first, slippage of a partially loaded transporter [TNaCl] at fo/fi could account for the reduced amount of Na+ transported, compared with K+.
By allowing the translocation of partially loaded transporters, the present results could call into question the electroneutrality of the cotransporter. However, a careful assessment of charge movement through the cotransporter has been performed while varying the membrane potential in the squid giant axon, and no evidence for electrogenicity was ever observed (44). In addition, the possibility of electrogenicity would be contrary with the common view of the function of the Na-K-2Cl cotransporter and other SLC12 family members. Therefore, electroneutrality is conserved by allowing the complexes [TClNaClK], [TClNa], and the free transporter [T] to translocate, and strictly keeping the ei, eo, hi, ho rate constants to zero.
Based on Fig. 3, the most likely scenario is that atypical K+ movement under kinase stimulation occur via a partially loaded (gi/fo and fi/go) transporter. Interestingly, the lack of extra Cl− movement under hypertonic stimulation suggests that the extra K+ movement occurs only via the loaded transporter (gi/go), which is equivalent to exchanging K+. Finally, as indicated in Fig. 3, a full transport cycle (gi/ko) allows the release of a Na+ ion, which triggers the release of the second Cl− ion.
In summary, our study has demonstrated that the transport kinetics for stimulated NKCC1 as measured in Xenopus laevis oocytes are more complex than the classical 1Na+:1K+:2Cl− ratio, first demonstrated by Geck et al. (21) in Ehrlich ascites tumor cells. In fact, stoichiometry of NKCC1-mediated unidirectional transport of Na+, K+, and Cl− is differentially affected by extracellular osmolarity and phosphoregulation. Inconsistent unidirectional stoichiometries are due to partial transport reactions, which result in K+ and Cl− movement without the release of Na+ and the second Cl−. Indeed, binding of the ions to the transporter might be such that the binding of an anion is obligatory for the binding of each cation (i.e., K-Cl and Na-Cl), thus respecting electroneutrality. Our work also demonstrates that hypertonicity significantly increases the binding affinity of the cotransporter for one of the two Cl− ions. Finally, because our kinetics indicate that the cotransporter moves K+ and/or Cl− through partial reactions, a rearrangement of the binding and release order of the Na-K-2Cl cotransporter is necessary. In Fig. 3, we illustrate how translocation of a partially loaded (gi/fo) and (fi/go) carrier can explain the atypical stoichiometry observed in both this and previous studies (8, 23, 31, 38, 43), as the movement of extra K+ and Cl−, which masks the true 1Na+:1K+:2Cl− stoichiometry of the cotransporter.
DISCLOSURES
No conflicts of interest, financial or otherwise, are declared by the author(s).
REFERENCES
- 1. Aiton JF, Brown CD, Ogden P, Simmons NL. K+ transport in “tight” epithelial monolayers of MDCK cells. J Membr Biol 65: 99–109, 1982 [DOI] [PubMed] [Google Scholar]
- 2. Baudouin-Legros M, Brouillard F, Cougnon M, Tondelier D, Leclerc T, Edelman A. Modulation of CFTR gene expression in HT-29 cells by extracellular hyperosmolarity. Am J Physiol Cell Physiol 278: C49–C56, 2000 [DOI] [PubMed] [Google Scholar]
- 3. Beck FX, Grünbein R, Lugmayr K, Neuhofer W. Heat shock proteins and the cellular response to osmotic stress. Cell Physiol Biochem 10: 303–306, 2000 [DOI] [PubMed] [Google Scholar]
- 4. Benjamin BA, Johnson EA. A quantitative description of the Na-K-2Cl cotransporter and its conformity to experimental data. Am J Physiol Renal Physiol 273: F473–F482, 1997 [DOI] [PubMed] [Google Scholar]
- 5. Brock TA, Brugnara C, Canessa M, Gimbrone MAJ. Bradykinin and vasopressin stimulate Na+-K+-Cl− cotransport in cultured endothelial cells. Am J Physiol Cell Physiol 250: C888–C895, 1986 [DOI] [PubMed] [Google Scholar]
- 6. Brumback AC, Staley KJ. Thermodynamic regulation of NKCC1-mediated Cl− cotransport underlies plasticity of GABAA signaling in neonatal neurons. J Neurosci 28: 1301–1312, 2008 [DOI] [PMC free article] [PubMed] [Google Scholar]
- 7. Burg MB, Ferraris JD, Dmitrieva NI. Cellular response to hyperosmotic stresses. Physiol Rev 87: 1441–1474, 2007 [DOI] [PubMed] [Google Scholar]
- 8. Canessa M, Brugnara C, Cusi D, Tosteson DC. Modes of operation and variable stoichiometry of the furosemide-sensitive Na and K fluxes in human red cells. J Gen Physiol 87: 113–142, 1986 [DOI] [PMC free article] [PubMed] [Google Scholar]
- 9. Caruccio L, Bae S, Liu AY, Chen KY. The heat-shock transcription factor HSF1 is rapidly activated by either hyper- or hypo-osmotic stress in mammalian cells. Biochem J 327: 341–347, 1997 [DOI] [PMC free article] [PubMed] [Google Scholar]
- 10. Cha S. A simple method for derivation of rate equations for enzyme-catalyzed reactions under the rapid equilibrium assumption or combined assumptions of equilibrium and steady state. J Biol Chem 243: 820–825, 1968 [PubMed] [Google Scholar]
- 11. Delpire E, Gagnon KB, Ledford J, Wallace J. Housing and husbandry of Xenopus laevis impact the quality of oocytes for heterologous expression studies. J Am Assoc Lab An Sci 50: 46–53, 2011 [PMC free article] [PubMed] [Google Scholar]
- 12. Delpire E, Lauf PK. Kinetics of Cl-dependent K fluxes in hyposmotically low K sheep erythrocytes. J Gen Physiol 97: 173–193, 1991 [DOI] [PMC free article] [PubMed] [Google Scholar]
- 13. Dmitrieva N, Kultz D, Michea L, Ferraris J, Burg M. Protection of renal inner medullary epithelial cells from apoptosis by hypertonic stress-induced p53 activation. J Biol Chem 275: 18243–18247, 2000 [DOI] [PubMed] [Google Scholar]
- 14. Ericson AC, Spring KR. Volume regulation by Necturus gallbladder: apical Na+-H+ and Cl−-HCO−3 exchange. Am J Physiol Cell Physiol 243: C146–C150, 1982 [DOI] [PubMed] [Google Scholar]
- 15. Ferraris JD, Burg MB. Tonicity-dependent regulation of osmoprotective genes in mammalian cells. Contrib Nephrol 152: 125–141, 2006 [DOI] [PubMed] [Google Scholar]
- 16. Ferrell CM, Lauf PK, Wilson BA, Adragna NC. Lithium and protein kinase C modulators regulate swelling-activated K-Cl cotransport and reveal a complete phosphatidylinositol cycle in low K sheep erythrocytes. J Membr Biol 177: 81–93, 2000 [DOI] [PubMed] [Google Scholar]
- 17. Gagnon KB, Delpire E. Molecular determinants of hyperosmotically activated NKCC1-mediated K+/K+ exchange. J Physiol (Lond) 588: 3385–3396, 2010 [DOI] [PMC free article] [PubMed] [Google Scholar]
- 18. Gagnon KB, Delpire E. On the substrate recognition and negative regulation of SPAK, a kinase modulating Na+-K+-2Cl− cotransport activity. Am J Physiol Cell Physiol 299: C614–C620, 2010 [DOI] [PMC free article] [PubMed] [Google Scholar]
- 19. Gagnon KB, England R, Delpire E. Volume sensitivity of cation-chloride cotransporters is modulated by the interaction of two kinases: SPAK and WNK4. Am J Physiol Cell Physiol 290: C134–C142, 2006 [DOI] [PubMed] [Google Scholar]
- 20. Gamba G. Molecular physiology and pathophysiology of electroneutral cation-chloride cotransporters. Physiol Rev 85: 423–493, 2005 [DOI] [PubMed] [Google Scholar]
- 21. Geck P, Pietrzyk C, Burckhardt BC, Pfeiffer B, Heinz E. Electrically silent cotransport of Na+, K+ and Cl− in Ehrlich cells. Biochim Biophys Acta 600: 432–447, 1980 [DOI] [PubMed] [Google Scholar]
- 22. Gilles R, Delpire E. Variations in salinity, osmolarity, and water availability: vertebrates and invertebrates. In: Handbook of Physiology: Comparative Physiology, Bethesda, MD: Am. Physiol. Soc, 1997, sect. 13, vol. II, chapt. 22, p. 1523–1586 [Google Scholar]
- 23. Hall AC, Ellory JC. Measurement and stoichiometry of bumetanide-sensitive (2Na:1K:3Cl) cotransport in ferret red cells. J Membrane Biol 85: 205–213, 1985 [DOI] [PubMed] [Google Scholar]
- 24. Jensen BS, Jessen F, Hoffmann EK. Na+, K+, Cl− cotransport and its regulation in Ehrlich ascites tumor cells. Ca2+/calmodulin and protein kinase C dependent pathways. J Membrane Biol 13161–13178, 1993 [DOI] [PubMed] [Google Scholar]
- 25. Kahle KT, Staley KJ, Nahed BV, Gamba G, Hebert SC, Lifton RP, Mount DB. Roles of the cation-chloride cotransporters in neurological disease. Nat Clin Pract Neurol 4: 490–503, 2008 [DOI] [PubMed] [Google Scholar]
- 26. King EL, Altman C. A schematic method of deriving the rate laws for enzyme-catalyzed reactions. J Phys Chem 60: 1375–1378, 1956 [Google Scholar]
- 27. Kort JJ, Koch G. The Na+,K+,2Cl− cotransport system in HeLa cells: aspects of its physiological regulation. J Cell Physiol 145: 253–261, 1990 [DOI] [PubMed] [Google Scholar]
- 28. Lauf PK, Bauer J, Adragna NC, Fujise H, Zade-Oppen AMM, Ryu K, Delpire E. Erythrocyte K-Cl cotransport: properties and regulation. Am J Physiol Cell Physiol 263: C917–C932, 1992 [DOI] [PubMed] [Google Scholar]
- 29. Lauf PK, McManus TJ, Haas M, Forbush B, 3rd, Duhm J, Flatman PW, Saier MH, Jr, Russell JM. Physiology and biophysics of chloride and cation cotransport across cell membranes. Fed Proc 46: 2377–2394, 1987 [PubMed] [Google Scholar]
- 30. Lytle C. Activation of the avian erythrocyte Na-K-Cl cotransport protein by cell shrinkage, cAMP, fluoride, and calyculin-A involves phosphorylation at common sites. J Biol Chem 272: 15069–15077, 1997 [DOI] [PubMed] [Google Scholar]
- 31. Lytle C. A volume-sensitive protein kinase regulates the Na-K-2Cl cotransporter in duck red blood cells. Am J Physiol Cell Physiol 274: C1002–C1010, 1998 [DOI] [PubMed] [Google Scholar]
- 32. Lytle C, McManus TJ, Haas M. A model of Na-K-2Cl cotransport based on ordered ion binding and glide symmetry. Am J Physiol Cell Physiol 274: C299–C309, 1998 [DOI] [PubMed] [Google Scholar]
- 33. Marcano M, Yang HM, Nieves-Gonzalez A, Clausen C, Moore LC. Parameter estimation for mathematical models of NKCC2 cotransporter isoforms. Am J Physiol Renal Physiol 296: F369–F381, 2009 [DOI] [PMC free article] [PubMed] [Google Scholar]
- 34. Matthews JB, Smith JA, Mun EC, Sicklick JK. Osmotic regulation of intestinal epithelial Na+-K+-Cl− cotransport: role of Cl− and F-actin. Am J Physiol Cell Physiol 274: C697–C706, 1998 [DOI] [PubMed] [Google Scholar]
- 35. Miyamoto H, Ikehara T, Yamaguchi H, Hosokawa K, Yonezu T, Masuya T. Kinetic mechanism of Na+, K+, Cl−-cotransport as studied by Rb+ influx into Hela cells: effects of extracellular monovalent ions. J Membrane Biol 92: 135–150, 1986 [DOI] [PubMed] [Google Scholar]
- 36. Miyamoto H, Sakai T, Ikehara T, Kaniike K. Effect of Rb+ substituted for K+ on HeLa cells: cellular content and membrane transport of monovalent cations, and cell growth. Cell Struct Funct 3: 313–324, 1978 [Google Scholar]
- 37. O′Donnell ME, Martinez A, Sun D. Endothelial Na-K-Cl cotransport regulation by tonicity and hormones: phosphorylation of cotransport protein. Am J Physiol Cell Physiol 269: C1513–C1523, 1995 [DOI] [PubMed] [Google Scholar]
- 38. Orlov SN, Tremblay J, Hamet P. Bumetanide-sensitive ion fluxes in vascular smooth muscle cells: lack of functional Na+, K+, 2 Cl− cotransport. J Membr Biol 153: 125–135, 1996 [DOI] [PubMed] [Google Scholar]
- 39. Owen NE, Ridge KM. Mechanism of angiotensin II stimulation of Na-K-Cl cotransport of vascular smooth muscle cells. J Membr Biol 257: C629–C636, 1989 [DOI] [PubMed] [Google Scholar]
- 40. Pedersen PS, Braunstein TH, Jørgensen A, Larsen PL, Holstein-Rathlou NH, Frederiksen O. Stimulation of aquaporin-5 and transepithelial water permeability in human airway epithelium by hyperosmotic stress. Pflugers Arch 453: 777–785, 2007 [DOI] [PubMed] [Google Scholar]
- 41. Plettenberg S, Weiss EC, Lemor R, Wehner F. Subunits alpha, beta and gamma of the epithelial Na+ channel (ENaC) are functionally related to the hypertonicity-induced cation channel (HICC) in rat hepatocytes. Pflügers Arch 455: 1089–1095, 2008 [DOI] [PMC free article] [PubMed] [Google Scholar]
- 42. Roe JH, Epstein JH, Goldstein NP. A photometric method for the determination of insulin in plasma and urine. J Biol Chem 178: 839–845, 1949 [PubMed] [Google Scholar]
- 43. Russell JM. Cation-coupled chloride influx in squid axon. Role of potassium and stoichiometry of the transport process. J Gen Physiol 81: 909–925, 1983 [DOI] [PMC free article] [PubMed] [Google Scholar]
- 44. Russell JM. Chloride in the squid giant axon. Curr Top Membr Transp 22: 177–193, 1984 [Google Scholar]
- 45. Russell JM. Sodium-potassium-chloride cotransport. Physiol Rev 80: 211–276, 2000 [DOI] [PubMed] [Google Scholar]
- 46. Sadowski J, Dobrowolski L. The renal medullary interstitium: focus on osmotic hypertonicity. Clin Exp Pharmacol Physiol 30: 119–126, 2003 [DOI] [PubMed] [Google Scholar]
- 47. Sands JM, Layton HE. The physiology of urinary concentration: an update. Semin Nephrol 29: 178–195, 2009 [DOI] [PMC free article] [PubMed] [Google Scholar]
- 48. Santos BC, Chevaile A, Kojima R, Gullans SR. Characterization of the Hsp110/SSE gene family response to hyperosmolality and other stresses. Am J Physiol Renal Physiol 274: F1054–F1061, 1998 [DOI] [PubMed] [Google Scholar]
- 49. Segel IH. Enzyme Kinetics: Behavior and Analysis of Rapid Equilibrium and Steady-State Enzyme Systems. New York: Wiley, 1975 [Google Scholar]
- 50. Stein WD. Transport and Diffusion Across Cell Membranes. Orlando, FL: Academic, 1986 [Google Scholar]
- 51. Stein WD. Channels, Carriers, and Pumps: An Introduction to Membrane Transport. San Diego, CA: Academic, 1990 [Google Scholar]
- 52. Suzuki-Kerr H, Lim JC, Donaldson PJ. Purinergic receptors in the rat lens: activation of P2X receptors following hyperosmotic stress. Invest Ophthalmol Vis Sci 51: 4156–4163, 2010 [DOI] [PubMed] [Google Scholar]
- 53. Ueberschär S, Bakker-Grunwald T. Bumetanide-sensitive potassium transport and volume regulation in turkey erythrocytes. Biochim Biophys Acta 731: 243–250, 1983 [DOI] [PubMed] [Google Scholar]
- 54. Wehner F, Tinel H. Role of Na+ conductance, Na+-H+ exchange, and Na+-K+-2Cl− symport in the regulatory volume increase of rat hepatocytes. J Physiol 506: 127–142, 1998 [DOI] [PMC free article] [PubMed] [Google Scholar]
- 55. Weinstein AM. A mathematical model of rat ascending Henle limb. I. Cotransporter function. Am J Physiol Renal Physiol 298: F512–F524, 2010 [DOI] [PMC free article] [PubMed] [Google Scholar]
- 56. Whisenant N, Khademazad M, Muallem S. Regulatory interaction of ATP Na+ and Cl− in the turnover cycle of the NaK2Cl cotransporter. J Gen Physiol 101: 889–908, 1993 [DOI] [PMC free article] [PubMed] [Google Scholar]
- 57. Woo SK, Kwon HM. Adaptation of kidney medulla to hypertonicity: role of the transcription factor TonEBP. Int Rev Cytol 215: 189–202, 2002 [DOI] [PubMed] [Google Scholar]