

Abstract
Epidermal growth factor receptor (EGFR) is often overexpressed in a variety of human cancers, and its expression is associated with poor prognosis for many cancer types. However, an accurate technique to noninvasively image EGFR expression in vivo is not available in the clinical setting. In this research, an Affibody analog, anti-EGFR Ac-Cys-ZEGFR:1907, was successfully site-specifically 18F-labeled for PET of EGFR expression.
Methods
The prosthetic group N-[2-(4-18F-fluorobenzamido) ethyl] maleimide (18F-FBEM) was conjugated to Ac-Cys-ZEGFR:1907 under mild conditions (pH 7) to produce the probe 18F-FBEM-Cys-ZEGFR:1907. The binding affinity and specificity tests of 18F-FBEM-Cys-ZEGFR:1907 to EGFR were conducted using A431 cancer cells. Small-animal PET and biodistribution studies were conducted on various mice tumor xenograft models with EGFR overexpression (6 types) after injection of approximately 2.0 MBq of 18F-FBEM-Cys-ZEGFR:1907 with or without coinjection of unlabeled Ac-Cys-ZEGFR:1907 for up to 3 h after injection. A correlation study between 18F-FBEM-Cys-ZEGFR:1907 small- animal PET quantification and ex vivo Western blot analysis of tumor EGFR expression was conducted in those 6 types of tumor models.
Results
18F-FBEM-Cys-ZEGFR:1907 binds to EGFR with low nanomolar affinity (37 nM) in A431 cells. 18F-FBEM-Cys-ZEGFR:1907 rapidly accumulated in the tumor and cleared from most of the normal organs except the liver and kidneys at 3 h after injection, allowing excellent tumor–to–normal tissue contrast to be obtained. In the A431 tumor xenograft model, coinjection of the PET probe with 45 μg of Ac-Cys-ZEGFR:1907 was able to improve the tumor uptake (3.9 vs. 8.1 percentage of the injected radioactive dose per gram of tissue, at 3 h after injection) and tumor imaging contrast, whereas coinjection with 500 μg of Ac-Cys-ZEGFR:1907 successfully blocked the tumor uptake significantly (8.1 vs. 1.0 percentage of the injected radioactive dose per gram of tissue, at 3 h after injection, 88% inhibition, P < 0.05). Moderate correlation was found between the tumor tracer uptake at 3 h after injection quantified by PET and EGFR expression levels measured by Western blot assay (P = 0.007, R = 0.59).
Conclusion
18F-FBEM-Cys-ZEGFR:1907 is a novel protein scaffold–based PET probe for imaging EGFR overexpression of tumors, and its ability to differentiate tumors with high and low EGFR expression in vivo holds promise for future clinical translation.
Keywords: Affibody, cancer imaging, 18F, PET, EGFR
Epidermal growth factor receptor 1 (EGFR) is a transmembrane protein belonging to the ErbB receptor kinase family. Overexpression of EGFR has been frequently detected in a wide range of human tumors, for example, small cell lung cancer, small cell carcinoma of the head and neck, esophageal cancer, gastric cancer, gliomas, colon cancer, pancreas cancer, breast cancer, ovary cancer, bladder cancer, kidney cancer, and prostate cancer (1). Novel drugs such as cetuximab, gefitinib, erlotinib, and lapatinib have shown clinical benefits to head and neck, lung, colorectal, pancreatic, and breast cancer patients by targeting overexpressed or activated EGFR (2–4). Furthermore, the EGFR expression level is a strong prognostic indicator for head and neck, ovarian, cervical, bladder, and esophageal cancers (5,6). EGFR expression level also has moderate prognosis value for breast, colon, gastric, and endometrial cancers. Molecular imaging of EGFR is expected to find many applications, such as prognosis of cancer patients, evaluation of antitumor drug effect, and stratification of cancer patients for molecularly targeted therapy (7).
Affibody (Affibody AB) protein scaffold is based on the Z-domain scaffold derived from 1 of the IgG-binding domains of staphylococcal protein A. Affibody proteins are composed of only 58 amino acid residues, a 3-helix bundle structure. The Affibody molecule libraries can be easily constructed by randomization of 13 amino acid residues in helices 1 and 2 of the 3-helix bundle protein (8–10). Affibody binders with high affinities and specificities against a variety of desired targets, for example, EGFR, human epidermal growth factor receptor type 2 (HER2), and human serum albumin, have been quickly identified (11–14). Subsequently, anti-HER2 Affibody (represented as ZHER2) molecules have been labeled with a variety of radionuclides for imaging of tumors overexpressing HER2 in animal models (15–20). The immunogenicity study has revealed that the ZHER2 (5 injections at an interval of 3 wk, 20 μg of protein each) does not result in any immunogenicity in rats (21). Recently anti-EGFR Affibody (ZEGFR) proteins have also been labeled with 64Cu and 111In for PET and SPECT of EGFR-positive tumors in mice xenografts, respectively (22–26). Furthermore, 111In- or 68Ga-labeled ZHER2 has been successfully and safely used to image 3 breast cancer patients (27). This proof-of-principle clinical study (the first, to our knowledge) on a non–immunoglobulin-based scaffold protein, similar to many preclinical studies, clearly demonstrates that Affibody molecules are a promising new class of cancer-targeting ligands with high clinical translation ability and thus worthy of further investigation to develop probes to image different tumor targets.
In our previous research, anti-EGFR Affibody-based molecular probes, 64Cu-DOTA-Cys-ZEGFR:1907 and Cy5.5-Cys-ZEGFR:1907, were successfully prepared and found to show rapid tumor targeting ability and good tumor imaging contrast even at 1 h after injection in the EGFR-expressing A431 tumor xenograft model (24,28). These results suggest that the relatively small size of Affibody proteins generally leads to fast clearance rate, quick tumor accumulation, and a relatively short in vivo biologic half-life, which matches well with the physical half-life of 18F (110 min, emits positron (β+) particles at a maximum energy of 635 keV and average energy of 250 keV, 97% abundance), one of the most widely used PET radioisotopes in nuclear medicine clinics. Therefore, in this study, to further develop an anti-EGFR Affibody-based probe for future clinical translation, Ac-Cys-ZEGFR:1907 was site-specifically labeled with 18F by site-specific conjugation with the prosthetic group N-[2-(4-18F-fluorobenzamido) ethyl] maleimide (18F-FBEM), through the N terminus cysteine residue (Fig. 1) (29). The resulting probe, 18F-FBEM-Cys-ZEGFR:1907, was then evaluated in a variety of tumor models (A431, SAS, SQ20B, 22B, U87MG, and HT29) to study whether the PET probe can be used for imaging of EGFR-positive tumors and quantitative PET of EGFR expression in vivo.
FIGURE 1.
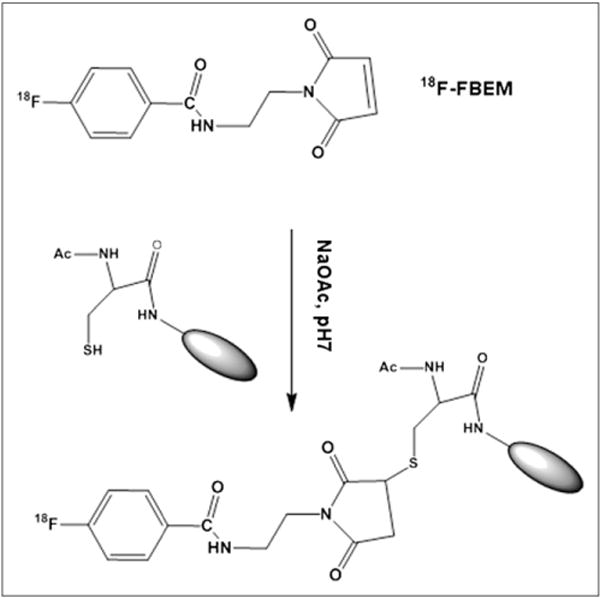
Scheme of radiosynthesis of 18F-FBEM-Cys-ZEGFR:1907.
MATERIALS AND METHODS
Chemistry and Radiochemistry
The Affibody molecule Ac-Cys-ZEGFR:1907 (Ac-CVDNKFNK-EMWAAWEEIRNLPNLNGWQMTAFIASLVDDPSQSANLLAE-AKKLNDAQAPK-NH2) was synthesized on a CS Bio CS336 instrument using a previously reported synthesis method (24,28). Purified peptide was dissolved in water, and concentration was determined by amino acid analysis (Molecular Structure Facility). Peptide purity and molecular mass were determined by analytic scale reversed-phase high-performance liquid chromatography (RP-HPLC) and matrix-assisted laser desorption/ionization–time of flight mass spectrometry (MALDI-TOF-MS) or electrospray ionization mass spectrometry. Nonradioactive 19F-FBEM-Cys-ZEGFR:1907, a reference standard, was prepared by reaction of Ac-Cys-ZEGFR:1907 with FBEM. Briefly, Ac-Cys-ZEGFR:1907 (0.07 μmol, 0.5 mg in 500 μL of sodium acetate buffer, pH 6.0, with 0.1% ascorbic acid) was mixed with 1.5 μmol of FBEM (0.36 mg in 100 μL of dimethyl sulfoxide) and reacted for 1 h at room temperature. The resulting conjugate, 19F-FBEM-Cys-ZEGFR:1907, was then purified by RP-HPLC on a semipreparative C18 column (Luna; Phenomenex) using a gradient system of solvent A (0.1% trifluoroacetic acid [TFA]/H2O) and solvent B (0.1%TFA/acetonitrile). The flow rate was 3 mL/min, with the mobile phase starting from 90% solvent A and 10% solvent B (0–3 min) to 35% solvent A and 65% solvent B at 33 min. Fractions containing the product were collected and lyophilized. The identity of 19F-FBEM-Cys-ZEGFR:1907 was confirmed by MALDI-TOF-MS.
The prosthetic group 18F-FBEM was prepared by reaction of the N-succinimidyl-4-18F-fluorobenzoate (18F-SFB) with aminoethyl-maleimide (Fig. 1). First, 18F-SFB was prepared on the basis of a recent reported procedure (30). Then 18F-SFB in 100 μL of dimethyl sulfoxide was added to amino-ethyl-maleimide (1.5 mg, in 100 μL of dimethyl sulfoxide) and 25 μL of diisopropylethylamine and reacted for 30 min at 50°C. After the addition of 30 μL of TFA to quench the reaction, the mixture was purified with the semipreparative HPLC, using the same elution gradient as for the cold FBEM purification. The eluted fractions containing the 18F-FBEM were then collected, combined, and dried using a rotary evaporator. Then 18F-FBEM was resuspended with 300 μL of NaOAc (0.1 M, 0.1% ascorbic acid, pH 7), and 100 μg of Ac-Cys-ZEGFR:1907 was added to the solution and incubated at room temperature for 40 min. The reaction solution was passed through a PD-10 column, and the radiolabeled product, 18F-FBEM-Cys-ZEGFR:1907, was eluted out with phosphate-buffered saline (PBS) (0.01 M, pH 7.4) and passed through a 0.22-μm Millipore filter into a sterile vial for cell culture and animal experiments. The radiochemical purity of 18F-FBEM-Cys-ZEGFR:1907 was then analyzed by the RP-HPLC equipped with a radioactive detector (radio-HPLC).
Cell Culture
Epithelial cancer (A431), head and neck cancer (SQ20B, SAS, and 22B), colon cancer (HT29), and glioma cancer (U87MG) cells were cultured in Dulbecco modified Eagle medium containing high glucose (Gibco), which was supplemented with 10% fetal bovine serum and 1% penicillin–streptomycin. The cells were expanded in tissue culture dishes and kept in a humidified atmosphere of 5% CO2 at 37°C. The medium was changed every other day. A confluent monolayer was detached with 0.5% trypsin-ethylenediaminetetraacetic acid, PBS (0.01 M, pH 7.4), and dissociated into a single-cell suspension for further cell culture and assays.
For the fluorescence microscopy study of ligand displacement, EGFR–high-expression A431 and SAS cells (1 × 10⁵) were cultured on the 35-mm MatTek glass bottom culture dishes. After 24 h, the cells were washed with PBS and then incubated at 37°C with Cy5.5-labeled epidermal growth factor (Cy5.5-EGF, 150 nM) for 1 h in the dark (31). EGFR binding specificity of Ac-Cys-ZEGFR:1907 in cell culture was verified by incubating the A431 and SAS cells with or without large amounts of (blocking dose) Ac-Cys-ZEGFR:1907 (10 μM). After the incubation period, cells were washed 3 times with ice-cold PBS. The fluorescence signal of the cells was recorded using an Axiovert 200 M fluorescence microscope (Carl Zeiss MicroImaging, Inc.) equipped with a Cy5.5 filter set (exciter, HQ 650/20 nm; emitter, HQ 695/35 nm). An AttoArc HBO 100W microscopic illuminator was used as a light source for fluorescence excitation. Images were taken using a thermoelectrically cooled charge-coupled device (CCD) (Micromax, model RTE/CCD-576; Princeton Instruments Inc.) and analyzed using MetaMorph software (version 6.2r4; Molecular Devices Corp.).
The receptor saturation assay of 18F-FBEM-Cys-ZEGFR:1907 was conducted with the EGFR–high-expression A431 cells. The cells (3 × 10⁵) were plated on 6-well plates 1 d before the experiment. Cells were washed with PBS 3 times. Serum-free Dulbecco modified Eagle medium (1 mL) was added to each well. The probe (8.9–532.8 kBq [0.24–14.4 μCi], 2–120 nM final concentration) with or without 100 times excess of Ac-Cys-ZEGFR:1907 was added to the wells. After the plates were put on ice for 2 h, the cells were washed with cold PBS 3 times and detached with TrypLE-Express (Invitrogen). The radioactivity of the cells was measured using a γ-counter. The data were analyzed using GraphPad Prism (GraphPad Software, Inc.), and the dissociation constant (KD) of the 18F-FBEM-Cys-ZEGFR:1907 was calculated from a 1-site-fit binding curve.
In Vitro and In Vivo Stability
18F-FBEM-Cys-ZEGFR:1907 (1.85–7.4 MBq [50–200 μCi]) was incubated in 0.5 mL of mouse serum for various times (1 or 3 h) at 37°C. At each time point, the mixture was resuspended in 0.5 mL of acetonitrile and centrifuged at 16,000g for 2 min. The supernatant containing greater than 95% of the radioactivity was filtered using a 0.2-μm nylon SpinX column (Corning Inc.). Greater than 99% of the radioactivity passed through this filter. The samples were analyzed by radio-HPLC, and the percentage of intact PET probe was determined by quantifying peaks corresponding to the intact probe and to the degradation products.
In vivo stability was determined with a procedure similar to one described previously (32). Briefly, nude mice bearing A431 tumors were injected with 18F-FBEM-Cys-ZEGFR:1907 (11.1 MBq [300 μCi]) via the tail vein and euthanized at 1 h after injection. The tumor was removed and homogenized with dimethylformamide (0.5 mL) with 1% Triton X-100 (Sigma-Aldrich). A blood sample was centrifuged immediately after collection to remove the blood cells. The plasma portion was added with dimethylformamide (0.5 mL) with 1% Triton X-100. After centrifugation, the supernatant portion was diluted with solution A (99.9% H2O with 0.1% TFA) and centrifuged again at 16,000g for 2 min with a nylon filter. The filtrate was analyzed by radio-HPLC under conditions identical to those used for analyzing the original radiolabeled peptide. Eluted fractions were collected every 30 s; the radioactivity of each fraction was measured with a γ-counter, and the resulting radio-HPLC chromatogram was plotted.
Animal Xenograft Model
All animal studies were performed in compliance with federal and local institutional rules for the conduct of animal experimentation. Approximately 5 × 10⁶ cultured A431, SQ20B, SAS, 22B, HT29, and U87MG cells were suspended in PBS/Matrigel (1:1) (BD Bioscience) or PBS alone (for A431) and subcutaneously implanted in the right shoulders of nude mice. Tumors were allowed to grow to 0.5–1.0 cm in diameter (3–6 wk) before imaging experiments.
For biodistribution studies, A431 tumor–bearing mice (n = 3 or 4 for each group) were injected with 18F-FBEM-Cys-ZEGFR:1907 (1.9–2.6 MBq [50–70 μCi], 2–3 μg) spiked with 0 or 45 μg of unlabeled Ac-Cys-ZEGFR:1907 via the tail vein. Then mice were sacrificed at 3 or 2 h after injection for 18F-FBEM-Cys-ZEGFR:1907, respectively. Moreover, tumor mice (SQ20B, SAS, 22B, HT29, and U87MG, n = 3 for each tumor model) were also injected with 18F-FBEM-Cys-ZEGFR:1907 (1.9–2.6 MBq [50–70 μCi], 2–3 μg) spiked with 45 μg of unlabeled Ac-Cys-ZEGFR:1907 via the tail vein. At 3 h after injection, mice were sacrificed and tumor and normal tissues of interest were removed and weighed and their radioactivity was measured with a γ-counter. The radioactivity uptake in the tumor and normal tissues was expressed as a percentage injected radioactive dose per gram of tissue (%ID/g). For testing of the in vivo EGFR-targeting specificity of 18F-FBEM-Cys-ZEGFR:1907, nude mice bearing A431 tumors (n = 3) were also coinjected the probe (300 μg of Ac-Cys-ZEGFR:1907) via the tail vein, and biodistribution at 3 h after injection was examined.
Small-Animal PET
Mice bearing A431 xenografts were injected with approximately 1.9–2.6 MBq (50–70 μCi) of 18F-FBEM-Cys-ZEGFR:1907 spiked with 0, 45, or 500 μg of unlabeled Ac-Cys-ZEGFR:1907 via the tail vein, and PET was performed using a small-animal PET R4 rodent model scanner (Siemens Medical Solutions USA, Inc.). At 1, 2, and 3 h after injection, mice were anesthetized with isoflurane (5% for induction and 2% for maintenance in 100% O2). Between each scan, mice were woken up to empty the bladder. With the help of a laser beam attached to the scanner, mice were placed prone and near the center of the field of view of the scanner, and 3-min static scans were obtained. For the correlation study, mice bearing SAS, SQ20B, 22B, U87MG, and HT29 xenograft tumors were injected with approximately 1.85–2.59 MBq (50–70 μCi) of 18F-FBEM-Cys-ZEGFR:1907 spiked with 45 μg of Ac-ZEGFR:1907 via the tail vein. Small-animal PET was conducted at 1, 2, and 3 h after injection. At 3 h after injection, mice were sacrificed, and the biodistribution study was performed as described. All the small-animal PET images were reconstructed by a 2-dimensional ordered-subsets expectation maximization algorithm. No background correction was performed. Region of interests (ROIs) (5 pixels for coronal and transaxial slices) were drawn over the tumor on decay-corrected whole-body coronal images. Values in 3–10 adjacent slices (depending on the size of the tissue or organ) were averaged to obtain a reproducible value of radioactivity concentration. The maximum counts per pixel per minute were obtained from the ROIs and were converted to counts per milliliter per minute using a calibration constant. ROIs were then converted to counts per gram per minute based on the assumption of a tissue density of 1 g/mL, and image ROI–derived %ID/g values were determined by dividing counts per gram per minute by injected dose. No attenuation correction was performed.
Western Blot and Correlation Study
After the small-animal PET studies and radioactivity had mostly decayed, the mice were sacrificed and the tumor tissues were harvested. Tumor tissue was extracted using radioimmunoprecipitation assay tissue protein extraction buffer, and the concentration was determined using microBCA protein assay kit (Pierce Biotechnology, Inc.). After sodium dodecyl sulfate polyacrylamide gel electrophoresis separation of 30 μg of total protein, the protein was transferred to a polyvinylidene fluoride membrane (Invitrogen Corp.) and incubated at room temperature with 5% nonfat milk blocking buffer. The blots were then incubated overnight at 4°C with anti-EGFR antibody (Cell Signaling Technology), followed by incubation at room temperature for 1 h with horseradish peroxidase–conjugated antihuman antibody (GE Healthcare). The bands were detected using the ECL Western blotting detection system (GE Healthcare). Actin was used as a loading control. After development, films were scanned with a scanner using gray-scale mode. The images were opened in ImageJ, a Java-based image-processing software. Background signal was subtracted before normalization. Three samples of each tumor model (except A431, n = 4) were prepared for Western blot to obtain semiquantitative data for statistical analysis.
Statistical Method
Statistical analysis was performed using the 2-tailed Student t test for unpaired data. A 95% confidence level was chosen to determine the significance between groups, with a P value less than 0.05 being designated as indicating a significant difference. Correlation was conducted on GraphPad Prism with the best-fit linear regression line, with a P value less than 0.05 being designated as indicating a correlation.
RESULTS
Chemistry and Radiochemistry
Ac-Cys-ZEGFR:1907 was conjugated with amino-ethylmaleimide to prepare the nonradioactive 19F-FBEM-Cys-ZEGFR:1907, which can be used as a reference for characterization of radiolabeled peptide, and the product was purified by a C4 analytic HPLC. MS analysis of the final product only showed the expected mass peak for 19F-FBEM-Cys-ZEGFR:1907. The measured molecular weight was m/z = 6,950 for [M+H]+ (calculated molecular weight [M+H]+ = 6,950.2). The recovery yield was 80% after purification, and the purity for the final product was over 95% (retention time, 28 min).
Similarly, 18F-FBEM-Cys-ZEGFR:1907 was synthesized by coupling Ac-Cys-ZEGFR:1907 with prosthetic group 18F-FBEM. Radiosynthesis and purification of 18F-FBEM-Cys-ZEGFR:1907 were completed in approximately 3 h. The maximum overall radiochemical yield with decay correction was 10% at the end of synthesis. The radiochemical purity of the labeled peptide was over 95% as verified by analytic HPLC analysis, with a specific activity of approximately 10 GBq/μmol.
In Vitro Cell Binding Assay
The binding specificity and affinity were measured in vitro using A431 cells. Blocking with a large amount of Ac-Cys-ZEGFR:1907 efficiently reduced the Cy5.5-EGF uptake by EGFR-positive cells (Fig. 2A), supporting the specific binding of Ac-Cys-ZEGFR:1907 to EGFR. Moreover, binding specificity and affinity also demonstrate that the anti-EGFR Affibody molecule Ac-Cys-ZEGFR:1907 probably shares the same binding pocket as that of the Cy5.5-EGF or these 2 molecules bind to regions close to each other on the receptor surface. The relative binding affinity of 18F-FBEM-Cys-ZEGFR:1907 to cell surface receptors was determined through receptor saturation assay. The mean ± SD of KD values of 18F-FBEM-Cys-ZEGFR:1907 is 37 ± 3 nM (Fig. 2B), which is similar to that of DOTA-Cys-ZEGFR:1907 (KD, 20 nM) and Cy5.5-Cys-ZEGFR:1907 (KD, 44 nM). These studies suggest that conjugation of 18F-FBEM moiety to the N terminus of Affibody ZEGFR:1907 through cysteine residue largely maintain its EGFR binding affinity.
FIGURE 2.
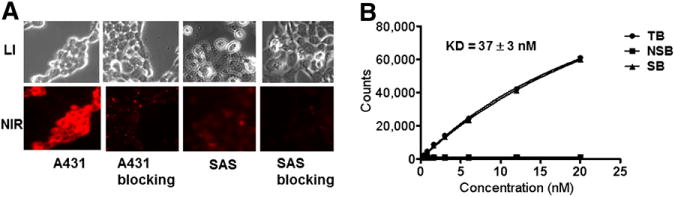
(A) Competitive binding of Ac-Cys-ZEGFR:1907 to EGFR with Cy5.5-EGF. (B) Binding affinity assay of 18F-FBEM-Cys-ZEGFR:1907 using EGFR-positive A431 cells. LI = white light; NIR = near-infrared; NSB = nonspecific binding; TB = total binding; SB = specific binding.
In Vitro Stability and Metabolite Analysis
To test serum stability, purified 18F-FBEM-Cys-ZEGFR:1907 (50 μL) was incubated in 500 μL of mouse serum at 37°C, and radio-HPLC analysis indicated that more than 90% of the probe remained intact during 1- to 3-h incubation (Figs. 3A and 3B). Next, the in vivo stability of 18F-FBEM-ZEGFR:1907 was determined using samples recovered from the tumor and plasma of A431 tumor mice injected with the probe. In plasma and tumor, 85% and 95%, respectively, of the probe remained intact at 1 h after injection (Figs. 3C and 3D). These studies demonstrate the excellent stability of 18F-FBEM-Cys-ZEGFR:1907, which provides the solid foundation for quantitative imaging of EGFR expression in vivo using this PET probe.
FIGURE 3.
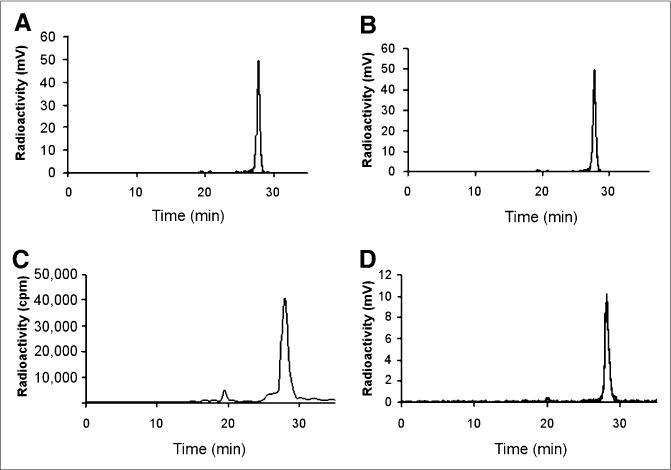
In vitro stability assay of 18F-FBEM-Cys-ZEGFR:1907 after incubation in mouse serum for 1 (A) and 3 (B) h. In vivo stability assay of 18F-FBEM-Cys-ZEGFR:1907 from samples of plasma (C) and tumor (D) at 1 h after injection.
Biodistribution Studies
The in vivo biodistribution of 18F-FBEM-Cys-ZEGFR:1907 was next determined in mice bearing A431 xenografts at 3 h after injection (Table 1). 18F-FBEM-Cys-ZEGFR:1907 displayed high accumulation in A431 tumors (3.94 ± 0.39 % ID/g at 3 h after injection). Kidney and liver uptake was 3.78 ± 0.36 and 9.28 ± 1.61 %ID/g, respectively. Lower levels of radioactivity were observed in blood (1.32 ± 0.07 %ID/g) and most other organs. For the in vivo blocking study, 18F-FBEM-Cys-ZEGFR:1907 was coinjected with a large excess (500 μg) of the unlabeled Ac-Cys-ZEGFR:1907 to saturate endogenous and overexpressed EGFR. The coinjection of Ac-Cys-ZEGFR:1907 specifically reduced the tumor uptake of 18F-FBEM-Cys-ZEGFR:1907 from 3.94 ± 0.39 to 0.97 ± 0.42 %ID/g at 3 h after injection (75% inhibition, P < 0.05), whereas the liver uptake also decreased from 9.28 ± 1.61 to 0.33 ± 0.15 (96% inhibition, P < 0.05). Kidney uptake is not significantly changed in the blocking group (3.78 ± 0.36 vs. 6.14 ± 2.87, P > 0.05). Interestingly, coinjection with a moderate dose of cold Ac-Cys-ZEGFR:1907 (45 μg) dramatically enhanced the tumor uptake of 18F-FBEM-Cys-ZEGFR:1907 by nearly 1-fold (8.06 ± 1.44 vs. 3.94 ± 0.39, P < 0.05), with increased tumor–to–all-normal-organ ratios at 3 h after injection.
TABLE 1.
Biodistribution of 18F-FBEM-Cys-ZEGFR:1907 in Nu/ν-Mice Bearing Subcutaneously Xenotransplanted A431 with Spiked Dose (Ac-Cys-ZEGFR:1907)
| Organ | Dose (μg) | ||
|---|---|---|---|
| 0 | 45 | 500, block | |
| Tumor | 3.94 ± 0.39† | 8.06 ± 1.44†* | 0.97 ± 0.42* |
| Blood | 3.75 ± 0.12† | 3.12 ± 0.10†* | 0.12 ± 0.03* |
| Heart | 0.79 ± 0.04 | 0.71 ± 0.05* | 0.06 ± 0.02* |
| Liver | 9.28 ± 1.61† | 6.50 ± 0.31†* | 0.33 ± 0.15* |
| Lungs | 1.54 ± 0.10 | 1.87 ± 0.32* | 0.14 ± 0.07* |
| Muscle | 0.32 ± 0.05 | 0.23 ± 0.05* | 0.02 ± 0.01* |
| Kidney | 3.78 ± 0.36† | 4.75 ± 0.14† | 6.14 ± 2.87 |
| Spleen | 0.61 ± 0.03 | 0.51 ± 0.07* | 0.15 ± 0.07* |
| Brain | 0.18 ± 0.07 | 0.14 ± 0.01* | 0.01 ± 0.01* |
| Intestine | 1.02 ± 0.27 | 0.75 ± 0.14* | 0.37 ± 0.37* |
| Skin | 1.12 ± 0.48 | 1.10 ± 0.10* | 0.08 ± 0.05* |
| Stomach | 1.16 ± 0.14† | 0.71 ± 0.10* † | 0.06 ± 0.03* |
| Pancreas | 0.56 ± 0.42 | 0.52 ± 0.02* | 0.04 ± 0.01* |
| Bone | 0.31 ± 0.23 | 0.41 ± 0.09* | 0.12 ± 0.04* |
| Uptake ratio | |||
| Tumor to blood | 1.05 ± 0.08† | 2.58 ± 0.47†* | 7.76 ± 1.29* |
| Tumor to lung | 2.56 ± 0.120 | 4.32 ± 0.35†* | 7.26 ± 0.43* |
| Tumor to muscle | 12.80 ± 3.32† | 36.88 ± 12.77† | 40.29 ± 2.70 |
P < 0.05, comparison of biodistribution between probe spiked with 45 and 500 μg (blocking dose) of Ac-Cys-ZEGFR:1907 at 3 h after injection.
P < 0.05, comparison of biodistribution between probe spiked with 0 and 45 μg of Ac-Cys-ZEGFR:1907 at 3 h after injection.
Data are mean ± SD, expressed as percentage administered activity (injected probe) per gram of tissue (%ID/g) after intravenous injection of probe (1.85–2.59 MBq [50–70 μCi], ~2–3 μg) spiked with 0, 45, and 500 μg of Ac-Cys-ZEGFR:1907 at 3 h after injection. Significant inhibition of 18F-FBEM-Cys-ZEGFR:1907 uptake was observed in A431 tumor of blocked group (500 μg) (P < 0.05).
A biodistribution study of 18F-FDG in the A431 tumor model was also performed at 2 h after injection. 18F-FDG showed high tumor uptake and a high tumor-to-blood ratio, but tumor-to-muscle and tumor-to-lung ratios were significantly lower than that of 18F-FBEM-Cys-ZEGFR:1907 coinjected with 45 μg of cold Ac-Cys-ZEGFR:1907 (Table 1) (P < 0.05).
18F-FBEM-Cys-ZEGFR:1907 was further evaluated in several EGFR overexpression tumor xenograft models, and biodistribution was performed at 3 h after injection. 18F-FBEM-Cys-ZEGFR:1907 displayed moderate to high tumor uptake (1.0–4.8 %ID/g) in HT29, U87MG, SQ20B, 22B, and SAS models (Fig. 4A). Uptake of the PET probe in all other organs and blood were also low except in the kidneys, lung, and liver.
FIGURE 4.
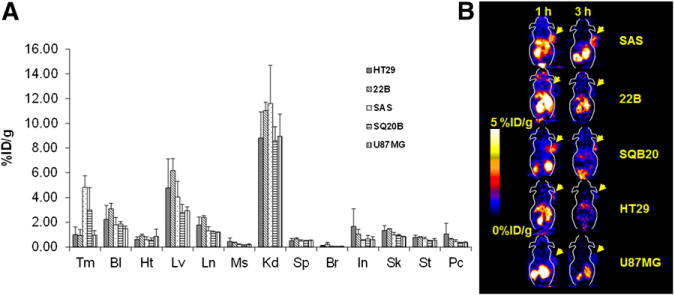
(A) Biodistribution of 18F-FBEM-Cys-ZEGFR:1907 at 3 h after injection in EGFR overexpression xenograft models (n = 3). (B) Representative 18F-FBEM-Cys-ZEGFR:1907 PET of tumor xenograft models with EGFR overexpression. Bl = blood; Br = brain; Ht = heart; In = intestine; Kd = kidney; Lv = liver; Ln = lungs; Ms = muscle; Pc = pancreas; Sk = skin; Sp = spleen; St = stomach; Tm = tumor.
Small-Animal PET
The in vivo tumor targeting and imaging profile of 18F-FBEM-Cys-ZEGFR:1907 was further investigated in A431 tumor–bearing nude mice by static small-animal PET at 1 and 3 h after tail vein injection of 1.9–2.6 MBq (50–70 μCi) of 18F-FBEM-Cys-ZEGFR:1907. Representative decay-corrected coronal small-animal PET images of nude mice bearing A431 tumors on their right shoulder at 1 and 3 h after injection are shown in Figure 5. The A431 tumor was clearly delineated with good tumor–to–contralateral-background contrast at 1 and 3 h after injection (left and right images in Fig. 5). Moreover, the coinjection of 45 μg of Ac-Cys-ZEGFR:1907 increased the tumor uptake of 18F-FBEM-Cys-ZEGFR:1907, resulting in higher tumor-to-background contrast at all time points (middle images in Fig. 5). Finally, when coinjected with 500 μg of Ac-Cys-ZEGFR:1907, tumor was barely visible. The dynamic PET scans showed that most 18F-FBEM-Cys-ZEGFR:1907 was quickly cleared through the renal–urine system, and the blood uptake dropped dramatically in the first 35 min after injection (Supplemental Fig. 1; supplemental materials are available online only at http://jnm.snmjournals.org). Small-animal PET of several EGFR-positive tumors also revealed rapid tumor targeting and accumulation of 18F-FBEM-Cys-ZEGFR:1907 as early as 1 h after injection (Fig. 4B).
FIGURE 5.
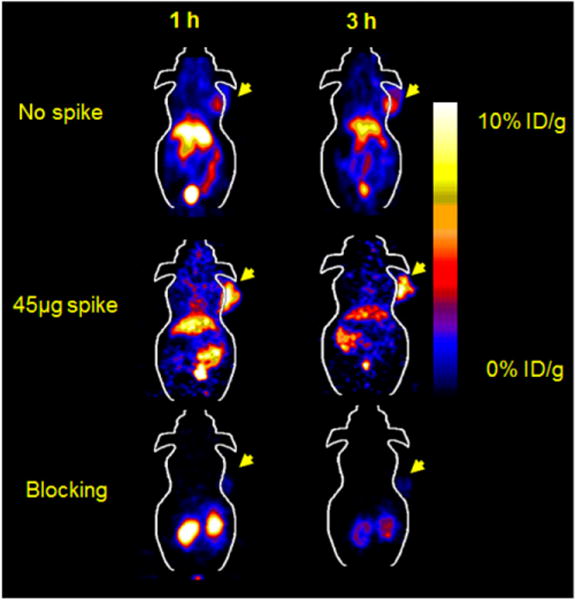
Small-animal PET of 18F-FBEM-Cys-ZEGFR:1907 in A431 xenograft model coinjected with 0, 45, and 500 μg (blocking dose) of Ac-Cys-ZEGFR:1907.
Correlation Study
Quantitative analysis of small-animal PET images at 1 and 3 h after injection was performed to obtain mean or maximum organ uptake such as tumor and liver uptake of 18F-FBEM-Cys-ZEGFR:1907. The tumor uptake or tumor-to-liver uptake ratios at different time points were then plotted against the relative EGFR expression levels measured by Western blot (normalized against actin protein) (Fig. 6A). The plots revealed that at 1 h after injection, there was a poor correlation between small-animal PET and Western assay (mean %ID/g vs. EGFR level, R = 0.37, P = 0.120), whereas at 3 h after injection, there was a moderate correlation (mean %ID/g vs. EGFR level, R = 0.59, P = 0.007) (Figs. 6B and 6C). A moderate correlation was achieved when the tumor-to-liver ratio (mean %ID/g of 18F-FBEM-Cys-ZEGFR:1907 at 3 h after injection) was used for analysis (R = 0.66, P = 0.002) (Fig. 6D).
FIGURE 6.
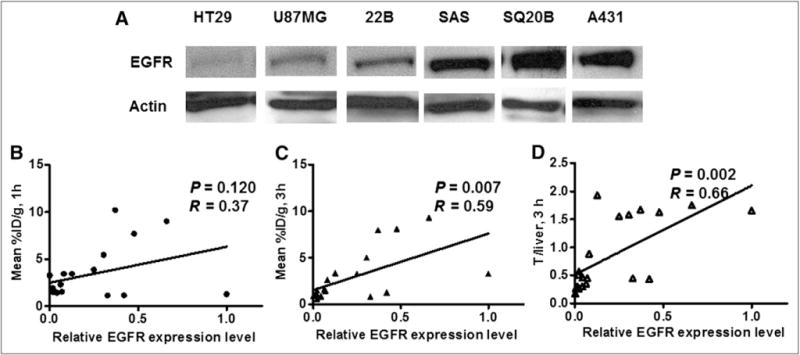
(A) Western blot quantification of EGFR expression at various tumor xenograft models. Correlation of PET quantification of tumor uptake at 1 h after injection (B) or 3 h after injection (C), or tumor-to-liver uptake ratio at 3 h after injection (D) with normalized EGFR expression level (n = 19).
DISCUSSION
Novel nonimmunogenic small protein scaffolds such as Affibody molecules have drawn a lot of attention for the development of cancer molecular imaging probes and therapeutics, because of their easy synthesis, possibility for site-specific labeling, stable structure, and high versatility targeting of various cancer biomarkers. In this research, we thus prepared the 18F-FBEM–labeled Ac-Cys-ZEGFR:1907 (Fig. 1) to develop a PET probe that had high potential for imaging EGFR expression in clinics.
Considering the short physical half-life of 18F and the relatively short biologic blood half-life of the Affibody, biodistribution and imaging studies of 18F-FBEM-Cys-ZEGFR:1907 were acquired in a short time frame (up to 3 h after injection). Consistent with our expectation, because of the excellent tumor targeting and retention ability of Affibody molecules and their rapid blood clearance, excellent tumor imaging quality of 18F-FBEM-Cys-ZEGFR:1907 was observed in EGFR-positive tumors, especially in tumors with high and moderate EGFR expression levels (Fig. 4). For example, the A431 tumor is clearly delineated from normal tissue at both 1 and 3 h after injection. Quantification of small-animal PET images shows that 80% of the activity remains in the tumor at 3 h after injection, compared with the uptake at 1 h. PET and biodistribution show that at 3 h after injection, the A431 tumor uptake of 18F-FBEM-Cys-ZEGFR:1907 (spiked with 45 μg of Ac-Cys-ZEGFR:1907) can even achieve approximately 8 %ID/g (Table 1). Interestingly, quantification also found that the tumor-to-background contrasts of the 18F-FBEM-Cys-ZEGFR:1907 can be improved significantly with the increase of time (1–3 h). In addition, coinjection with 45 μg of Affibody dramatically increased the tumor uptake and the imaging quality. The tumor-to-blood ratio also increased from 1.05 to 2.58 at 0.5 h (Table 1). These results are in sharp contrast with the slow accumulation and tumor imaging properties of monoclonal antibody–based probes, which generally display a tumor-to-blood ratio of only 0.5 at 1 d and 1.5 at 4 d after injection of the probe in a A431 xenograft model (33,34). Finally, the tumor uptake can be specifically blocked by the large dose of cold Affibody, proving the in vivo tumor-targeting specificity of 18F-FBEM-Cys-ZEGFR:1907.
On the basis of the imaging and biodistribution study, 18F-FBEM-Cys-ZEGFR:1907 exhibits rather low accumulations in most normal organs. Although the kidney and liver show the highest uptake because they are the major organs of metabolism, and the liver also has high expression level of EGFR (24). Dynamic scanning of 18F-FBEM-Cys-ZEGFR:1907 coinjected with 45 μg of Ac-Cys-ZEGFR:1907 reveals rapid clearance of the probe from the blood in the first 35 min after injection. The kidney uptake reaches a peak at about 20 min and rapidly decreases after that (Supplemental Fig. 1). Biodistribution verifies that 18F-FBEM-Cys-ZEGFR:1907, compared with radiometal-labeled ZEGFR:1907, exhibits significantly reduced accumulation in the kidneys (~200 %ID/g vs. 4 %ID/g at 3 h). Even in the liver, 18F-FBEM-Cys-ZEGFR:1907displays only around 6 % ID/g at 3 h after injection, which is much lower than with 64Cu-labeled DOTA-ZEGFR:1907 (13.3 %ID/g at 4 h) (35), allowing the possibility of the detection of tumor metastasis in the abdomen region. Moreover, low radioactivity was found in the lung region. This result is in agreement with previous data indicating that the normal lung tissue expresses low EGFR (1). The low uptake of 18F-FBEM-Cys-ZEGFR:1907 in the lung region offers considerable advantages for this PET probe to identify primary or metastatic lung tumors expressing EGFR. Low activity was also observed in the brain (Table 1), suggesting that 18F-FBEM-Cys-ZEGFR:1907 does not behave like epidermal growth factor (EGF) and cannot penetrate through the blood–brain barrier. However, 18F-FBEM-Cys-ZEGFR:1907 could potentially be used for imaging of glioma because it often overexpresses EGFR and the blood–brain barrier could be disrupted. Overall, these results suggest 18F-FBEM-Cys-ZEGFR:1907 possesses excellent pharmacokinetics and is suitable for in vivo imaging of EGFR-positive tumor and EGFR expression.
It is well known that EGFR phosphorylation caused by ligand stimulation or dimerizations with other EGFR family proteins such as HER2 could trigger much downstream signaling of cell proliferation, apoptosis, and metastasis (3,6). Thus, EGFR expression level has a prognostic value except in a few cancers, such as non–small cell lung cancer, for which EGFR mutation is more significant (36,37). 131I-labeled small protein recombinant human EGF has been successfully used to image lung cancer in a clinical study (38). However, human EGF is not an ideal protein scaffold for PET probe development because of the potent biologic effect of EGF when a large amount of the protein is administered in a short time (>10 μg/h) (38). Our results show that Ac-Cys-ZEGFR:1907 competes with EGF for the same binding pocket of EGFR, and it also did not cause any toxicity to the A431 and SAS cells at even 10 μM (Fig. 2A). Considering that the anti-HER2 Affibody has been safely used in the clinic for imaging of patients with PET and SPECT (40), Ac-Cys-ZEGFR:1907–based molecular probes such as 18F-FBEM-Cys-ZEGFR:1907 are likely to have high clinical translation ability.
18F-FBEM-Cys-ZEGFR:1907 shows excellent in vivo stability and stays almost intact in the tumor and blood at 1 h after injection (>90% fraction), warranting its use for the imaging of EGFR expression. However, this probe also has a slightly high blood-pool uptake (at 3 h after injection, >3 %ID/g, Table 1); thus, highly vascularized tumors could show better tumor PET quality because more 18F-FBEM-Cys-ZEGFR:1907 is nonspecifically perfused and trapped inside the tumor at early time points after injection. Therefore, at 1 h after injection, there is a poor correlation between tumor uptake and EGFR expression level (P = 0.120 and 0.086 using mean and maximum value of uptake, respectively) (Fig. 6B; Supplemental Fig. 2A). However, at 3 h after injection, a moderate correlation between 18F-FBEM-Cys-ZEGFR:1907 PET quantification and EGFR protein expression was observed (mean, R = 0.59, P = 0.007; tumor to liver, R = 0.66, P = 0.002) using a few types of EGFR-positive tumor models. Uptake of 18F-FBEM-Cys-ZEGFR:1907 by tumors with high EGFR expression (A431, SQ20B, and SAS) is higher than that by tumors with low EGFR expression (U87MG, HT29, and 22B). Other factors that affect uptake of 18F-FBEM-Cys-ZEGFR:1907, such as different tumor vascularity and necrosis, could potentially be corrected by 15O-water blood flow testing and multimodality PET/CT and PET/MRI.
In addition, even though the binding affinity of 18F-FBEM-Cys-ZEGFR:1907 is lower than that of many monoclonal antibody–based probes (usually in single-digit nanomolar affinity), the binding affinity could be improved by maturation of EGFR Affibody and multimerization of Affibody (21,25). The pharmacokinetics could also be further improved using linkers or different 18F-labeling approaches such as PEGylation and 18F-AlF radiolabeling (39,40).
CONCLUSION
Anti-EGFR Affibody Ac-Cys-ZEGFR:1907 was for the first time, to our knowledge, successfully site-specifically radio-labeled with 18F. 18F-FBEM-Cys-ZEGFR:1907 shows favorable in vivo profiles and excellent tumor imaging quality. Ac-Cys-ZEGFR:1907 is a promising PET probe for imaging EGFR-positive tumors and EGFR expression level. It has high clinical translational ability and will likely find broad applications in EGFR-targeted patient therapy and management.
Supplementary Material
Acknowledgments
We thank Dr. Frederick Chin and the team at the radiochemistry facility for 18F production. This work was supported, in part, by the Department of Radiology, Stanford University, and the National Cancer Institute (NCI) 5R01 CA119053. No other potential conflict of interest relevant to this article was reported.
References
- 1.Real FX, Rettig WJ, Chesa PG, Melamed MR, Old LJ, Mendelsohn J. Expression of epidermal growth factor receptor in human cultured cells and tissues: relationship to cell lineage and stage of differentiation. Cancer Res. 1986;46:4726–4731. [PubMed] [Google Scholar]
- 2.Burris HA., 3rd Dual kinase inhibition in the treatment of breast cancer: initial experience with the EGFR/ErbB-2 inhibitor lapatinib. Oncologist. 2004;9(suppl 3):10–15. doi: 10.1634/theoncologist.9-suppl_3-10. [DOI] [PubMed] [Google Scholar]
- 3.Geyer CE, Forster J, Lindquist D, et al. Lapatinib plus capecitabine for HER2-positive advanced breast cancer. N Engl J Med. 2006;355:2733–2743. doi: 10.1056/NEJMoa064320. [DOI] [PubMed] [Google Scholar]
- 4.Jones HE, Goddard L, Gee JM, et al. Insulin-like growth factor-I receptor signalling and acquired resistance to gefitinib (ZD1839; Iressa) in human breast and prostate cancer cells. Endocr Relat Cancer. 2004;11:793–814. doi: 10.1677/erc.1.00799. [DOI] [PubMed] [Google Scholar]
- 5.DiGiovanna MP, Stern DF, Edgerton SM, Whalen SG, Moore D, 2nd, Thor AD. Relationship of epidermal growth factor receptor expression to ErbB-2 signaling activity and prognosis in breast cancer patients. J Clin Oncol. 2005;23:1152–1160. doi: 10.1200/JCO.2005.09.055. [DOI] [PubMed] [Google Scholar]
- 6.Nicholson RI, Gee JM, Harper ME. EGFR and cancer prognosis. Eur J Cancer. 2001;37(suppl 4):S9–S15. doi: 10.1016/s0959-8049(01)00231-3. [DOI] [PubMed] [Google Scholar]
- 7.Pantaleo MA, Nannini M, Maleddu A, et al. Experimental results and related clinical implications of PET detection of epidermal growth factor receptor (EGFr) in cancer. Ann Oncol. 2009;20:213–226. doi: 10.1093/annonc/mdn625. [DOI] [PubMed] [Google Scholar]
- 8.Miao Z, Levi J, Cheng Z. Protein scaffold-based molecular probes for cancer molecular imaging. Amino Acids. 2011;41:1037–1047. doi: 10.1007/s00726-010-0503-9. [DOI] [PMC free article] [PubMed] [Google Scholar]
- 9.Nilsson FY, Tolmachev V. Affibody molecules: new protein domains for molecular imaging and targeted tumor therapy. Curr Opin Drug Discov Devel. 2007;10:167–175. [PubMed] [Google Scholar]
- 10.Orlova A, Feldwisch J, Abrahmsen L, Tolmachev V. Update: affibody molecules for molecular imaging and therapy for cancer. Cancer Biother Radiopharm. 2007;22:573–584. doi: 10.1089/cbr.2006.004-U. [DOI] [PubMed] [Google Scholar]
- 11.Ahlgren S, Orlova A, Rosik D, et al. Evaluation of maleimide derivative of DOTA for site-specific labeling of recombinant affibody molecules. Bioconjug Chem. 2008;19:235–243. doi: 10.1021/bc700307y. [DOI] [PubMed] [Google Scholar]
- 12.Wikman M, Steffen AC, Gunneriusson E, et al. Selection and characterization of HER2/neu-binding affibody ligands. Protein Eng Des Sel. 2004;17:455–462. doi: 10.1093/protein/gzh053. [DOI] [PubMed] [Google Scholar]
- 13.Grönwall C, Snelders E, Palm AJ, Eriksson F, Herne N, Stahl S. Generation of Affibody ligands binding interleukin-2 receptor alpha/CD25. Biotechnol Appl Biochem. 2008;50:97–112. doi: 10.1042/BA20070261. [DOI] [PubMed] [Google Scholar]
- 14.Wikman M, Rowcliffe E, Friedman M, et al. Selection and characterization of an HIV-1 gp120-binding affibody ligand. Biotechnol Appl Biochem. 2006;45:93–105. doi: 10.1042/BA20060016. [DOI] [PubMed] [Google Scholar]
- 15.Engfeldt T, Orlova A, Tran T, et al. Imaging of HER2-expressing tumours using a synthetic Affibody molecule containing the 99mTc-chelating mercaptoacetyl-glycyl-glycyl-glycyl (MAG3) sequence. Eur J Nucl Med Mol Imaging. 2007;34:722–733. doi: 10.1007/s00259-006-0266-4. [DOI] [PubMed] [Google Scholar]
- 16.Kramer-Marek G, Kiesewetter DO, Martiniova L, Jagoda E, Lee SB, Capala J. [18F]FBEM-Z(HER2:342)-Affibody molecule-a new molecular tracer for in vivo monitoring of HER2 expression by positron emission tomography. Eur J Nucl Med Mol Imaging. 2008;35:1008–1018. doi: 10.1007/s00259-007-0658-0. [DOI] [PMC free article] [PubMed] [Google Scholar]
- 17.Namavari M, Padilla De Jesus O, Cheng Z, et al. Direct site-specific radiolabeling of an Affibody protein with 4-[18F]fluorobenzaldehyde via oxime chemistry. Mol Imaging Biol. 2008;10:177–181. doi: 10.1007/s11307-008-0142-7. [DOI] [PMC free article] [PubMed] [Google Scholar]
- 18.Orlova A, Magnusson M, Eriksson TL, et al. Tumor imaging using a picomolar affinity HER2 binding affibody molecule. Cancer Res. 2006;66:4339–4348. doi: 10.1158/0008-5472.CAN-05-3521. [DOI] [PubMed] [Google Scholar]
- 19.Tolmachev V, Nilsson FY, Widstrom C, et al. 111In-benzyl-DTPA-ZHER2:342, an affibody-based conjugate for in vivo imaging of HER2 expression in malignant tumors. J Nucl Med. 2006;47:846–853. [PubMed] [Google Scholar]
- 20.Tran TA, Rosik D, Abrahmsen L, et al. Design, synthesis and biological evaluation of a multifunctional HER2-specific Affibody molecule for molecular imaging. Eur J Nucl Med Mol Imaging. 2009;36:1864–1873. doi: 10.1007/s00259-009-1176-z. [DOI] [PubMed] [Google Scholar]
- 21.Ahlgren S, Orlova A, Wallberg H, et al. Targeting of HER2-expressing tumors using 111In-ABY-025, a second-generation affibody molecule with a fundamentally reengineered scaffold. J Nucl Med. 2010;51:1131–1138. doi: 10.2967/jnumed.109.073346. [DOI] [PubMed] [Google Scholar]
- 22.Friedman M, Orlova A, Johansson E, et al. Directed evolution to low nanomolar affinity of a tumor-targeting epidermal growth factor receptor-binding affibody molecule. J Mol Biol. 2008;376:1388–1402. doi: 10.1016/j.jmb.2007.12.060. [DOI] [PubMed] [Google Scholar]
- 23.Nordberg E, Orlova A, Friedman M, et al. In vivo and in vitro uptake of 111In, delivered with the affibody molecule (ZEGFR:955)2, in EGFR expressing tumour cells. Oncol Rep. 2008;19:853–857. doi: 10.3892/or.19.4.853. [DOI] [PubMed] [Google Scholar]
- 24.Miao Z, Ren G, Liu H, Jiang L, Cheng Z. Small-animal PET imaging of human epidermal growth factor receptor positive tumor with a 64Cu labeled affibody protein. Bioconjug Chem. 2010;21:947–954. doi: 10.1021/bc900515p. [DOI] [PubMed] [Google Scholar]
- 25.Tolmachev V, Friedman M, Sandstrom M, et al. Affibody molecules for epidermal growth factor receptor targeting in vivo: aspects of dimerization and labeling chemistry. J Nucl Med. 2009;50:274–283. doi: 10.2967/jnumed.108.055525. [DOI] [PubMed] [Google Scholar]
- 26.Tolmachev V, Rosik D, Wallberg H, et al. Imaging of EGFR expression in murine xenografts using site-specifically labelled anti-EGFR 111In-DOTA-Z EGFR:2377 Affibody molecule: aspect of the injected tracer amount. Eur J Nucl Med Mol Imaging. 2010;37:613–622. doi: 10.1007/s00259-009-1283-x. [DOI] [PubMed] [Google Scholar]
- 27.Baum RP, Prasad V, Muller D, et al. Molecular imaging of HER2-expressing malignant tumors in breast cancer patients using synthetic 111In- or 68Ga-labeled affibody molecules. J Nucl Med. 2010;51:892–897. doi: 10.2967/jnumed.109.073239. [DOI] [PubMed] [Google Scholar]
- 28.Miao Z, Ren G, Liu H, Jiang L, Cheng Z. Cy5.5-labeled Affibody molecule for near-infrared fluorescent optical imaging of epidermal growth factor receptor positive tumors. J Biomed Opt. 2010;15:036007. doi: 10.1117/1.3432738. [DOI] [PubMed] [Google Scholar]
- 29.Cai W, Zhang X, Wu Y, Chen X. A thiol-reactive 18F-labeling agent, N-[2-(4-18F-fluorobenzamido)ethyl]maleimide, and synthesis of RGD peptide-based tracer for PET imaging of alpha v beta 3 integrin expression. J Nucl Med. 2006;47:1172–1180. [PMC free article] [PubMed] [Google Scholar]
- 30.Tang G, Zeng W, Yu M, Kabalka G. Facile synthesis of N-succinimidyl 4-[18F] fluorobenzoate ([18F]SFB) for protein labeling. J Labelled Comp Radiopharm. 2008;51:68–71. [Google Scholar]
- 31.Ke S, Wen X, Gurfinkel M, et al. Near-infrared optical imaging of epidermal growth factor receptor in breast cancer xenografts. Cancer Res. 2003;63:7870–7875. [PubMed] [Google Scholar]
- 32.Jiang L, Miao Z, Kimura RH, et al. Preliminary evaluation of 177Lu-labeled knottin peptides for integrin receptor-targeted radionuclide therapy. Eur J Nucl Med Mol Imaging. 2011;38:613–622. doi: 10.1007/s00259-010-1684-x. [DOI] [PubMed] [Google Scholar]
- 33.Cai W, Chen K, He L, Cao Q, Koong A, Chen X. Quantitative PET of EGFR expression in xenograft-bearing mice using 64Cu-labeled cetuximab, a chimeric anti-EGFR monoclonal antibody. Eur J Nucl Med Mol Imaging. 2007;34:850–858. doi: 10.1007/s00259-006-0361-6. [DOI] [PubMed] [Google Scholar]
- 34.Nayak TK, Regino CA, Wong KJ, et al. PET imaging of HER1-expressing xenografts in mice with 86Y-CHX-A”-DTPA-cetuximab. Eur J Nucl Med Mol Imaging. 2010;37:1368–1376. doi: 10.1007/s00259-009-1370-z. [DOI] [PMC free article] [PubMed] [Google Scholar]
- 35.Cheng Z, De Jesus OP, Kramer DJ, et al. 64Cu-labeled affibody molecules for imaging of HER2 expressing tumors. Mol Imaging Biol. 2010;12:316–324. doi: 10.1007/s11307-009-0256-6. [DOI] [PMC free article] [PubMed] [Google Scholar]
- 36.Memon AA, Jakobsen S, Dagnaes-Hansen F, Sorensen BS, Keiding S, Nexo E. Positron emission tomography (PET) imaging with [11C]-labeled erlotinib: a micro-PET study on mice with lung tumor xenografts. Cancer Res. 2009;69:873–878. doi: 10.1158/0008-5472.CAN-08-3118. [DOI] [PubMed] [Google Scholar]
- 37.Yeh HH, Ogawa K, Balatoni J, et al. Molecular imaging of active mutant L858R EGF receptor (EGFR) kinase-expressing nonsmall cell lung carcinomas using PET/CT. Proc Natl Acad Sci USA. 2011;108:1603–1608. doi: 10.1073/pnas.1010744108. [DOI] [PMC free article] [PubMed] [Google Scholar]
- 38.Cuartero-Plaza A, Martinez-Miralles E, Rosell R, Vadell-Nadal C, Farre M, Real FX. Radiolocalization of squamous lung carcinoma with 131I-labeled epidermal growth factor. Clin Cancer Res. 1996;2:13–20. [PubMed] [Google Scholar]
- 39.Liu S, Liu H, Jiang H, Xu Y, Zhang H, Cheng Z. One-step radiosynthesis of 18F-AlF-NOTA-RGD for tumor angiogenesis PET imaging. Eur J Nucl Med Mol Imaging. 2011;38:1732–1741. doi: 10.1007/s00259-011-1847-4. [DOI] [PMC free article] [PubMed] [Google Scholar]
- 40.Wu Z, Li ZB, Cai W, et al. 18F-labeled mini-PEG spacered RGD dimer (18F-FPRGD2): synthesis and microPET imaging of alphavbeta3 integrin expression. Eur J Nucl Med Mol Imaging. 2007;34:1823–1831. doi: 10.1007/s00259-007-0427-0. [DOI] [PMC free article] [PubMed] [Google Scholar]
Associated Data
This section collects any data citations, data availability statements, or supplementary materials included in this article.