

Haemophilia A is an X-linked recessive disorder resulting in deficient FVIII activity that leads to moderate to severe bleeding, most notably haemarthrosis or joint bleeding. Heterozygotes for mutations in the FVIII gene (haemophilia A carriers) may exhibit an increased bleeding tendency despite plasma FVIII activity (0.41 IU mL−1 to 0.60 IU mL−1) within the range considered normal [1]. A cross-sectional study con- ducted by our team showed that 16% (n = 47, mean FVIII activity 48 IU dL−1) of haemophilia A carriers self-report joint bleeds, similar to previous estimates of haemarthrosis (8–14%) in carriers [1,2]. Furthermore, an unpublished cross-sectional study utilizing the Universal Data Collection project revealed a significant reduction in mean overall joint range of motion (ROM) in haemophilia A carriers compared to age- and BMI (body mass index)-matched historic controls.
These results suggest that the low to normal FVIII activity found in haemophilia A carriers compromises haemostasis sufficiently to cause joint bleeding in some individuals. To further elucidate the extent of joint destruction, we tested haemophilia A carriers with FVIII activity >40% of normal, and with reduced joint ROM, to determine if they have radiologic evidence of structural joint changes consistent with previous haemarthrosis as measured by the International Prophylaxis Study Group (IPSG) MRI score.
We conducted an analysis within an ongoing prospective study utilizing a cross-sectional study design. The Institutional Review Board of Vanderbilt University approved the study. Study participants were bio- logical mothers of males with haemophilia A, who receive care at Vanderbilt University. Genetically verified haemophilia A carriers age 18 to 60 years were eligible. Subjects were excluded if they had a diagnosis of another bleeding disorder, inherited or acquired thrombophilia, pregnancy or autoimmune disorder, or participated in competitive sports above the high school level. Data were collected by medical record review and input into REDCap™ (REDCap Software, Version 6.01, Nashville, TN, USA), a secure, web- based application for managing online databases. Extracted data included clinical history, laboratory evaluation, demographics and targeted joint MRI findings. Standard laboratory evaluation was performed at Vanderbilt University: prothrombin time (PT), complete blood count (CBC), activated partial thromboplastin time (PTT), FVIII activity (two-stage assay), von Willebrand factor antigen, ristocetin cofactor activity and blood type. If the patient had an illness at the time of the study visit, laboratory evaluation was deferred until clinically improved (up to 1 month) to avoid illness-related increases in FVIII activity. All participants had normal CBC, PT, PTT and von Willebrand studies.
Active and passive joint ROM was measured for five bilateral joints (shoulders, elbows, hips, knees and ankles) by a physical therapist according to guidelines provided by the Center for Disease Control and Prevention (www.cdc.gov). Subject position was standardized for each of the joint ROM measurements as follows: sitting for ankle dorsiflexion and plantar flex- ion and elbow pronation and supination; supine for knee and elbow flexion, extension, and hyperextension and for hip and shoulder flexion; and side lying for hip extension. Each joint was moved actively and passively to full extent, and end-point measurements to the nearest degree were made with a standard goniometer [3].
Non-contrasted joint MRI with a T2*-weighted gradient recalled echo sequence in three planes was per- formed on any joint with >10% active or passive joint ROM asymmetry or reduced joint ROM compared to age- and BMI- matched historic controls from The Normal Joint Study [4]. This significance threshold was determined to be clinically significant and not the result of measurement variation by a team of physical therapists at St. Jude and Vanderbilt University. Using a 3 Tesla magnet, images of the hip were acquired in multiple planes (T1-weighted coronal, axial and coronal gradient) using various echo times to bring out haemosiderin deposits. Ankle imaging included sagittal gradient sequences, while knee and elbow imaging was performed using axial and sagittal gradient sequences.
Joint abnormalities were estimated using the International Prophylaxis Study Group (IPSG) MRI score, an additive scale tallying soft tissue and osteochondral changes [4]. MRI of the affected joint was compared with MRI of the unaffected contralateral joint if avail- able. Two radiologists, blinded to the clinical history of the patient, as part of a radiology adjudication commit- tee interpreted each joint MRI individually, and the study team calculated IPSG scores. Discrepancies were discussed and consensus agreement was reached.
Ten of 30 haemophilia A carriers demonstrated reduced joint ROM and were approached for the study. Nine of the ten agreed to undergo targeted joint MRI of the affected and contralateral joint, regardless of whether it had normal joint ROM. Baseline characteristics are shown in Table 1. Haemophilia A carriers demonstrated intra-patient joint asymmetry and reduced joint ROM. Eight of nine participants demonstrated joint asymmetry in at least two joints, and all nine had bilateral decreased joint ROM in at least three of the five paired joints measured. Percent decreased passive joint ROM when compared to the contralateral joint ranged from 10% to 100%. The ankle was the most common joint to demonstrate joint ROM asymmetry (8 of 9 participants) followed by the hip (7 of 9 participants).
Table 1.
Demographic information of nine obligate adult haemophilia A carriers with reduced joint range of motion.
| Case | Age(Years) | BMI(kg/m2) | Tosetto Bleeding Score* | Self-reported Atraumatic Joint Bleed | Child Haemophilia Severity |
|---|---|---|---|---|---|
| 1 | 44 | 30.11 | 5 | Y | Severe |
| 2 | 49 | 29.66 | 8 | N | Severe |
| 3 | 37 | 28.79 | 7 | Y | Moderate |
| 4 | 44 | 25.61 | 6 | N | Severe |
| 5 | 38 | 26.25 | 4 | N | Severe |
| 6 | 49 | 29.09 | 5 | N | Severe |
| 7 | 38 | 40.74 | 10 | N | Mild |
| 8 | 35 | 32.30 | 9 | N | Severe |
| 9 | 40 | 19.23 | 3 | N | Severe |
The Tosetto bleeding score is calculated from a questionnaire assessing bleeding in 12 categories each graded from -1 to 4 with the range of grade depending on the category. Total scores can range from -3 to 45. A higher score indicates increased bleeding symptoms. A bleeding score of >3 indicates a pathologic bleeding history.
Haemophilia A carriers had structural joint changes and IPSG scores indicative of previous joint bleeding. Two participants self-reported prior haemarthoses involving an ankle, with both joints demonstrating small haemosiderin deposits and small effusions on MRI (IPSG scores of two). Eighteen paired joints (36 individual joints) underwent MRI in the nine participants. Each participant underwent MRI of two paired joints, although some had more than two joints that met criteria for joint MRI. Of joints that underwent MRI, 94% (34 of 36) had >10% active or passive asymmetric joint ROM or decreased joint ROM com- pared to historic controls. Of the joints with reduced joint ROM, 65% (22 of 34) demonstrated soft tissue and/or osteochondral changes concerning for previous joint bleeding. Two joints, both ankles, with normal joint ROM underwent MRI, and both were abnormal. IPSG scores ranged from zero to four.
Ankle MRIs demonstrated the highest percentage of joint pathology. Of 12 ankles studied, 58% (7 of 12) had haemosiderin deposition and 17% (2 of 12) had an osteochondral cyst. Hip MRI demonstrated the least pathology; however, 2 of 16 hip MRIs had an osteochondral cyst. Both elbow MRIs demonstrated small haemosiderin. Of six knee MRIs, two demonstrated haemosiderin deposition. Joint MRI results are shown in Table 2. Representative MRI images are demonstrated in the Fig. 1.
Table 2.
Joint MRI findings of multiple paired joints that exhibited reduced joint range of motion in nine adult haemophilia A carriers.
| Joint MRI | No. Participants Evaluated | No. Joints Evaluated | No. Joints with MRI Abnormality | IPSG* Score Range |
|---|---|---|---|---|
| Ankle | 6 | 12 | 11 (92%) | 0-4 |
| Elbow | 2 | 2 | 2 (100%) | 1-2 |
| Hip | 8 | 16 | 5 (31%) | 0-1 |
| Knee | 3 | 6 | 6 (100%) | 1-2 |
International Prophylaxis Study Group score is an additive scale for haemophilic arthropathy with subscores for soft tissue and osteochondral changes with a maximum of 8 points for soft tissue changes and 9 points for osteochondral changes. The higher the score, the worse the severity of joint destruction.
Figure 1.
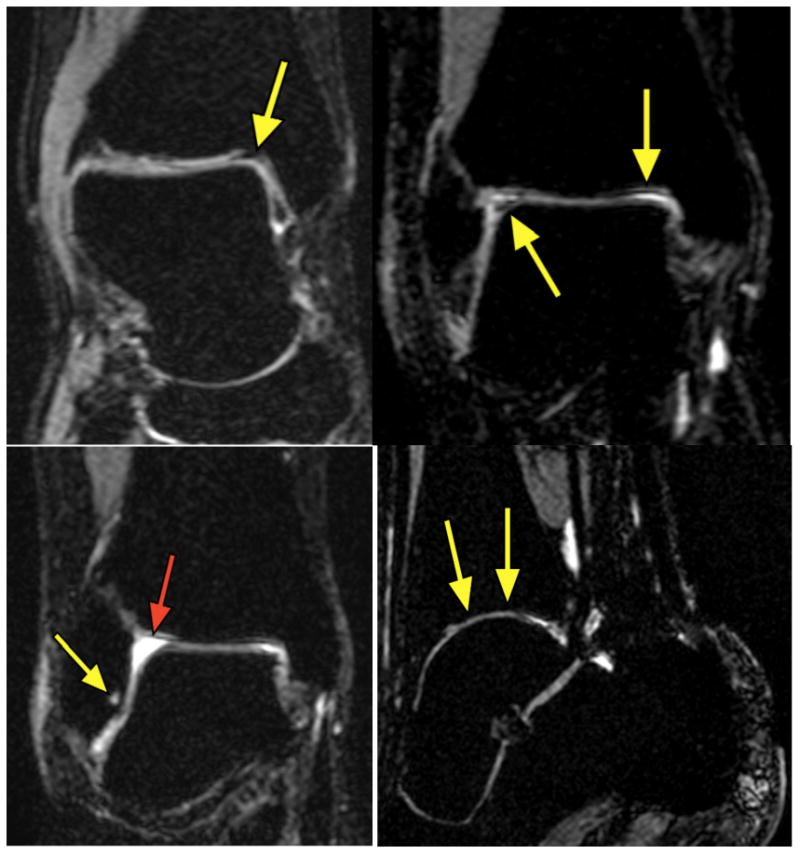
Joint MRIs of genetically verified haemophilia A carriers. Top Left: Right ankle MRI with moderate hemosiderin (arrow). Top Right: Right ankle MRI with hemosiderin deposition (arrows). Bottom Left: Right Ankle with subchondral cyst (yellow arrow) associated with joint hemorrhage and effusion (red arrow). Bottom Right: Ankle with cartilage thinning.
This is the first prospective study of joint ROM abnormalities in haemophilia carriers, and the first to look for radiologic evidence of joint bleeding. It is unlikely that joint bleeding caused by competitive sports explains our findings. Sluiter et al. evaluated 120 joints in 30 healthy adult men with frequent sports participation (≥4 times a week), and found no instances of abnormal IPSG MRI scores [5]. Similarly, Di Minno et al. reported normal joint findings utilizing both ultrasound and MRI in their normal healthy volunteers [6]. Conversely, multiple groups have reported early structural joint changes in clinically asymptomatic joints of haemophilic males. Radiologic evidence of joint damage was demonstrated in 5 of 8 joints in one cohort and in 16 of 26 joints in another cohort of asymptomatic joints in males with haemophilia [7,8]. While a causal relationship between joint bleeding due to haemophilia carriership and MRI abnormalities cannot be inferred from our data, given the inherent limitations of an observational study and absence of a control population, our data do suggest that FVIII levels in haemophilia A carriers may be low enough to contribute to joint bleeding in some individuals.
The ‘normal’ range of plasma FVIII levels used in clinical laboratories typically includes results for individuals with levels within two standard deviations of the mean for the general population (arbitrarily assigned a value of 100%, or one IU mL−1). In haemophilia A carriers, the mean FVIII level is ∼50% of the normal mean, or one half of the expected value for a group of non-carrier women. This may place these women at increased risk for bleeding. There is no reason to suspect that the low end of the laboratory normal range represents a boundary between those prone to bleeding (abnormal FVIII level) and those who are not (normal FVIII level). It is possible, and perhaps likely, that there is a continuum of bleeding phenotypes starting within the low end of the normal range and extending into the abnormal [9]. A similar scenario seems to explain the association between bleeding and von Willebrand factor levels. It should also be noted that FVIII activity increases with age, and the levels of our cohort may have been low enough when they were younger to put them at greater risk of joint bleeding than later in life.
This study corroborates findings from an unpublished study of haemophilia carriers enrolled in the Universal Data Collection project. In that study, haemophilia carriers demonstrated reduced joint ROM compared with normal women from the Normal Joint Study. The current study suggests that subclinical joint bleeding in haemophilia carriers leads to joint damage as demonstrated by soft tissue and osteochondral changes on joint MRI. The presence of MRI joint abnormalities in haemophilia A carriers warrants further investigation in the form of a multiple institution prospective study.
Acknowledgments
Funding partially supported by The Vanderbilt Clinical & Translational Research Scholars (VCTRS) KL2 Program, the Vanderbilt CTSA grant UL1 RR024975 from NCRR/NIH and by an investigator-initiated grant from Grifols. REDCap™ software supported by UL1 TR000445 from NCATSTS/NIH grants. We are grateful for physical therapy expertise of Ruth Mulvany PT, DPT, MS, Associate Professor, University of Tennessee.
Footnotes
Author contributions: Authors 1 and 7 designed the study and wrote the manuscript. Author 6 oversaw the design, study completion and contributed to the editing and revisions. Authors 2–6 helped to design the study and contributed to the editing and revisions.
Disclosure: Robert Sidonio, Jr. has participated in advisory boards for Grifols, CSL Behring, Baxter and Kedrion. The authors stated that they had no interests, which might be perceived as posing a conflict or bias.
References
- 1.Plug I, Mauser-Bunschoten EP, Brocker-Vriends AH, et al. Bleeding in carriers of hemophilia. Blood. 2006;108:52–6. doi: 10.1182/blood-2005-09-3879. Epub 2006/03/23. [DOI] [PubMed] [Google Scholar]
- 2.Mauser Bunschoten EP, van Houwelingen JC, Sjamsoedin Visser EJ, van Dijken PJ, Kok AJ, Sixma JJ. Bleeding symptoms in carriers of hemophilia A and B. Thromb Haemost. 1988;59:349–52. Epub 1988/06/ 16. [PubMed] [Google Scholar]
- 3.Soucie JM, Wang C, Forsyth A, et al. Range of motion measurements: reference values and a database for comparison studies. Haemophilia. 2011;17:500–7. doi: 10.1111/j.1365-2516.2010.02399.x. Epub 2010/11/ 13. [DOI] [PubMed] [Google Scholar]
- 4.Lundin B, Manco-Johnson ML, Ignas DM, et al. An MRI scale for assessment of haemophilic arthropathy from the International Prophylaxis Study Group. Haemophilia. 2012;18:962–70. doi: 10.1111/j.1365-2516.2012.02883.x. Epub 2012/07/07. [DOI] [PubMed] [Google Scholar]
- 5.Sluiter D, Foppen W, deKleijn P, Fischer K. Haemophilia Joint Health Score in healthy adults playing sports. Haemophilia. 2014;20(2):282–6. doi: 10.1111/hae.12290. [DOI] [PubMed] [Google Scholar]
- 6.Di Minno MN, Iervolino S, Soscia E, et al. Magnetic resonance imaging and ultrasound evaluation of “healthy” joints in young subjects with severe haemophilia A. Haemophilia. 2013;19:e167–73. doi: 10.1111/hae.12107. Epub 2013/03/ 19. [DOI] [PubMed] [Google Scholar]
- 7.Lundin B, Ljung R, Pettersson H. MRI scores of ankle joints in children with haemophilia–comparison with clinical data. Haemophilia. 2005;11:116–22. doi: 10.1111/j.1365-2516.2005.01061.x. Epub 2005/ 04/07. [DOI] [PubMed] [Google Scholar]
- 8.Olivieri M, Kurnik K, Pfluger T, Bidlingmaier C. Identification and long-term observation of early joint damage by magnetic resonance imaging in clinically asymptomatic joints in patients with haemophilia A or B despite prophylaxis. Haemophilia. 2012;18:369–74. doi: 10.1111/j.1365-2516.2011.02682.x. Epub 2011/10/29. [DOI] [PubMed] [Google Scholar]
- 9.Nichols WL, Hultin MB, James AH, et al. von Willebrand disease (VWD): evidencebased diagnosis and management guidelines, the National Heart, Lung, and Blood Institute (NHLBI) Expert Panel report (USA) Haemophilia. 2008;14:171–232. doi: 10.1111/j.1365-2516.2007.01643.x. Epub 2008/ 03/05. [DOI] [PubMed] [Google Scholar]