

Abstract
We explore the network coverage of a sample of female sex workers (FSWs) in China recruited through Respondent Drive Sampling (RDS) as part of an effort to evaluate the claim of RDS of population representation with empirical data. We take advantage of unique information on the social networks of FSWs obtained from two overlapping studies --RDS and a venue-based sampling approach (PLACE) -- and use an exponential random graph modeling (ERGM) framework from local networks to construct a likely network from which our observed RDS sample is drawn. We then run recruitment chains over this simulated network to assess the assumption that the RDS chain referral process samples participants in proportion to their degree and the extent to which RDS satisfactorily covers certain parts of the network. We find evidence that, contrary to assumptions, RDS oversamples low degree nodes and geographically central areas of the network. Unlike previous evaluations of RDS which have explored the performance of RDS sampling chains on a non-hidden population, or the performance of simulated chains over previously mapped realistic social networks, our study provides a robust, empirically grounded evaluation of the performance of RDS chains on a real-world hidden population.
Keywords: Respondent Driven Sampling, HIV, Female Sex Workers, Network Simulation, Social Networks, China
Introduction
With 780,000 people who were living with HIV by the end of 2011 [range: 620,000-940,000] (China Ministry of Health 2011), corresponding to 0.058 percent of the adult population, China is still a low HIV prevalence setting, with infections mostly concentrated in subpopulations such as female sex workers (FSWs), their clients and injecting drug users (IDUs) (China Ministry of Health 2011). A recent review of 15 studies of HIV infection among small (n<400) samples of FSWs recruited mainly by convenience sampling revealed a median prevalence rate of 0.6% and prevalence as high as 10% in samples of FSWs who inject drugs (Yan, Poon and Zhang 2011). Despite still relatively low HIV prevalence, FSWs in China are believed to display widespread risky behaviors such as large numbers of clients, low rates of condom use and lack of knowledge of HIV/STD risk behaviors (Chen et al. 2005; Hesketh et al. 2005). The role of FSWs in the progression of HIV and other STDs in China is crucial, especially at this early stage of the epidemic when sex workers may act as bridges of infection to the general population (Pirkle et al. 2007; Merli et al. 2006). These concerns are motivated by new evidence that the number of infections due to heterosexual transmission is growing (China Ministry of Health 2011) and by a very rapid increase in the incidence of other STDs, especially syphilis, both among female sex workers and the general population (Chen et al. 2007; Tucker, Chen and Peeling 2010; Tucker and Cohen 2011; Van den Hoek, et al. 2001; L. Wang et al., 2009; Q. Wang et al., 2009).
The recruitment of samples for representation of the population of FSWs in China is significant for understanding the distribution of health behaviors and health status of its members, for the identification of the most vulnerable population segments in need of interventions and for their impact on the health dynamics of the population at large. Beyond China, the importance of deriving valid estimates of population characteristics is of interest to an ongoing global debate regarding sampling methodologies of hidden and marginalized populations at risk of HIV/STDs (UNAIDS 2008).
The study of FSWs is complicated because of the difficulty to recruit samples from which inference to the population can be drawn. FSWs are a hidden population. Because of social stigma and the illegal status of sex work, FSWs are characterized by the absence of complete sampling frames which prevents the use of standard probability sampling methods. In addition to sampling challenges, the organization of sex work in China is structured around a semi-rigid hierarchy of tiers of sex work, ranging from high to low according to place where sex work is solicited, price charged per sexual transaction and socioeconomic background of clients (Yamanis et al. 2013; Chen et al. 2012; Hershatter 1997; Huang et al. 2004; Lim 1998; Parish and Pan 2006; Rogers et al. 2002; Xia and Yang 2005). High-tier sex workers solicit clients by phoning rooms in star hotels; or are the female staff of karaoke halls who accompany customers in singing, dancing and drinking and provide sexual services for additional compensation. Middle-tier sex workers include the female staff of establishments which offer commercial sex services under the guise of personal services such as bathing and massage, hair washing, beauty services, and foot cleaning. Low-tier sex workers are women who solicit clients on the streets, in parks or other public spaces, or on construction sites. This variability in the organization of sex work complicates researchers’ efforts to equally access the various strata of the population and poses significant challenges for intervention as programs sponsored by the Chinese Ministry of Health have been mainly directed at middle tier sex workers, while the hardest to reach population pockets in need of interventions remain underserved.
In recent years, Respondent Driven Sampling (RDS) (Heckathorn 1997, 2002) has become a popular sample recruitment tool for hidden and hard to reach populations. RDS uses a link tracing sampling design, similar to earlier snowball sampling (Goodman 1961) and random walk (Klovdhal 1989) approaches, but seeks to provide a probability-based inferential structure for studying hidden populations that allows one to generate unbiased estimates of population characteristics and behaviors. Relative to other methods to recruit samples of hard to reach populations, RDS has quickly, efficiently and cost-effectively recruited large, diverse samples (Robinson et al. 2006; Kendall et al. 2008; Johnston et al. 2006; Carballo-Dieguez et al. 2011). The public health community has made significant investments in this sampling approach (Lansky et al. 2007) with a large number of applications among populations at risk of acquiring and transmitting HIV/STDs such as injecting drug users, FSWs, and men who have sex with men (Malekinejad et al. 2008). However, the ability of RDS to faithfully represent hidden populations such as FSWs relies on strong, largely empirically untested assumptions regarding the unobserved participant referral process and the unobserved structure of the social network over which the RDS sampling process is running.
Here, we explore the ability of RDS to demographically and spatially cover the underlying network and to meet crucial assumptions about how participants refer other participants into the RDS sample in the context of FSWs in China. Our goal is to evaluate the performance of RDS chains on a hidden population network of the type RDS was developed to study with state-of-the-art simulations of empirical networks from sampled data. We take advantage of two concurrently implemented surveys of FSWs in Liuzhou (Guangxi Province, China), an RDS survey and a venue-based survey, to identify: (a) features of the RDS sampling process which produce imprecise descriptions of the risk profile of the hidden population; and (b) features of the network over which the RDS sampling process is running that interfere with the ability of RDS to adequately cover the network and reveal the most vulnerable population segments in need of health interventions.
Respondent Driven Sampling
In RDS, the target for representation is typically the hidden population of a well-defined geographic area or community (e.g. a city, a school, etc). RDS tracks links between members of the population who recruit other members to the sample. The sample recruitment process is initiated by the researcher administering the study through the selection of a small convenience sample of “seed” respondents known to the researchers from the population of interest. Seeds are interviewed and given a limited number of uniquely numbered coupons which they are asked to distribute to their immediate social contacts in the target population as a means of recruiting other participants from among their social networks. Members of the seeds’ social circles who receive coupons and then choose to participate in the study form the first “wave” of the sample. This process advances recursively through multiple waves until a desired sample size is reached.
The relative ease of recruiting a sample with RDS comes at the cost of stringent assumptions about the RDS sampling process and the network over which this process is running. These assumptions are required to generate unbiased estimates of population characteristics, a feature that distinguishes the RDS approach from more familiar snowball sampling methods. One can calculate inclusion probabilities (and thus sampling weights) for link-tracing designs if network structure and position of the seeds are known (Thompson 1990; Thompson and Seber 1995). Population averages are then computed by applying sampling weights to subgroup members with a higher or lower known probability of being sampled.
In RDS, the full network over which the referral process is running is not known and only a fraction of the network links of a sample unit are traced. Since nodes have variable numbers of in-ties, they have variable – but generally unknown – probability of being sampled (Frank 1977) which makes it impossible to calculate inclusion probabilities. RDS solves this problem by using the logic of a random walk on a graph as a model for the RDS referral process. If the random walk proceeds long enough, it settles into an equilibrium state (or stationary distribution) where sampling probabilities are inversely proportional to a respondent’s degree (Lovasz 1993; Lawler and Coyle 1999).
Based on the stationary distribution of a random walk and the assumption of a non-repeating, non-branching random walk, conventional RDS theory and corresponding inference (Volz and Heckathorn 2008; Salganik and Heckathorn 2004) assumes that as long as all members of the target population can be reached through the chain-referral process, an individual’s sample inclusion probability is exactly proportional to the number of reciprocal ties she has with other members of the target population (her degree), which we refer to as the sampling with probability proportional to degree (SPPD) assumption (Neely 2009). The two most commonly used RDS estimators rely on the SPPD assumption to make population proportion estimates. The S-H estimator presented in Salganik and Heckathorn (2004) is based on both the Sampling Probability Assumption and a Markov Model Maximum Likelihood Estimate (MLE) of the sampling proportions. It is estimated using cross-group recruitments and the relative probability of sampling group members, represented by an estimate of the harmonic mean degrees of each group, based on the rationale that this is exactly the Horvitz-Thompson estimator for mean degree when the probability of sampling is proportional to degree (see Thompson 2002). The V-H estimator (Volz and Heckathorn 2008) has the same form as the S-H estimator, except that the sampling proportions are estimated using the observed group proportions from the data rather than as Markov model MLE, hence the V-H only relies on the SPPD assumption. As discussed below, this estimator directly connects to conventional sampling estimation and was found to consistently outperform the S-H estimator in terms of bias and variance except when there is differential recruitment effectiveness by group (i.e. participants recruiting effectively from among their peers given available peers) in the presence of homophily when the sample fraction is small (Gile and Handcock 2010; Thomas and Gile 2011). It is also easier to compute and applies to both continuous and categorical variables.
Conventional RDS estimation procedures currently in use rely on approximated inclusion probabilities to compute sampling weights. Approximated inclusion probabilities are based on the assessment of each respondent’s degree, drawn from a question on the number of people respondents know in the target population. Thus, to estimate population means, RDS substitutes reported degrees for inclusion probabilities as follows (Volz and Heckathorn 2008):
where yi is the observed value of a trait for the ith respondent and di is the ith respondent’s self-reported degree.
Provided that the SPPD is correct, the V-H estimator is exactly equal to the generalized unequal probability Horvitz-Thompson estimator and will provide an asymptotically unbiased estimate of the population mean (Thompson 2002). This estimator attempts to compensate for what may be the tendency of the RDS chain referral strategy to over-sample individuals with large personal social networks by weighting these cases down.
The RDS literature makes a number of qualitative assumptions about the referral process and the underlying social network that are needed to justify the SPPD assumption: (a) respondents, already contacted, refer new study participants by making a uniform random selection from their immediate social circle. This condition is usually described as “non-preferential recruitment”; (b) reciprocity (the social ties between every pair of members of the population are symmetric so that, if the network consists of a single connected component, every member of the study population can be recruited by the sampling process); (c) the number of links for each individual is known, and participants can accurately report their out-degree; (d) the network must be sufficiently large (hence the sample fraction sufficiently small) so that sampling without replacement and the branching random walk which characterize the RDS sampling process can be treated as a non-branching random walk with replacement (Gile and Handcock 2010; Neely 2009).
Further complications are introduced when seeds are not selected at random. By handing out a limited number of coupons (usually two or three), RDS reduces the number of links per respondent, fostering many waves of sampling. Based on the Markov chain analogy, the chain referral process converges quickly to the stationary distribution of a first order Markov process in which sampling is proportional to degree (Lovasz 1993; Neely 2009; Mouw and Verdery 2012). Thus RDS assumes that the number of waves fostered is sufficient to decrease the dependence of the final sample on the initial convenience sample. This conclusion is critical to showing that estimates are asymptotically unbiased regardless of how the seeds are chosen (Salganik and Heckathorn 2004:222), which is much of the practical value in field-studies where random seeds are difficult to select.
Previous evaluations of RDS have quantified, with simulations of the RDS chains and of the underlying population network, the effect of deviations from assumptions (a)-(d) on the RDS estimators. These evaluations have consisted in violating assumptions about the social network structure or the sample recruitment process over theoretical or synthetic social networks and assessing impacts of these violations on the RDS estimators (Gile and Handcock 2010; Neely 2009; Lu et al. 2012). A handful of studies have empirically investigated the RDS assumptions about the unobserved social network on non-hidden populations with known characteristics (Wejnert and Heckathorn 2008; Wejnert 2009; McCreesh et al 2012), with simulations of ideal RDS chains on real-world network data sets to assess the performance of RDS estimates in ideal RDS samples simulated over different network structures observed in empirical networks (Goel and Salganik 2010; Mouw and Verdery 2012) or they have used limited or full information on participants’ recruitment behavior in empirical RDS samples to assess the robustness of conventional RDS estimators to assumptions violations (Iguchi et al. 2009; Yamanis et al. 2013). Collectively these studies have shown that (1) violation of the assumptions regarding characteristics of the underlying network and the referral process can lead to considerable bias in the RDS estimates (Tomas and Gile 2010; Gile and Handcock 2010; Iguchi et al. 2009; Neely 2009; Wejnert 2009; McCreesh et al. 2012; Yamanis et al. 2013); (2) despite the Markov chain argument, biases are still introduced by the initial non-random selection of seeds (Gile and Handcock 2010) and that any likelihood inference must consider the sampling process as well as the population model (Handcock and Gile 2011); (3) when the sampling fraction is large, as it is the case with many hidden populations, the V-H estimator is very sensitive to the with-replacement assumption and the higher degree nodes are excessively down-weighted by the proportional-to-degree estimates (Gile and Handcock 2010; Gile 2011); (4) the branching of RDS reduces the efficiency of an RDS sample vis-à-vis a non-branching random walk (Goel and Salganik 2009); and (5) the structure of real-world social networks may deviate so much from the idealized model assumed by RDS that the variance in population estimates may require sample sizes nearly ten times what has previously been assumed (Goel and Salganik 2010; Mouw and Verdery 2012). These latter two sets of findings imply that the size of RDS samples required for precision and accuracy of RDS estimates may need to be in the thousands instead of the hundreds, which is the typical size targeted by RDS samples.
In the context of FSWs in China, one can think of several reasons why the SPPD assumption may not be true. First, one knows a priori that factors in addition to degree influence whether or not members of the population are included in the sample. For example, since recruitment of FSWs might start in a venue (e.g. a karaoke bar, or a massage parlor or a street), an individual’s venue attendance is likely to influence the probability of being recruited into the sample. Second, because it is difficult to accurately assess one’s degree (Marsden 1990; Brewer 2000; McCormick, Salganik and Zheng 2010), the second stage of the approximation of inclusion probabilities can potentially be quite coarse. Third, the chain-referral process might become trapped in a particular venue, subgroup or cluster of the network, overloading the sample with members of that subgroup and holding off the chains from exploring other regions of the network, thus limiting the precision of the RDS sample. Fourth, a small population and a large sample fraction will lead to violation of the SPPD assumption (Gile and Handcock 2010; Gile 2011), although with large populations this condition does not represent a significant threat.
We evaluate whether the RDS chains meet the SPPD assumption of the conventional RDS estimators.1 The data grounding this evaluation come from the PLACE-RDS Comparison Study which was designed to compare two samples of FSWs recruited using two alternative sampling approaches, RDS and PLACE (Priorities for Local AIDS Control Efforts), with the overall goal to gauge levels and distribution of syphilis infection among FSWs in Liuzhou, a Southern Chinese city with high syphilis prevalence in the FSWs and general populations (Weir et al. 2012). PLACE is a venue based sampling approach which focuses on the systematic identification of places where people meet new sexual partners (Weir et al. 2003). Unlike previous studies comparing RDS with alternative sampling approaches (Kendall et al. 2008, Robinson et al. 2006; Burt et al. 2010; Kral et al. 2010), the PLACE and RDS surveys were concurrently implemented, had the same inclusion definition and survey protocols. The PLACE-RDS comparison study found some differences in socioeconomic characteristics and prevalence of a positive syphilis test across sampling method, although it is not clear whether differences were due to violations of assumptions underlying RDS, distributional properties of the estimators, or a combination of both (Weir et al. 2012).
Here we combine data collected in ego-centric network modules added to the PLACE and RDS protocols with new methodologies to estimate social network parameters which we use to stochastically generate the social network of Liuzhou FSWs. We then simulate multiple referral chains over this network consistent with observed and ideal RDS chains to identify systematic deviations of the actual RDS sampling process from the idealized sampling process. Substantively, our evaluation centers on one key socio-demographic attribute of FSWs in China, tier of sex work, because it is observable in the ego-centric network data and because it represents an important source of social stratification, differential risk behaviors and STD infection status among FSWs in China.
Data
The PLACE and RDS surveys were conducted between November 2009 and January 2010. RDS recruited 583 participants. Eligibility for participation in the RDS study was being at least 15 years old, first time participant and self-identified as a sex worker by responding affirmatively to the question: “Have you exchanged sex for money in the past month?.” Seven seeds were recruited by convenience and 576 peer recruits were interviewed. Participants were given two coupons to recruit other participants but this number was reduced to one coupon as the desired sample size was approached. All except one of the seven seeds recruited other participants. The six productive seeds generated between 9 and 20 recruitment waves. 310 out of 583 respondents effectively recruited other participants, while the remaining participants were not asked to recruit or (very few cases) their recruits reported for the interview after the coupon had expired and the target sample size had been reached. A primary incentive was provided for participation in the main survey interview and a secondary incentive for successfully recruiting other participants. All but two recruiting participants returned to the interview site to collect their secondary incentives, at which point they were administered aN EGOCENTRIC SOCIAL network module first piloted in an earlier RDS study of FSWs conducted in Shanghai in 2007 (Yamanis et al. 2013). The personal network size of all respondents was measured with the question: “How many female sex workers do you know in this city? By knowing, I mean: you know their names and they know yours and you have met or contacted them in the past month.” Respondents in the follow-up survey were asked the number and attributes of their invited alters (members of recruiters’ networks invited to participate who accepted or rejected the invitation) and non-invited alters (members of recruiters’ networks who were not invited to participate in the study). Questions like: “How many people who you have (not) invited to participate by offering them a coupon (have accepted/rejected it)?” were followed by questions regarding attributes of their network alters and properties and repertoire of these relationships.
PLACE was implemented concurrently with RDS with some modifications over the standard PLACE sampling design introduced to recruit a large enough sample of FSWs for comparison with the RDS sample. In Stage 1, a sampling frame of 971 unique physical venues was constructed based on information provided by 400 community informants. In Stage 2, 385 of these venues were selected for a venue visit, according to a stratified probability sampling design with strata formed according to the number of times a venue was cited by informants, geographic location and type of venue. In Stage 3, 64 venues (41 in urban districts and 23 in rural counties) were selected for venue staff’s interviews according to a stratified random sampling scheme of venues with strata formed based on the volume of sex work at the venue and accounting for the expected number of sex workers at the venue collected in Stage 2. Of these 64 venues, 45 (27 urban and 18 rural) were in operation and agreed to participate. In Stage 4, all female workers in these selected urban venues were interviewed while in rural venues a fixed number of female workers per venue were randomly selected for interview for a total of 680 venue workers interviewed at these sites. Names, addresses and GPS coordinates were collected for each venue visited. One-fourth of the female workers reported ever receiving cash or gifts in exchange for sex and 18.2% of the female workers (n=161) had done so in the last four weeks, thereby meeting the study definition for sex worker (For additional details on the PLACE sampling scheme, see Weir et al. 2012, especially online supplementary materials).
Information on size and type of venue where participants solicited clients was collected in both RDS and PLACE. All participants were asked questions on their sexual risk and preventive behaviors, health status, STD symptoms and exposure to HIV/AIDS prevention programs. Participants were also invited to provide blood samples for rapid syphilis test screening measuring lifetime history of infection. The network information on respondents and their alters in the RDS survey and information on venues and characteristics of FSWs in venues from PLACE (see Appendix Table A1) are used to inform the simulations of the network populations and the RDS chains running over it. The RDS and PLACE protocols were approved by the Research Ethics Committee of the China Center for STD Control and the Institutional Review Boards of the University of North Carolina and Duke University.
Description of the RDS sample
Tier of sex work is a key variable in our analyses and a main social organizer of sex work, as identified in previous studies of FSWs in China (Hershatter 1997; Huang et al. 2004; Parish and Pan 2006; Rogers et al. 2002; Xia and Yang 2005; Yamanis et al. 2013). In Liuzhou, in addition to FSWs who only solicited clients in high, middle and low tier venues, we also identified “not venue-based” FSWs, who reported soliciting clients only by phone, text message in the previous six months.
From Figure 1, most RDS recruitments were within tier though there was social crossover in recruitment among adjacent tiers. Excluding the 31 non-venue based FSWs, 28.4% of respondents were recruited from within the same venue where they solicited (indicated by the red edges between nodes). The largest fraction of FSWs is in the middle tier, followed by FSWs in high tier and very small fractions in low tier or non-venue-based. The size of nodes in Figure 1 is proportional to self-reported degree. High-tier FSWs have they highest degree because they work in establishments, such as karaoke halls, which typically employ a large number of workers, easily in excess of 100, and with high worker turnover. Conversely, the massage parlors and hair salons of middle tier sex workers employ on average 10-15 FSWs and can have as few as three FSWs. There is a remarkable social stratification of sex work in Liuzhou. . High tier sex workers were younger, better educated, less likely to be married or divorced and reported higher earnings from sex work, compared with FSWs in the lower tiers. Low tier sex workers were more likely to be separated or divorced and to have a history of syphilis infection. Although their infection status may be a function of their older age as the screening test measured a life-time history of infection, low tier sex workers also displayed more risky behaviors (e.g. high client turnover) (Appendix Table A2).
Figure 1. Observed RDS recruitment chains among female sex workers in Liuzhou with seeds at top and size of node proportional to SELF-REPORTED network size.

Methods
To assess whether the SPPD assumption is met among FSWs in Liuzhou, this study seeks to understand the properties of the hidden population network and of the RDS chain referral process running over it and gauge RDS chains’ spatial coverage of the underlying network. To make inference about the underlying network, we use a case control logistic regression framework and an exponential random graph model (ERGM) to generate networks probabilistically that reflect degree distribution, mean degree differences and homophily by demographic characteristics in the empirical PLACE and RDS samples. We then simulate the RDS referral process running over this empirically grounded network consistent with the observed RDS chains. Because the Liuzhou RDS study mainly covered urban areas with very limited recruitments of rural FSWs (Weir et al. 2012) and PLACE is a venue-based sampling approach, the networks are generated based on information on the urban subsamples of the PLACE and RDS surveys (129 and 570 urban FSWs were recruited in each respectively) after excluding 31 RDS participants who were not venue-based.
Seeding the population
We start by seeding a base population of FSWs with information on PLACE venues and on the characteristics of FSWs populating these venues. First we bootstrap-sample 500 urban venues consistent with the number of urban commercial sex venues estimated by the Liuzhou CDC. Venues are bootstrapped from the sample of 270 urban venues from the originally sampled 385 venues in the PLACE dataset selected for a venue visit. For each venue we have information on geographic location, tier and size (i.e. the number of FSWs working in that location). In addition to the existing 270 venues, we randomly sample 230 additional venues to generate a population of 500 venues. Because, detailed demographic information on FSWs in each urban venue is only available for the 41 urban venues selected by PLACE for worker interviews, venues with missing demographic data are assigned demographic profiles of FSWs through imputation of the distribution of marital status, age and education from FSWs in venues matched on type, district, and tier. Next, we place FSWs in venues probabilistically, according to district, age, education, tier and size of venue reported in PLACE. For example, young, high tier FSWs are placed in venues reported to be high tier and to have young FSWs. This approach maintains the correlation between demographic characteristics, tier, and physical location of venues and FSWs within venues in the PLACE data. Venue size is then adjusted to match the reported venue size, swapping FSWs from venues with too many FSWs to venues with too few—all while trying to maintain the complicated correlation structure already established in the population. We stop this swapping process designed to get the correct size distribution when the correlations in the simulated population deviates from the true values. We thus adjust the venues based on size but ultimately privilege the demographic/tier/geographic correlations when seeding the FSWs. A comparison of the characteristics of the simulated population to the estimates from the PLACE data is presented in Appendix Table A3. To preserve the realism of the simulation, we set the size of the FSW population in venues to be equal to the number of FSWs estimated by the Liuzhou CDC (7,500).
Setting up the model for simulation and simulating networks
After seeding the population of FSW in venues, we simulate social networks over the FSW population probabilistically. Specifically, we estimate the properties of the network from the ego network sample data using a case-control logistic regression model (Smith 2012; Smith, McPherson and Smith-Lovin 2013), and use an Exponential Random Graph Model (ERGM) to stochastically generate ties between pairs of FSWs in the full network (Handcock et al 2008; Goodreau et al 2009; Robins et al 2007; Robins, Pattison and Woolcock 2005; Morris et al. 2009; Smith 2012), based on parameters from a pre-specified model consistent with the social and physical contact matrix between demographic groups observed in the empirical data. This model includes homophily parameters (are demographically similar people more likely to interact?) for age, marital status, tier and physical location, as well as constraints for the degree distribution and differential degree (where some demographic groups have more social ties than others). We use STATNET simulation routines (Handcock et al. 2008) to generate networks from model parameters. We use a case-control logistic regression model to estimate the homophily parameters and to update them as the network simulation progresses to ensure that the network reflects the observed levels of homophily in the data (Smith, McPherson and Smith-Lovin 2013; Smith 2012). Case control models are common in medical research to study traits in a population that are difficult to capture through simple random sampling because they are rare (Breslow and Day 1980). These models compare cases with a condition of interest (e.g. a disease) to controls without the condition. In our particular population, the “cases” are respondent-alter dyads with a known social relationship (e.g. knowing each other) while the “controls” are a random sample of FSWs dyads, which capture random mixing in the population. These are generated by randomly pairing FSWs from the seeded population of 7,500 FSWs. The cases--dyads with a social relationship--come from the ego network data in the RDS follow-up survey; controls are formed by randomly pairing FSWs drawn from the PLACE data.
The model is estimated via a logistic regression, predicting the probability of a tie (cases=1; controls=0) as a function of the socio-demographic and geographic characteristics of i and j in each dyad. Socio-demographic terms include absolute age difference and dummy terms for tier and marital status. The dummy terms capture the rate of contact between different tier and marital status categories (e.g. the propensity for high tier and low tier FSWs to form social ties). Physical distance is captured by the geographic distance between FSWs, determined by the location of their venues. The physical and socio-demographic distance between respondents and alters is compared to the distance expected by chance, or the distance between FSW pairings in the controls. Formally, we can write the model as:
where the first term is the number of ties; the second is the absolute age difference between i and j; and the remaining socio-demographic terms capture the counts of social ties between tier and marital status categories. The last three terms capture the effect of physical distance: there is a binary term for venue, equal to 1 if i and j work in the same venue and 0 otherwise; there are also two terms capturing the physical distance between and i and j in the North/South and East/West directions.2 Parameter estimates for this model are included in the Appendix (see Table A4, column titled “PLACE Model”). In general, social ties are more likely when FSWs are of similar age and tier. Social ties are also more likely when FSWs work in the same venue and are geographically close (given they are not in the same venue).
After estimating these initial model coefficients, we simulate networks stochastically with the ERGM formula, updating coefficient estimates from this model throughout the simulation until the simulated networks are consistent with the empirical mixing rates. To ensure that the simulated networks arrive at the same level of homophily, independent of the starting coefficients, we reran the simulations based on the full set of the initial RDS model coefficients (i.e. both cases and controls are from the RDS data as per the RDS Model in Appendix Table A4). The level of homophily in the end network was almost identical to the network where PLACE data were used to construct chance expectations in the case-control logistic regression model (PLACE Model in Table A4). The proportion of ties that occur within tier is 0.895 under both simulation scenarios. In addition to accounting for the observed levels of homophily by demographic characteristics and geographic distance, the simulation also maintains the empirically observed degree distributions as the network is updated, as well as the initial correlation between demographic characteristics and degree in the PLACE data, so someone with degree 5 in the simulated network will look demographically like someone in the empirical data with 5 ties. The simulated network thus reflects the predicted relationships, based on knowing the other person, for our bootstrap sample of FSWs.
The implementation of this strategy is bounded by limitations in the data. While the effect of social distance on the probability of a tie is estimated precisely with information asked of each RDS respondent regarding the demographic attributes of her alters, the exact distance between a respondent and her alters needed to estimate the effect of geographic distance on the probability of a social tie is not known. For this reason, we simulate networks according to two different scenarios: A strong geography scenario (alters whose geographic location is reported to be further away than a 10-min walk have a higher probability of being at a 11-minute walk away) and a weak geography scenario (alters further away than a 10-min walk are spread farther into the physical space). As expected, the estimated probability of a tie is higher with closer geographic distance under both geography scenarios, but this relationship is especially strong in the strong geography scenario (Appendix Figure A1). Similarly, a strong geography scenario implies more geographic clustering in the network (Appendix Figure A2).
Since PLACE-RDS Comparison Study did not collect information on alters’ alters, we cannot estimate directly the extent of transitivity (“friend of a friend is a friend”) in the network, so the ERGM model was specified without a transitivity term. In this model, local clustering is generated by the homophily parameters for marital status, age and tier, as well as the terms for venue (are i and j in the same venue?) and geographic distance (measured by latitude and longitude). This is a reasonable assumption because homophily strongly constrains the structure of the ego network data. Social ties are (largely) restricted to within demographic groups and limited physical spaces, raising the probability of finding closed triads just by chance (see also Goodreau et al. 2009).
Simulation of the RDS Chains over the Network
To gauge whether deviation from the SPPD assumption affect the demographic and spatial coverage of the network by RDS chains, we simulate the RDS sampling process over the simulated network through stochastic replication of chains which trace links between nodes in the simulated population. We set up an experimental setting where we simulate RDS chains without replacement (i.e. RDS participants can only appear once in any given chain) under different scenarios consistent with an incremental set of key theoretical features of the RDS sampling process. Scenarios include (a) chains that mimic the size, demographics and branching structure of observed chains -- both seeds and nodes in each wave of the simulated chains have identical characteristics to those of the RDS sample; (b) chains initiated by a sample of seeds with identical characteristics as those of the RDS sample but with random recruitment of participants by other participants; (c) chains running under idealized sampling conditions consistent with the theoretical RDS literature, where the sampling process starts with an initial random sample of seeds and proceeds on a random walk through the simulated network following the branching of the Liuzhou RDS study where participants each recruit a maximum of two other participants. Scenarios are also allowed to vary by geographic constraint (strong versus weak geography) for a total of six scenarios.
The RDS sampling process under each of these scenarios is repeated 1,000 times on one network to generate a distribution of RDS chains. Our conclusions are identical regardless of whether we focus on one network generated from the model or we summarize over many networks generated from the same model. We limit the study to chains that are within a ~98% match to the observed chains and weight the final sample probability by closeness to the observed chains.3
Results
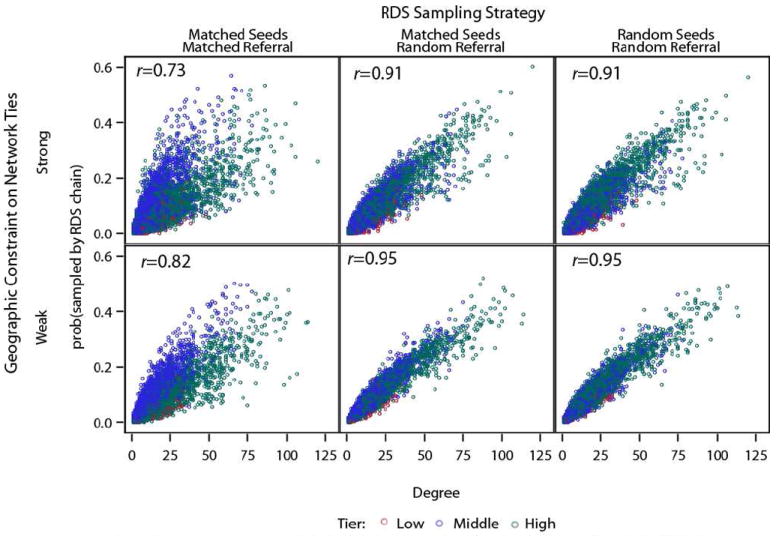
We begin by showing the impact on the SPPD assumption of possible biases in the sampling process introduced by the non-random selection of seeds and by the non-random recruitment of alters by RDS participants. For each scenario of the simulated RDS sampling process, the plots in Figure 2 compare the probability of being sampled by the RDS chain (y-axis) with the degree of a node (x axis). A linear relationship with little spread indicates sampling probability proportional to degree while non-uniform variation by degree suggests violation of the SPPD assumption. Thus the probability of being sampled is strongly correlated to degree when the RDS sampling process is consistent with the sampling conditions of random seed selection and random recruitment of participants by other participants under a random seeds/random referral scenario (r=0.98 for weak geography constraint and r=0.96 for strong). As more constraints are introduced, first by the selection of seeds allowed to mimic the actual non-random selection in the Liuzhou study (matched seeds/random referral), then with both selection of seeds and the referral process mimicking the observed RDS chains (matched seeds/matched referral), the correlation weakens and the spread widens. When both seeds and chains match the demographics of observed chains, the correlation coefficients drop to r= 0.69. Under this scenario, middle tier nodes (in blue in the plots) are disproportionately likely to be sampled by an RDS chain, in spite of their lower degree.
Figure 2. RDS Proportionality by Degree and Tier.
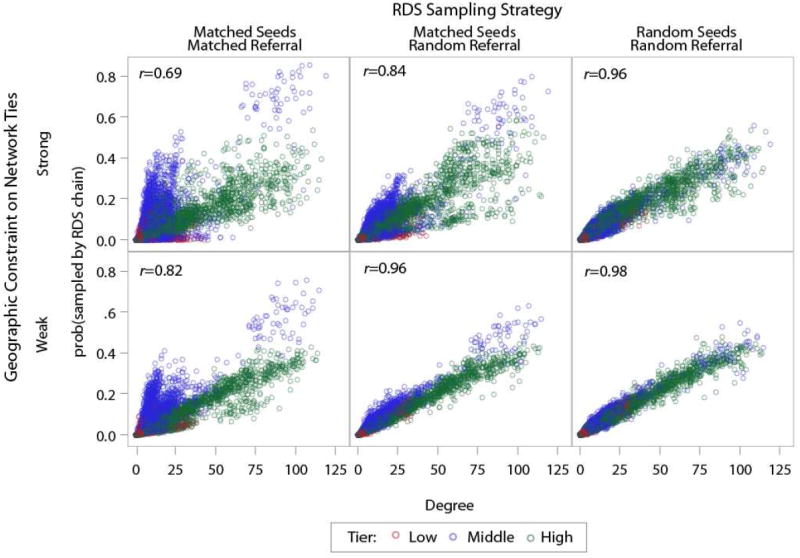
Under multiple RDS Sampling scenarios and geographic correspondence.
Simulated networks are consistent with the physical and social characteristics of the PLACE data, venue size adjusted.
To assess the robustness of the results to various specifications of the FSWs population, as a variation over the baseline where the distribution of socio-demographic characteristics used to seed the FSW population was drawn from PLACE data, we also seed the FSW population with the distribution of FSWs’ characteristics recorded in the RDS data. In this scenario, the distributions use to seed the population and the controls of the case-control logistic regression are drawn from RDS data (venues are still drawn from PLACE data). Second, as a variation over the baseline where venues were seeded according to the number of FSWs reported for that venue, we implement an alternative scenario where FSWs are placed in venues only based on their demographic and physical characteristics, with no heed to venue size. Results based on these variants are shown in the appendix (Figures A3-A5) with their respective correlation coefficients. Differences in the correlation coefficients relative to the baseline scenarios are small, suggesting that the results are robust to different specifications of the population of FSWs.
What does sampling disproportional to degree imply for the ability of RDS chains to spatially cover the network? Figure 3 (upper left panel) shows the simulated network displayed with the geographic coordinates4 while the remaining three panels provide a heat-map for the percent of observations from the RDS sample, the population network, and the difference between the RDS sample and the population. If RDS sampled perfectly proportional to population density, the residual plot would be essentially random noise with very light shades of blue throughout (i.e. hovering around zero). This is the case for most geographic locations in the network except for one central location indicated by bright red. The residuals plot shows disproportionate sampling from a geographically central neighborhood in the network, suggesting that actual RDS chains oversampled from this central location.
Figure 3. Geographic coverage of the RDS chains.

Assumes weak geographic mixing & demographically matched links & seeds
Note: Panel (a) provides the simulated distribution of FSW in the geographic space; panel (b) abstracts from the observed points to the population density. Panel (c) shows the proportion of RDS chains that reach each location, and panel (d) provides the locational residuals (subtracting the corresponding locations of b from c). If RDS samples are accurately covering the space, coverage should be proportional to population density. The large positive residuals thus represent an oversampling.
Would the network be adequately covered by RDS chains running under idealized sampling conditions? Figure 4 shows the spread of the distributions of the residual differences between the value of the probability of an RDS chain to recruit in a given location in the network and the value of the probability of a network node to be in that location under different conditions of the sampling process as well as under “weak” and “strong” geography. When RDS chains are running under ideal sampling conditions, the variance of the distribution of the residual differences is low. The variance increases the more tightly we constrain the sampling process to mimic the observed RDS chains. Spatial population coverage improves when sampling conditions mirror the RDS idealized sampling model. These results do not vary greatly by whether we simulate a strong or weak geography scenario.
Figure 4. Distribution of location residuals by simulation condition.
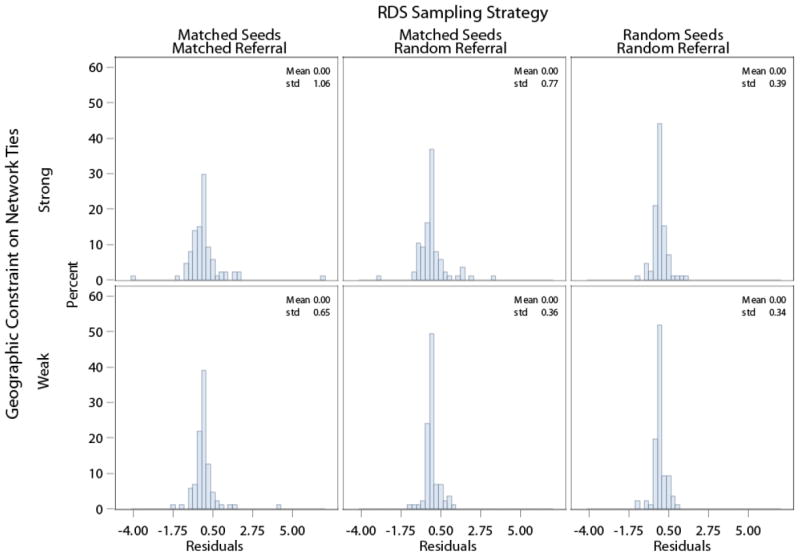
Location Residual: proportion of sample chains at each location compared to proportion of population. Simulated networks are consistent with the physical and social characteristics of the PLACE data, venue size adjusted.
Discussion and Conclusions
Respondent Driven Sampling capitalizes on the network structure of members of a hidden population to identify, recruit and interview subjects. The capacity of RDS to faithfully represent these populations and generate valid estimates of population characteristics relies on the validity of core assumptions regarding the sampling process over the unobserved network of the hidden population. Previous evaluations of RDS have explored the performance of RDS sampling chains on non-hidden populations with known parameters (McCreesh et al. 2012 Wejnert and Heckathorn 2008) and of simulated chains over previously mapped social networks (Goel and Salganik 2010), or they have compared estimates from empirical RDS samples with those from samples recruited through alternative sampling approaches (e.g. Kendall et al. 2008, Robinson et al. 2006; Burt et al. 2010; Kral et al. 2010; Weir et al. 2012).
Here we evaluate the performance of real and ideal RDS chains on a real-world hidden population of the type targeted by RDS. We focus on one crucial assumption underlying conventional RDS estimators currently in use, that RDS study participants are selected with probability proportional to their self-reported degree. We evaluate under which conditions this assumption is not met, and its implications for RDS spatial coverage of the network. Our approach consists of running recruitment chains over a simulated network and comparing chains that mimic the observed RDS sampling process with chains that mimic the sampling process under idealized conditions. Our simulations are grounded in data collected in a RDS survey conducted concurrently with a PLACE survey.
In particular, to describe the hidden population network from which the RDS chains are drawn, we use a case-control regression framework to estimate social network parameters from egocentric network data collected in an RDS study and use these parameters to stochastically generate the population network with an exponential random graph modeling (ERGM) framework over a population of FSWs in venues with the socio-demographic and spatial characteristics of the PLACE survey.
Our approach has several advantages over previous ones used to evaluate the performance of RDS. First, the ERGM model we implement is empirical both in the model bases and in the sense that it fits the data well on a hidden population of the type that RDS was developed to study. In this way, it overcomes the limitations of network simulation studies that hold under conditions that have no relevance to empirical populations, or of evaluations based on empirical networks with very different structures from those of the hidden population of FSWs. Second, our approach is systematic and empirically grounded, making it easier to assess the robustness of the results. We were able to vary the characteristics of the underlying population network parameters and to assess robustness of the simulations results under a range of underlying population composition conditions. Third, our approach provides data on the spatial distribution of the underlying network for comparison of the spatial diffusion of the observed RDS chains with the spatial characteristics of the network.
We find that when simulated chains are consistent with RDS idealized sampling dynamics, network nodes are sampled with probability proportional to their degree, but when RDS chains mimic the observed RDS sampling process, lower degree nodes (middle tier sex workers) are oversampled. These results are robust across different underlying population characteristics and offer evidence that bolsters the generalizability of the finding to different population compositions.
The finding of violation of the SPPD assumption suggests that there may be other factors that, in addition to degree, influence whether or not members of the population are included in the RDS sample. Structural barriers embedded in the hierarchical structure of sex work in Liuzhou may curtail interactions among FSWs and impede recruitment between tiers. A comparison of actual and invited cross-tier recruitment patterns with expected recruitment patterns of respondents in the Liuzhou RDS study suggest patterns of within-group differential recruitment by middle tier sex workers but no differential recruitment effectiveness or differential non-response by tier. Middle tier sex workers favor inviting and effectively recruit network alters from their own tier more so than expected if they recruited consistently with their self-reported network composition by tier, while high-tier sex workers invite and effectively recruit from their own tier in a manner that does not significantly deviate from the tier composition of their known alters (see Appendix Table A5). Preferential recruitment with respect to tier of sex work was also found in another empirical sample of FSWs recruited with RDS in Shanghai (Yamanis et al. 2013). Results of that study, buttressed by data on relationship attributes between recruiters and their alters, showed that features of the social organization of sex work in Shanghai are likely to interfere with the RDS recruitment process because structural barriers due to differences in age, education and relative social status within the sex work hierarchy complicate upward recruitment from middle to high tier of sex work. Since a hierarchical structure is a common feature of the organization of female sex work in Asia (Lim 1998), our finding of violation of the SPPD assumption in the context of FSWs in Liuzhou has implications for the use of RDS in this hidden population among whom RDS is routinely conducted (Blankenship et al. 2008; Johnston et al. 2006). Another major finding of our analyses is that ideal RDS chains provide good spatial coverage of the underlying network population but observed chains oversample a geographically central area of the network.
These findings have implications for the validity and precision of RDS estimates of characteristics of hidden populations and interfere with efforts to accurately describe the distribution of risk behaviors and infection status in marginalized and vulnerable populations at risk of HIV/STDs. First, violation of the SPPD assumption implies that the V-H estimator would excessively overweight lower-degree nodes leading to an overestimated proportion of middle-tier sex workers. This is consistent with results from simulations of the RDS sampling process and of the underlying network (e.g. Gile and Handcock 2010; Tomas and Gile 2011) that showed that the V-H estimator is biased in the presence of different rates of recruitment to own group. Second, because of structural barriers which define the social stratification of sex work and facilitate the formation of spatial clusters, the spatial bias of the RDS sampling process will lead to an overrepresentation of certain areas of the network while leaving other areas unexplored. This will produce inaccurate samples and high variability of estimates (Mouw and Verdery 2012; Goel and Salganik 2010).
Our findings have important public health implications. Threats to the validity and accuracy of estimates highlight the limitations of RDS sampling schemes for inferring population prevalence of disease traits such as STDs and HIV. If syphilis prevalence among Liuzhou FSWs is heterogeneous and middle tier sex workers display higher syphilis infection rates than their higher tier counterparts, oversampling of middle tier sex workers will result in positive bias in syphilis estimates. Moreover, if FSWs in center city display higher syphilis rates, spatial bias in recruitment would result in RDS chains overestimating syphilis rates (e.g. Jenness et al. 2013). On the other hand, if high tier FSWs had high rates of syphilis, a typical RDS chain will downplay the disease risk in the population. The exact extent of the bias could be quite large or quite small, depending on the differences in disease risk across the population and the spatial bias in sampling. Our simulation approach could be used to formally explore the range of bias. One could, for example, seed the empirically based network with different disease profiles (e.g. FSWs in the center of the city have high rates of syphilis) and examine how the observed RDS chains over or under estimate the rate of disease based on the specified disease scenario. Moreover, with complicated networks because of spatial and demographic clustering of RDS chains, RDS samples sizes, which typically range between 300 and 700 in size (Malekinejad et al. 2008), would not be sufficiently large to detect significant differences in risk behaviors and disease prevalence in hidden populations, thus thwarting efforts to monitor STDs trends overtime and to evaluate the effects of health interventions.
The network features revealed by our analyses may also interfere with the ability of RDS to reveal the most vulnerable population segments in need of interventions. In the Chinese context, low-tier sex workers who solicit on the streets or on construction sites are most vulnerable to syphilis infection (Chen et al. 2012) but they are also most difficult to reach because they are mobile, vulnerable to legal sanctions, hence most reluctant to being identified as sex workers. The social and spatial divisions of the network of FSWs we highlighted suggest that intervention programs among FSWs which rely on social networks to diffuse health prevention messages would fail to reach the most vulnerable subgroups that need them most. Similarly, health programs directed at venues located in the city center which disease prevention workers can more easily access may fail to reach the neediest segments of the population in the periphery and limit the impact of these programs.
An additional advantage of our empirically grounded simulation framework is that it allows the introduction of variability in how the RDS techniques are implemented and could be used to evaluate potential field adjustments designed to improve population coverage of RDS and estimation procedures by running chains that reduce bias and design effects of RDS samples including establishing participant recruitment rules and incentives that can remove as much bias as possible. These may take the form of probabilistic encouragements to distribute coupons in a way that better represents the network composition. RDS has proven to be a very efficient, practical and low-cost method for recruiting samples of hidden populations in many settings. It has generated a wealth of data on population that have been previously difficult to access (White et al. 2012). Future work should focus on continuing comprehensive empirical evaluations of violations of RDS assumptions in field studies, establishing guidelines to reduce biases, and methodological improvements for population representation.
We assess RDS claim of population representation on a real-world hidden population (85)
We run RDS chains over simulated empirical networks from sampled data (72)
RDS oversamples some members of the hidden population of Chinese FSWs (78)
The social organization of FSWs in China influences sample inclusion probabilities (85)
Appendix
Table A1.
Network data in the Liuzhou PLACE-RDS Study
| Recruiting participants’ reports about invited and uninvited alters | Participant’s report about self | ||||
|---|---|---|---|---|---|
| RDS | RDS | PLACE | |||
| Individual network items | |||||
| Individual attributes | Age | √ | √ | √ | |
| Marital status, education | √ | √ | √ | ||
| Where/how solicits clients | √ | √ | √ | ||
| Condom use | √ | √ | √ | ||
| Properties of Relation | Place where usually meet alter | √ | |||
| Frequency of contact | √ | ||||
| Type | √ | ||||
| Intensity | √ | ||||
| Repertoire of relation | Reason why you invited this person? | √ | |||
| Reason why you did not invite these person(s) | √ | ||||
| Aggregated network items | # of known FSWs | √ | √ | ||
| # of known FSWs you would invite to the study | √ | ||||
| # of known FSWs who solicit clients at your main site | √ | √ | |||
| # of known FSWs who solicit clients elsewhere by site type and distance (within a 10 min walk and beyond a 10 min walk) | √ | √ | |||
| # of known sex workers who are also known by your recruiter | √ | ||||
| Venue where solicits clients | Name | √ | √ | ||
| Type | √ | √ | |||
| Physical location (latitude and longitude) | √ | √ | |||
Table A2.
Demographic and socio-economic characteristics by tier of sex work, Liuzhou FSWs recruited in the RDS sample, V-H adjusted proportions and means [% CI](a)
| Tier | Total | High tier | Middle tier | Low tier | Not venue-based |
|---|---|---|---|---|---|
| Unweighted N | 576 | 250 | 268 | 27 | 31 |
| Total proportions | 100 | 32.7 [5.8, 55.7] | 54.5 [30.9, 58.1] | 5.5 [3.6, 10.2] | 7.3 [3.5, 33.2] |
| Median ntwk size(b) | 10 | 15 | 8 | 8 | 6 |
| Age group | |||||
| 15-24 | 42.8 [13.0, 50.8] | 84.7 [70.7, 90.7] | 31.3 [22.7, 40.8] | 0 | 0 |
| 25-35 | 42.9 [34.6, 52.9] | 12.6 [7.7, 24.5] | 59.8 [50.3, 69.1] | 14.1 [2.7, 69.7] | 30.1 [10.5, 81.2] |
| 36+ | 14.3 [10.4, 40.0] | 2.8 [0, 8.0] | 8.9 [3.7, 14.4] | 85.9 [30.3, 97.3] | 69.9 [18.8, 89.5] |
| Education | |||||
| ≤ Primary | 25.3 [15.0, 60.9] | 6.7 [2.6, 13.2] | 31.7 [24.0, 39.5] | 84.2 [35.8, 100] | 38.4 [5.3, 61.4] |
| Junior high | 57.1 [15.7, 61.8] | 55.4 [46.1, 65.3] | 58.9 [51.3, 67.2] | 13.1 [0, 44.5] | 57.3 [34.9, 89.8] |
| Senior high | 17.5 [14.8, 58.7] | 37.9 [27.1, 47.6] | 9.4 [4.7, 14.5] | 2.7 [0, 32.0] | 4.3 [0, 13.3] |
| Marital status | |||||
| Not married | 62.2 [17.8, 55.3] | 92.5 [85.2, 96.7] | 53.7 [44.7, 63.5] | 3.3 [0, 12.3] | 29.4 [10.0, 69.0] |
| Married/cohabiting | 13.8 [16.7, 54.3] | 1.4 [0.2, 3.6] | 22.4 [14.2, 31.3] | 4.8 [0, 16.3] | 9.4 [0, 24.7] |
| Divorced/Widowed | 24.0 [18.3, 55.5] | 6.2 [2.1, 12.7] | 23.9 [16.3, 31.5] | 91.9 [77.5, 100] | 61.3 [22.6, 82.9] |
| Monthly income (RMB) | |||||
| ≤2,000(=USD 315) | 30.3 [11.0, 56.5] | 5.4 [1.2, 11.2] | 39.4 [30.8, 48.3] | 83.8 [48.9, 97.1] | 52.6 [22.2, 75.0] |
| 2,000-6,000 | 45.0 [11.7, 57.2] | 43.2 [32.1, 55.2] | 47.8 [39.5, 55.9] | 16.2 [2.9, 51.1] | 44.3 [18.4, 72.6] |
| >6000(=USD 1,000) | 24.7 [14.2, 56.8] | 51.4 [39.2, 62.6] | 12.7 [7.3, 19.6] | 0 | 3.1 [0, 19.3] |
| Number of clients last month | |||||
| ≤15 | 55.2 [44.7, 55.1] | 70.6 [52.8, 79.5] | 48.9 [39.4, 58.8] | 29.3 [0, 68.0] | 70.8 [53.4, 89.8] |
| >15 | 44.8 [44.9, 55.3] | 29.4 [20.5, 47.2] | 51.1 [41.2, 60.6] | 70.7 [32.0, 100] | 29.2 [10.2, 4 6.6] |
| History of syphilis infection (screening test) | |||||
| Positive | 8.0 [4.3, 10.5] | 3.7 [0.7, 8.9] | 2.8 [1.0, 4.7] | 69.8 [21.4, 82.1] | 42.2 [5.0, 65.6] |
| Negative | 85.5 [4.7, 86.6] | 90.5 [83.5, 95.2] | 90.2 [84.6, 95.0] | 29.2 [14.3, 72.5] | 52.2 [30.5, 87.2] |
| Rejected test | 6.5 [6.2, 89.1] | 5.8 [2.8, 10.3] | 7.1 [2.6, 12.6] | 1.0 [0, 28.3] | 5.6 [0, 17.6] |
Note: The sample size for all analyses in this table excludes the 7 seeds. High tier include FSW who solicit clients in karaoke bars, sauna or massage within star hotels, discos, night clubs; Middle tier include FSW working in hair salons, foot or body massage parlors, sauna and bathhouses; Low tier include FSW who solicit clients on the streets, parks, other public spaces and rented apartments; Not venue-based FSWs include women who reported telephone or private referral as the only mode of solicitation in the past six months.
Confidence intervals of V-H point estimates were generated using a modified bootstrap procedure similar to the one proposed by Salganik (2006), as presented in Weir et al. 2012 and Yamanis et al. 2013.
Medians are unadjusted
Table A3.
Distribution of Characteristics by Tier: True versus Simulated Population
| True Values | Simulated Population | |||||
|---|---|---|---|---|---|---|
|
| ||||||
| Education | Low | Tier Middle | High | Low | Tier Middle | High |
| Primary & Less | .286 | .161 | .015 | .281 | .166 | .012 |
| Middle School | .571 | .714 | .652 | .585 | .705 | .642 |
| HS & Above | .143 | .125 | .333 | .133 | .128 | .346 |
| Marital Status | ||||||
| Never Married | .286 | .750 | .864 | .267 | .734 | .863 |
| Currently Married | .429 | .179 | .091 | .478 | .191 | .095 |
| Separated or Divorced | .286 | .071 | .045 | .255 | .076 | .042 |
| Mean Age | 38.714 | 24.429 | 21.424 | 39.068 | 24.762 | 21.471 |
| Mean Venue Size | 5.923 | 9.609 | 28.808 | 9.631 | 10.500 | 26.583 |
Table A4.
Initial Coefficients for Network Simulation (Strong Distance Models)
| Characteristic | Term | PLACE Model | RDS Model |
|---|---|---|---|
| Mixing by Age | |||
| Absolute Distance: Age | -.143 | -.120 | |
| Mixing by Tier | |||
| High-High | -.321 | .257 | |
| High-Middle | -1.114 | -1.126 | |
| High-Low | -10.00 | -10.00 | |
| Middle-Middle | 1.840 | 1.657 | |
| Middle-Low | .356 | -.283 | |
| Low-Low | 2.997 | 1.777 | |
| Mixing by Marital Status | |||
| Married-Married | .129 | .683 | |
| Married-Single | -.315 | -.338 | |
| Married-Divorced | .707 | .390 | |
| Single-Divorced | .877 | -.129 | |
| Single-Single | -.143 | .115 | |
| Divorced-Divorced | .964 | .579 | |
| Mixing by Physical Distance | |||
| Same Venue | 3.043 | 3.233 | |
| Absolute Distance: “Latitude” | -110.42 | -108.687 | |
| Absolute Distance: “Longitude” | -173.291 | -167.638 | |
Table A5.
Actual and Observed Cross-tier Recruitment Patterns and Distribution of All-alters Known by Recruiters by Tier (Recruiters in parentheses). Liuzhou FSWs Recruited in RDS.
| Recruiter’s tier | Actual recruitment N (%) | Observed (invited) Recruitment N (%) | All network alters N (%) | |||||||||
|---|---|---|---|---|---|---|---|---|---|---|---|---|
| High tier alters | Middle tier alters | Low tier alters | Non-venue based alters | High tier alters | Middle tier alters | Low tier alters | Non-venue based alters | High tier alters | Middle tier alters | Low tier alters | Not-venue based alters | |
| High (n=133) | 217 (86.4) | 31 (12.3) | 0 (0) | 3 (1.2) | 299 (88.5) | 36 (10.6) | 0 (0) | 3 (0.9) | 2231 (82.5) | 447 (16.5) | 7 (0.3) | 18 (0.7) |
| Middle (n=140) | 28 (10.5) | 228 (86.0) | 3 (1.2) | 6 (2.3) | 38 (10.6) | 306 (85.2) | 8 (2.3) | 7 (1.9) | 349 (19.8) | 1331 (75.7) | 24 (1.4) | 55 (3.1) |
| Low (n=12) | 0 (0) | 2 (10.0) | 18 (90.0) | 0 (0.0) | 0 (0) | 2 (8.3) | 19 (79.2) | 3 (12.5) | 0 (0.0) | 11 (9.0) | 102 (83.6) | 9 (7.4) |
| Non-venue based (n=22) | 3 (8.6) | 10 (286) | 7 (20.0) | 15 (42.9) | 3 (7.7) | 7 (17.9) | 8 (20.5) | 21 (53.8) | 26 (10.7) | 75 (31.0) | 58 (24.0) | 83 (34.3) |
Note: Actual recruitments are recruiters’ alters who were invited and accepted the invitation by participating in the survey. These are recruiting participants’ effective recruitments. Observed recruitments are recruiters’ alters who were invited to participate regardless of whether they accepted or rejected the invitation. All network alters indicate all alters known by recruiters, including invited and uninvited alters.
Figure A1. Probability of a pair of simulated FSW being Acquainted in the Social Network by Geographic Distance & Geographic Preference Parameter.
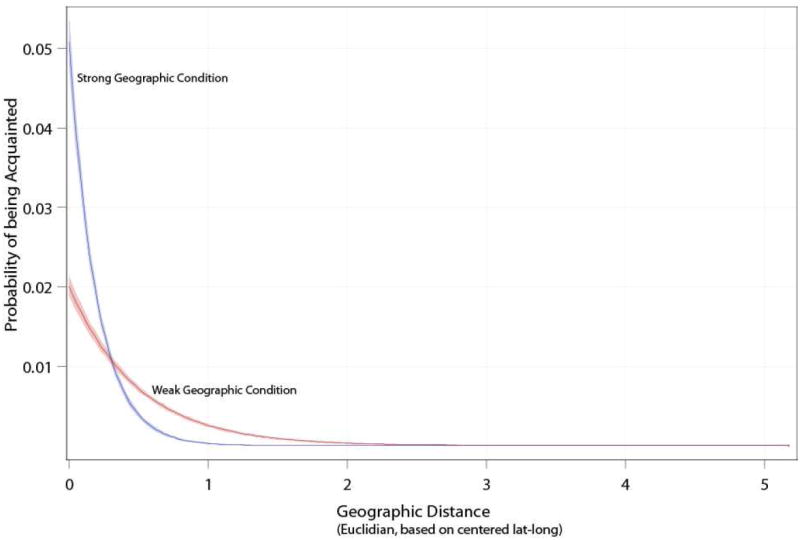
Figure A2. Simulated network under two geography scenarios.

Figure a3. RDS Proportionality by Degree and Tier, PLACE-sample without venue-size adjustment.
Under multiple RDS Sampling scenarios and geographic correspondence.
Simulated networks are consistent with the physical and social characteristics of the PLACE data, venue size not adjusted.
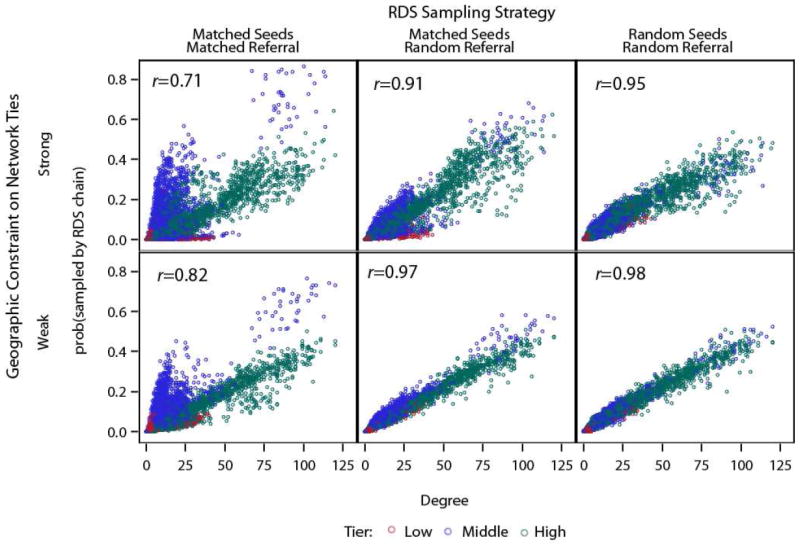
Figure A4. RDS Proportionality by Degree and Tier, RDS-Sample with venue-size adjustment.

Under multiple RDS Sampling scenarios and geographic correspondence.
Simulated networks are consistent with the physical and social characteristics of the RDS data, venue size adjusted.
Figure a5. RDS Proportionality by Degree and Tier, RDS-Sample without venue-size adjustment.
Under multiple RDS Sampling scenarios and geographic correspondence.
Simulated networks are consistent with the physical and social characteristics of the RDS data, venue size not adjusted.
Footnotes
The analyses described here are funded by NICHD grant 1 R01 HD068523 to Duke University (Merli, PI) and grant 1 R01 HD075712 (Moody, PI). Funding for the collection of PLACE and RDS data was provided by USAID under the terms of cooperative agreements GPO-A-00-03-00003-00 and GPO-A-00-09-00003-0; by NICHD through the UNC R24 “Partnership for Social Science Research on HIV/AIDS in China” (Henderson, PI) and the Pre-Doctoral Research Program at the Carolina Population Center, University of North Carolina; by UNICEF, UNDP, World Bank, and WHO through the “WHO Rapid Syphilis Test Project (WHO A70577)”; by the Duke University and University of North Carolina Center(s) for AIDS Research; and by the National Center for STD Control in China. The PLACE-RDS Study was led by Sharon Weir (PI), with co-investigators, Xiangsheng Chen and M. Giovanna Merli. We thank the physicians and the outreach workers in the study areas for their hard work, and the study participants for their cooperation. Thanks are also due to Jake Fisher for generating Figure 1 and for his comments on the overall project and to Ashton Verdery for useful comments on this manuscript.
Our evaluation focuses on the conventional RDS estimators which are widely in use. Gile (2011) recently proposed a successive sampling (SS) estimator for population proportions that modifies the conventional theoretical formulation of RDS and associated inference. This approach allows for the sample’s inclusion probabilities to be a function of the individual’s degree, rather than exactly proportional to degree, but it requires knowledge of the population size. It was shown to be superior to the conventional RDS estimators when the sampling fraction is large. It is best suited for populations where the sampling with replacement assumption does not hold because the sample includes a large fraction of the target population. The hidden population in our study here is large enough and the sample fraction small enough to reduce concerns of violation of this assumption.
FSWs are placed into venues which are rooted in a realistic geographic space. This makes it possible to calculate distance between FSWs in both the North/South and East/West directions. Two terms are required as geographic distance must be translated into walking time (or ease of contact) and city walking is constrained to blocks, as opposed to shortest Euclidean distance.
The stochastic matching process used to align the simulated RDS chains to the observed chains works by drawing equivalent alters at each stage of the RDS walk. Deviations from the observed chain can occur if one of our simulated persons in the chain has no alters to draw, in which case the chain dead-ends, or she has no exact demographic match (only applies to the matching referral scenario) in which case we draw one of her available alters at random (which is generous to the RDS assumptions). For computational efficiency we allow a small number of dead-ends, so long as the resulting chains differ by no more than 2%, and we weight by the inverse of the distance to the true chain structure to account for demographic differences. Results do not appreciably differ without the weights.
These coordinates are adjusted, zeroed and then randomized to maintain relative distance but provide no ability to link to the true geography.
Publisher's Disclaimer: This is a PDF file of an unedited manuscript that has been accepted for publication. As a service to our customers we are providing this early version of the manuscript. The manuscript will undergo copyediting, typesetting, and review of the resulting proof before it is published in its final citable form. Please note that during the production process errors may be discovered which could affect the content, and all legal disclaimers that apply to the journal pertain.
References
- Breslow NE, Day NE. Statistical Methods in Cancer Research: The Analysis of Case-Control Studies. Vol. 1. Lyon, France: IARC Scientific Publications; 1980. [PubMed] [Google Scholar]
- Brewer DD. Forgetting in the recall-based elicitation of personal and social networks. Social Networks. 2000;22(1):29–43. [Google Scholar]
- Burt RD, Hagan H, Sabin K, Thiede H. Evaluating Respondent-driven Sampling in a Major Metropolitan Area: Comparing Injection Drug Users in the 2005 Seattle Area National HIV Behavioral Surveillance System Survey with Participants in the RAVEN and Kiwi Studies. Annals of Epidemiology. 2010;20(2):159–167. doi: 10.1016/j.annepidem.2009.10.002. [DOI] [PMC free article] [PubMed] [Google Scholar]
- Carballo-Dieguez A, Balan I, Marone R, Pando MA, Dolezal C, Barreda V, Leu CS, Avila MM. Use of Respondent Driven Sampling generates a very diverse sample of men who have sex with men (MSM) in Buenos Aires, Argentina. PLoS One. 2011;6(11):e27447. doi: 10.1371/journal.pone.0027447. [DOI] [PMC free article] [PubMed] [Google Scholar]
- Chen X, Yin Y, Liang G, et al. Sexually transmitted infections among female sex workers in Yunnan, China. AIDS Patient Care STDS. 2005;19(12):853–860. doi: 10.1089/apc.2005.19.853. [DOI] [PubMed] [Google Scholar]
- Chen ZQ, Zhang GC, Gong XD, Lin C, Gao X, Liang GJ, Yue XL, Chen XC, Cohen MS. Syphilis in China: Results of a National Surveillance Programme. The Lancet. 2007;369(9556):132–138. doi: 10.1016/S0140-6736(07)60074-9. [DOI] [PMC free article] [PubMed] [Google Scholar]
- Chen XC, Wang QQ, Yin YP, et al. Prevalence of syphilis infection in different tiers of female sex workers in China: implications for surveillance and interventions. BMC Infectious Diseases. 2012;12:84. doi: 10.1186/1471-2334-12-84. [DOI] [PMC free article] [PubMed] [Google Scholar]
- China Ministry of Health. 2011 Estimates for the HIV/AIDS Epidemic in China. Beijing, China: Nov, 2011. [Google Scholar]
- Frank O. Survey sampling in graphs. J Stat Plan Inference. 1977;1:235–264. [Google Scholar]
- Gile KJ, Handcock MS. Respondent-Driven Sampling: An Assessment of Current Methodology. Sociological Methodology. 2010;40:285–327. doi: 10.1111/j.1467-9531.2010.01223.x. [DOI] [PMC free article] [PubMed] [Google Scholar]
- Gile KJ. Improved Inference for Respondent-Driven Sampling Data With Application to HIV Prevalence Estimation. Journal of the American Statistical Association. 2011;106(493):135–146. [Google Scholar]
- Goel S, Salganik MJ. Assessing Respondent-Driven Sampling. Proceedings of the National Academy of Sciences of the United States of America. 2010;107(15):6743–6747. doi: 10.1073/pnas.1000261107. [DOI] [PMC free article] [PubMed] [Google Scholar]
- Goodman LA. Snowball sampling. Ann Math Stat. 1961;32:148–170. [Google Scholar]
- Goodreau SM, Kitts JA, Morris M. Birds of a Feather, or Friend of a Friend? Using Exponential Random Graph Models to Investigate Adolescent Social Networks. Demography. 2009;46:103–25. doi: 10.1353/dem.0.0045. [DOI] [PMC free article] [PubMed] [Google Scholar]
- Handcock MS, Gile KJ. Network model-assisted inference from Respondent Driven Sampling Data. 2011 doi: 10.1111/rssa.12091. Under revision. [DOI] [PMC free article] [PubMed] [Google Scholar]
- Handcock MS, Goodreau SM, Hunter DR, Butts CT, Morris M. ERGM: A Package to Fit, Simulate and Diagnose Exponential–Family Models for Networks. Journal of Statistical Software. 2008;24:1–29. doi: 10.18637/jss.v024.i03. [DOI] [PMC free article] [PubMed] [Google Scholar]
- Heckathorn DD. Respondent-driven sampling: A new approach to the study of hidden populations. Social Problems. 1997;44:174–199. [Google Scholar]
- Heckathorn DD. Respondent-driven sampling II: Deriving valid population estimates from chain-referral samples of hidden populations. Social Problems. 2002;49:11–34. [Google Scholar]
- Hershatter G. Dangerous Pleasures. Berkeley, CA: University of California Press; 1997. [Google Scholar]
- Hesketh T, Li L, Ye X, et al. HIV and syphilis in migrant workers in Eastern China. Sexually Transmitted Infections. 2005;82:11–14. doi: 10.1136/sti.2004.014043. [DOI] [PMC free article] [PubMed] [Google Scholar]
- Huang Y, Henderson GE, Pan SM, Cohen MS. HIV/AIDS Risk Among Brothel-Based Female Sex Workers in China: Assessing the Terms, Content, and Knowledge of Sex Work. Sexually Transmitted Diseases. 2004;31(11):695–700. doi: 10.1097/01.olq.0000143107.06988.ea. [DOI] [PubMed] [Google Scholar]
- Iguchi MY, Ober AJ, Berry SH, Fain T, Heckathorn DD, Gorbach PM, Heimer R, Kozlov A, Ouellet LJ, Shoptaw S, Zule WA. Simultaneous Recruitment of Drug Users and Men Who Have Sex with Men in the United States and Russia using Respondent-Driven Sampling: Sampling Methods and Implications. Journal of Urban Health. 2009;86(s1):5–31. doi: 10.1007/s11524-009-9365-4. [DOI] [PMC free article] [PubMed] [Google Scholar]
- Jenness SH, Neaigus A, Wendel T, Gelpi-Acosta C, Hagan H. Spatial recruitment bias in Respondent-Driven-Sampling: Implications for HIV Prevalence Estimation in Urban Heterosexuals. AIDS and Behavior. 2013 doi: 10.1007/s10461-013-0640-8. Published online on 13 October 2013. [DOI] [PMC free article] [PubMed] [Google Scholar]
- Johnston LG, Sabin K, Hien MT, Huong PT. Assessment of Respondent Driven Sampling for recruiting female sex workers in two Vietnamese cities: Reaching the unseen sex worker. J Urban Health. 2006;83(Suppl 1):16–28. doi: 10.1007/s11524-006-9099-5. [DOI] [PMC free article] [PubMed] [Google Scholar]
- Kendall CC, Kerr LR, Gondim RC, Werneck GL, Macena RH, Pontes MK, Johnston LG, Sabin K, McFarland W. An Empirical Comparison of Respondent-Driven Sampling, Time Location Sampling, and Snowball Sampling for Behavioral Surveillance in Men Who Have Sex with Men, Fortaleza, Brazil. AIDS and Behavior. 2008;12(s1):97–104. doi: 10.1007/s10461-008-9390-4. [DOI] [PubMed] [Google Scholar]
- Klovdahl A. Urban social networks: some methodological problems and possibilities. In: Kochen M, editor. The Small World. Ablex Publishing; Norwood, NJ: 1989. pp. 176–210. [Google Scholar]
- Kral AH, Malekinejad M, Vaudrey J, et al. Comparing respondent driven sampling and targeted sampling methods of recruiting injection drug users in San Francisco. Journal of Urban Health. 2010;87:839–850. doi: 10.1007/s11524-010-9486-9. [DOI] [PMC free article] [PubMed] [Google Scholar]
- Lansky A, Abdul-Quader AS, Cribbin M, et al. Developing an HIV behavioral surveillance system for injecting drug users: The national HIV behavioral surveillance system. Public Health Reports. 2007;122(S1):48–55. doi: 10.1177/00333549071220S108. [DOI] [PMC free article] [PubMed] [Google Scholar]
- Lawler GF, Coyle LN. Lectures on Contemporary Probability. Providence, RI: American Mathematical Society; 1999. [Google Scholar]
- Lim LL. The Sex Sector: The Economic and Social Bases of Prostitution in Southeast Asia. Geneva: International Labor Office; 1998. [Google Scholar]
- Lovasz L. Random Walks on Graphs: A Survey. Combinatorics. 1993;2:1–46. [Google Scholar]
- Lu XL, Bengtsson L, Britton T, Camitz M, Kim BJ, Thorson A, Liljeros F. The sensitivity of Respondent Driven Sampling. Journal of the Royal Statistical Society: Series A (Statistics in Society) 2012;175(1):191–216. [Google Scholar]
- Malekinejad M, Johnston L, Kendall C, et al. Using Respondent-Driven Sampling methodology for HIV biological and behavioral surveillance in international settings: A systematic review. AIDS and Behavior. 2008;12(4 Suppl):S105–30. doi: 10.1007/s10461-008-9421-1. [DOI] [PubMed] [Google Scholar]
- Marsden PV. Network data and measurement. Annual Review of Sociology. 1990;16:435–463. [Google Scholar]
- McCreesh N, Frost SD, Seeley J, Katongole J, Tarsh MN, Ndunguse R, Jichi F, Lunel NL, Maher D, Johnston LG, Sonnenberg P, Copas AJ, Hayes RJ, White RG. Evaluation of Respondent-Driven Sampling. Epidemiology. 2012;23(1):138–147. doi: 10.1097/EDE.0b013e31823ac17c. [DOI] [PMC free article] [PubMed] [Google Scholar]
- McCormick TH, Salganik MJ, Zheng T. How many people do you know?: Efficiently estimating personal network size. Journal of the American Statistical Association. 2010;105:59–70. doi: 10.1198/jasa.2009.ap08518. [DOI] [PMC free article] [PubMed] [Google Scholar]
- Merli MG, Hertog S, Wang B, Li J. Modeling the spread of HIV/AIDS in China: The role of heterosexual transmission. Population Studies. 2006;60(1):1–22. doi: 10.1080/00324720500436060. [DOI] [PubMed] [Google Scholar]
- Morris M, Kurth AE, Hamilton DT, Moody J, Wakefield S. Concurrent Partnerships and HIV Prevalence Disparities by Race: Linking Science and Public Health Practice. American Journal of Public Health. 2009;99:1023–31. doi: 10.2105/AJPH.2008.147835. [DOI] [PMC free article] [PubMed] [Google Scholar]
- Mouw T, Verdery A. Network Sampling with Memory: A proposal for more efficient sampling from social networks. Sociological Methodology. 2012;42(1):206–256. doi: 10.1177/0081175012461248. [DOI] [PMC free article] [PubMed] [Google Scholar]
- Neely WW. Statistical Theory for Respondent-Driven Sampling. Doctor of Philosophy dissertation. University of Wisconsin-Madison; 2009. [Google Scholar]
- Parish W, Pan SM. Sexual Partners in China: Risk Patterns for Infection by HIV and Other Possible Interventions. In: Kaufman J, Kleinman A, Saich T, editors. AIDS and Social Policy in China. Cambridge: Harvard University Asia Center; 2006. pp. 190–213. [Google Scholar]
- Pirkle C, Soundardjee R, Stella A. Female sex workers in China: Vectors of disease? Sexually Transmitted Infections. 2007;34(9):695–703. doi: 10.1097/01.olq.0000260989.70866.94. [DOI] [PubMed] [Google Scholar]
- Robins G, Pattison P, Woolcock J. Small and Other Worlds: Global Network Structures from Local Processes. American Journal of Sociology. 2005;110:894–936. [Google Scholar]
- Robins G, Pattison P, Kalish Y, Lusher D. An Introduction to Exponential Random Graph (p*) Models for Social Networks. Social Networks. 2007;29:173–91. [Google Scholar]
- Robinson WT, Risser JMH, McGoy S, Becker AB, Rehman H, Jefferson M, Griffin V, Wolverton M, Tortu S. Recruiting Injection Drug Users: A Three-Site Comparison of Results and Experiences with Respondent-Driven and Targeted Sampling Procedures. Journal of Urban Health. 2006;83(Suppl 1):29–38. doi: 10.1007/s11524-006-9100-3. [DOI] [PMC free article] [PubMed] [Google Scholar]
- Rogers SJ, Ying L, Xin YT, Fung K, Kaufman J. Reaching and Identifying the STD/HIV Risk of Sex Workers in Beijing. AIDS Education and Prevention. 2002;14(3):217–227. doi: 10.1521/aeap.14.3.217.23892. [DOI] [PubMed] [Google Scholar]
- Salganik MJ. Variance estimation, design effects, and sample size calculations for respondent-driven sampling. Journal of Urban Health. 2006;83:98–111. doi: 10.1007/s11524-006-9106-x. [DOI] [PMC free article] [PubMed] [Google Scholar]
- Salganik MJ, Heckathorn DD. Sampling and estimation in hidden populations using respondent-driven sampling. Sociological Methodology. 2004;34:193–239. [Google Scholar]
- Smith JA. Macrostructure from Survey Data: Generating Whole Systems from Ego Networks. Sociological Methodology. 2012;42:155–205. doi: 10.1177/0081175012455628. [DOI] [PMC free article] [PubMed] [Google Scholar]
- Smith JA, McPherson MJ, Smith-Lovin L. Social Distance in the United States: Sex, Race, Religion, Age and Education Homophily among Confidants, 1985-2004. American Sociological Review. Forthcoming. [Google Scholar]
- Thompson SK. Adaptive cluster sampling. J Am Stat Assoc. 1990;85:1050–1059. [Google Scholar]
- Thompson SK, Seber GAF. Adaptive Sampling. New York, NY: Wiley; 1995. [Google Scholar]
- Thompson SK. Sampling. Second edition New York, NY: Wiley; 2002. [Google Scholar]
- Tomas A, Gile KJ. The Effect of Differential Recruitment, Non-response and Non-recruitment on Estimators for Respondent-Driven Sampling. Electronic Journal of Statistics. 2011;5:899–934. [Google Scholar]
- Tucker JD, Cohen MS. China’s Syphilis Epidemic: Epidemiology, Proximate Determinants of Spread, and Control Responses. Current Opinion in Infectious Diseases. 2011 Feb;24(1):50–55. doi: 10.1097/QCO.0b013e32834204bf. [DOI] [PMC free article] [PubMed] [Google Scholar]
- Tucker JD, Chen XS, Peeling RW. Syphilis and social upheaval in China. N Engl J Med. 2010;362(18):1658–61. doi: 10.1056/NEJMp0911149. [DOI] [PubMed] [Google Scholar]
- Van Den Hoek A, Fu YL, Dukers NHTM, Chen ZH, Feng JT, Zhang LN, Zhang XX. High prevalence of syphilis and other sexually transmitted diseases among sex workers in China: potential for fast spread of HIV. AIDS. 2001;15(6):753–759. doi: 10.1097/00002030-200104130-00011. [DOI] [PubMed] [Google Scholar]
- Volz E, Heckathorn DD. Probability-based estimation theory for respondent driven sampling. J Off Stat. 2008;24:79–97. [Google Scholar]
- UNAIDS. A Framework for Monitoring and Evaluating HIV Prevention Programmes for Most-At-Risk Populations. UNAIDS/08.23E / JC1519E 2008 [Google Scholar]
- Wang L, Ding ZW, Ding GW, Guo W, Qin QQ, Li DM, Wang LY, Yan RX, Hei FX. Data analysis of national HIV comprehensive surveillance sites among female sex workers from 2004 to 2008. Zhonghua yu fang yi xue za zhi [Chinese journal of preventive medicine] 2009;43(11):1009. [PubMed] [Google Scholar]
- Wang QQ, Yang P, Gong XD, Jiang J, Yang B, Yang LG, Huang XX. Syphilis prevalence and high risk behaviors among female sex workers in different settings. Chin J AIDS STDs. 2009;15:398–400. [Google Scholar]
- Weir SS, Pailman C, Mahlalela X, et al. From people to places: Focusing AIDS prevention efforts where it matters most. AIDS. 2003;17(6):895–903. doi: 10.1097/01.aids.0000050809.06065.e0. [DOI] [PubMed] [Google Scholar]
- Weir S, Merli MG, Li J, Gandhi AD, Neely WW, Edwards JK, Suchindran CM, Henderson GE, Chen X. A comparison of respondent-driven and venue-based sampling of female sex workers in Liuzhou, China. Sexually Transmitted Infections. 2012 Dec;88(Suppl 2):i95–i101. doi: 10.1136/sextrans-2012-050638. [DOI] [PMC free article] [PubMed] [Google Scholar]
- Wejnert C. An Empirical Test of Respondent-Driven Sampling: Point Estimates, Variance, Degree Measures, and Out-of-Equilibrium Data. Sociological Methodology. 2009;39:73–116. doi: 10.1111/j.1467-9531.2009.01216.x. [DOI] [PMC free article] [PubMed] [Google Scholar]
- Wejnert C, Heckathorn DD. Web-based Network Sampling: Efficiency and Efficacy of Respondent-Driven Sampling for Online Research. Sociological Methods and Research. 2008;37:105–134. [Google Scholar]
- White RG, Lansky A, Goel S, Wilson D, Hladik W, Hakim A, Frost SDW. Respondent Driven Sampling: Where we are and where should we be going? Sexually Transmitted Infections. 2012;88(6):397–99. doi: 10.1136/sextrans-2012-050703. [DOI] [PMC free article] [PubMed] [Google Scholar]
- Xia G, Yang X. Risky sexual behavior among female entertainment workers in China: Implications for HIV/STD prevention intervention. AIDS Education and Prevention. 2005;17(2):143–156. doi: 10.1521/aeap.17.3.143.62904. [DOI] [PubMed] [Google Scholar]
- Yamanis N, Merli MG, Neely WW, Tian FF, Moody J, Tu X, Gao E. An empirical analysis of the impact of recruitment patterns on RDS estimates among a socially ordered population of female sex workers. Sociological Methods and Research. 2013;42(3):392–425. doi: 10.1177/0049124113494576. [DOI] [PMC free article] [PubMed] [Google Scholar]
- Yan H, Poon AN, Zhang C. HIV/STI prevention interventions targeting FSWs in China: A systematic literature review. AIDS Care. 2011;23(sup1):54–65. doi: 10.1080/09540121.2011.554526. [DOI] [PubMed] [Google Scholar]