

Abstract
An oxidation-responsive contrast agent for magnetic resonance imaging was synthesized using Eu2+ and liposomes. Positive contrast enhancement was observed with Eu2+, and chemical exchange saturation transfer was observed before and after oxidation of Eu2+. Orthogonal detection modes render the concentration of Eu inconsequential to molecular information provided through imaging.
The power of magnetic resonance imaging (MRI) resides in the ability to ascertain anatomical information at high resolution for clinical (1 mm isotropic) and preclinical (0.025 mm isotropic) applications.1 Molecular information can also be obtained with MRI using responsive paramagnetic complexes (contrast agents) that alter water proton signal intensities in response to chemical events. Some contrast agents respond to changes in pH,2,3 temperature,4 metal ion concentration,5 enzyme activity,6,7 or partial pressure of oxygen,8 the presence of free radicals,9 antioxidants,10 phosphate diesters,11 singlet oxygen,12 reduced glutathione and hydrogen peroxide,13 or oxygen, dithionite, and cysteine.14 Of particular interest are targets that cause changes in redox behavior because they are associated with cancer,15 inflammation,16 and cardiovascular diseases.17 Accordingly, responsive contrast agents that target redox changes have the potential to greatly improve the diagnostic capabilities of MRI. However, a critical limitation of responsive contrast agents that hinders their use in vivo is that determination of molecular information requires knowledge of the concentration of contrast agent, which is exceedingly difficult to measure in vivo. Some systems have achieved concentration independence in contrast-enhanced MRI through ratiometric techniques (longitudinal vs. transverse relaxation rates),18 ratiometric chemical exchange saturation transfer (CEST) techniques,2,12 or the use of orthogonal detection modes with a multimodal agent;19 however, to the best of our knowledge, no reported system demonstrates a concentration-independent response to general oxidizing events based on tunable oxidation potentials. An ideal metal ion for multimodal redox response is Eu2+ because the Eu2+ and Eu3+ oxidation states orthogonally enhance T1-weighted and CEST images, respectively, in MRI. Furthermore, Eu2+ has a tunable oxidation potential20 and outperforms clinically approved T1-shortening contrast agents at ultra-high magnetic field strengths.21 To address the need for a concentration-independent, oxidation-responsive contrast agent, we hypothesized that encapsulating the Eu2+-containing complex (4,7,13,16,21,24-hexaoxa-1,10-diazabicyclo[8.8.8]hexacosane europium(II), Eu(2.2.2)2+, Fig. 1) in liposomes would produce an oxidation-responsive dual-mode contrast agent because it would enhance either T1-weighted images or CEST images depending on the oxidation state of Eu.
Fig. 1.
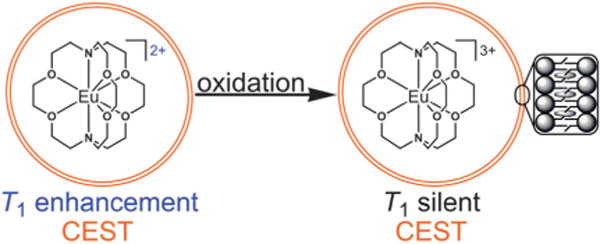
Representation of the oxidation of liposome-encapsulated Eu(2.2.2)2+ (T1 enhancement and CEST effect) to form a liposome filled with Eu3+ (T1 silent with CEST effect). On the far right is a depiction of the liposomal phospholipid bilayer with ovals as cholesterol molecules. For clarity, only one complex is shown in each liposome and coordinated water molecules are not drawn.
Our design was based on the oxidation of Eu2+ to Eu3+ because these two oxidation states offer orthogonal modes of detection by MRI and the Eu2+/3+ oxidation state switch offers an ideal platform for oxidation-responsive contrast enhancement.8,22 The use of this switch has awaited sufficient stabilization of Eu2+ that we recently demonstrated through modifications to Eu(2.2.2)2+ ligand structure.20 Furthermore, changes to ligand structure made the corresponding oxidation potential of Eu2+ tunable over a physiologically relevant range.20 Here, we report the encapsulation of Eu(2.2.2)2+ in liposomes and distinct oxidation-responsive, dual-mode imaging behavior. This system is expected to open the door for concentration-independent diagnostic imaging of redox-active disease states using the chemistry of Eu.
Our system used liposomes because their aqueous inner cavity can encapsulate water-soluble contrast agents to improve the sensitivity of CEST by increasing the ratio of chemically shifted water protons (associated with liposomes) to bulk water protons (not associated with liposomes).23 Liposome composition was adapted from a report that used 1-palmitoyl-2-oleoyl-sn-glycero-3-phosphocholine and cholesterol,24 and liposomes were characterized using dynamic light scattering. The average diameter measured before and after air exposure was 110 ± 7 and 106 ± 6 nm, respectively, where the diameter error is the standard error calculated from the average polydispersity index values. The average liposome polydispersity index value before and after air exposure was 0.14 ± 0.01 and 0.10 ± 0.06, respectively, where the polydispersity index error is the standard error at the 95% confidence interval. These size distribution data indicate that average liposome size was not different before and after oxidation (Student’s t-test) and, consequently, not affected by the intraliposomal formation of Eu3+.
To evaluate the response of our liposomes, we encapsulated 45 mM Eu(2.2.2)2+ because of previous studies that loaded similar or higher concentrations of paramagnetic complexes into liposomes.4b,23 After removing non-encapsulated Eu(2.2.2)2+ by spin filtering, we characterized suspensions of liposomes containing Eu(2.2.2)2+ before and after exposure to air. Molecular oxygen within air was chosen as a convenient source of oxidant to demonstrate a response corresponding to oxidation of Eu(2.2.2)2+. This mechanism of response is most likely diffusion of oxygen into the buffer and across the liposome membrane. Once oxygen has crossed the membrane, it can oxidize Eu(2.2.2)2+ (T1 enhancing agent) to form Eu(2.2.2)3+ (T1 silent), and consequently, the response to oxidation can be detected by loss of T1 enhancement. Support for the oxygen diffusion mechanism was found by measuring the change in T1 as a function of air exposure for liposome suspensions containing Eu(2.2.2)2+. Without stirring, Eu(2.2.2)2+ within liposomes required 7 h to oxidize in air. Upon stirring, however, Eu(2.2.2)2+ within liposomes oxidized within 10 min of air exposure. Stirring the solution would facilitate an increased rate of oxygen diffusion, which would accelerate the rate of oxidation. To ensure complete oxidation of Eu(2.2.2)2+ to form Eu(2.2.2)3+ within the oxidized samples, liposomes were exposed to air for 24 h without stirring because of the small size of the sample tube prior to imaging. After air exposure we observed an 86% decrease in T1 (0.4 and 2.8 s for the same sample before and after air exposure, respectively, at 24 °C, 11.7 T, and 45 mM in Eu), which is a response similar to or greater than other reported contrast agents.25 A rationale for the large change in T1 is that Eu2+ is isoelectronic with Gd3+, but Eu3+ is diamagnetic in its ground state and is not expected to dramatically influence T1. The observation of T1 changing upon air exposure is in good agreement with the T1-shortening nature of Eu(2.2.2)2+ (relaxivity was 3.99 mM−1 s−1 outside of liposomes and 0.2 mM−1 s−1 inside of liposomes at 20 °C and 11.7 T. The lower relaxivity is expected for T1-shortening contrast agents encapsulated in spherical liposomes).21,26 Furthermore, the change in T1 upon air exposure indicates that oxidation to form Eu(2.2.2)3+ caused the observed lengthening of T1.
To characterize the dual-mode behavior of Eu-containing liposomes, we investigated the CEST response before and after air exposure by measuring in vitro image intensities as a function of frequency offset of presaturation at 7 T. The intensity data (Fig. S1, ESI†) was modeled with a Lorentzian function using least squares fitting to reference the upfield signal to 0 ppm. Lorentzian fitting was use because the sample images were acquired simultaneously and the bulk water signals were not centered at 0 ppm. We chose to average the CEST spectra because it appeared that both the proximity to the bulk water signal and inhomogeneity in the magnetic field led to variability in the intensity measurements. The average CEST spectra (Fig. 2) revealed that liposomes before and after 24 h air exposure exhibited an exchangeable proton signal at 1.2 ppm relative to bulk water. Additionally, there was no significant difference between the CEST effect before and after oxidation of Eu (Fig. 2), which demonstrates that the CEST effect does not change after Eu(2.2.2)2+ has oxidized to Eu(2.2.2)3+. Although this shift is small, it is possible to image such shifts in vivo:27,28 in vivo CEST has been observed between bulk water and exchangeable protons of liposomes shifted by as little as 0.8 ppm.27
Fig. 2.
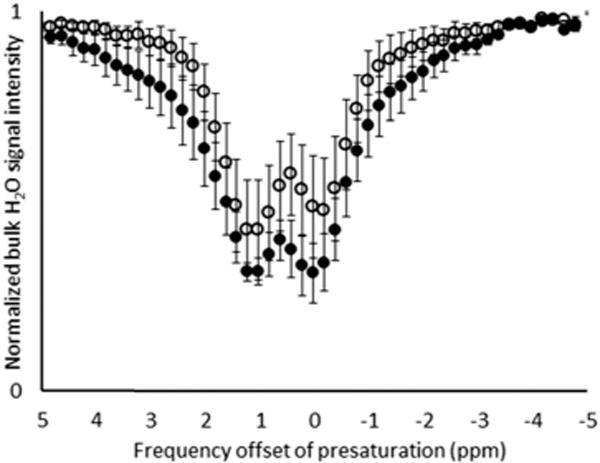
CEST spectra (7 T and 24 °C) of Eu(2.2.2)2+-containing liposomes before (○) and after (●) 24 h air exposure. Data points represent the mean of six independently prepared samples [liposomes containing only phosphate-buffered saline; Sr(2.2.2)2+ (28 mM Sr); and Eu(2.2.2)2+ (13, 24, 40, and 45 mM Eu)], and error bars represent the standard error of the mean. The upfield signal was referenced to 0 ppm using the Lorentzian-fitted spectra and signal intensities were calculated from in vitro images after a 2 s presaturation with a 17 μT radiofrequency pulse from 5 to −5 ppm in 0.2 ppm increments.
To investigate the cause of CEST effect before oxidation of Eu, we acquired CEST spectra for a series of samples including blank liposomes containing only phosphate-buffered saline, liposomes containing Sr(2.2.2)2+ (28 mM Sr) as a diamagnetic analog, and liposomes containing four different concentrations of Eu(2.2.2)2+ (13, 24, 40, and 45 mM Eu) (Fig. 2 and 3). CEST effect was observed for each sample as a broad signal in the chemical shift range of 1–2 ppm relative to bulk water. Furthermore, there was no correlation between Eu concentration and CEST effect. These experiments suggest that the observed CEST effect is due to the liposome membrane itself rather than Eu within the liposome cavity. These results are fully consistent with a recent demonstration of a CEST effect using diamagnetic liposomes that contained cholesterol and, of particular importance, the proton signal at ~1 ppm downfield from bulk water was assigned to hydroxyl protons.27 Additional support for our observations can be found in a previous report of magnetization transfer for a lipid and cholesterol system in which magnetization transfer exhibited a strong dependence on cholesterol concentration (30–60 mol%),29 and the concentration of cholesterol in our system (42 mol%) falls in this range. Furthermore, our data provide an explanation for the observation of CEST before oxidation of Eu2+ by revealing an exchange between the liposome membrane and bulk water. In this proposed exchange mechanism, Eu(2.2.2)2+ is confined to the intraliposomal cavity and, consequently, would not interact with protons exchanging on the outer surface of the liposome.
Fig. 3.
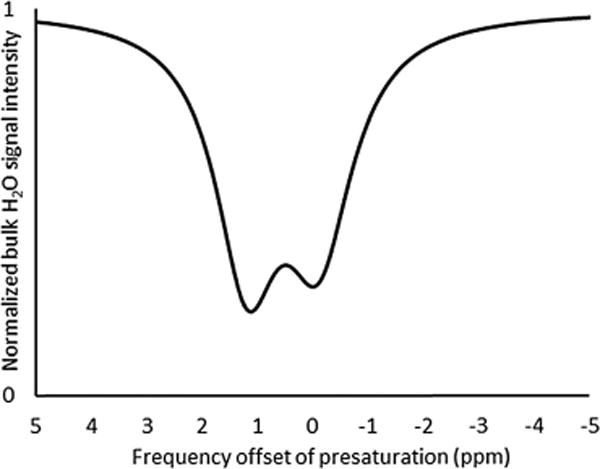
Lorentzian-fitted CEST spectrum (7 T and 24 °C) of liposomes filled with phosphate-buffered saline. The upfield signal was referenced to 0 ppm, and signal intensities were calculated from in vitro images after a 2 s presaturation with a 17 μT radiofrequency pulse from 5 to −5 ppm in 0.2 ppm increments.
To visualize the nature of the Eu2+/3+ responses, we acquired in vitro images of suspensions of our liposomes before and after air exposure (Fig. 4). The T1-weighted images confirmed positive contrast enhancement for the Eu(2.2.2)2+-containing liposomes and also revealed no significant difference in signal intensity between water and the oxidized Eu3+-containing liposomes at the 95% confidence interval (Student’s t-test). Consistent with our NMR studies that showed an 86% decrease in T1 after exposure to air, there was an 81% decrease in signal intensity in T1-weighted images before and after oxidation. To quantify the CEST effect, the phantom image intensities were used to calculate %CEST defined as (1 – Mz/M0)100, where Mz and M0 are the average signal intensities at the on- and off-resonance positions.30 The CEST map confirmed the presence of exchangeable protons before and after oxidation and that %CEST was not significantly different after oxidation based on the standard error of the CEST effect measurements in Fig. 2. Based on our control experiments, the change in CEST effect is not due to the presence of Eu, despite the influence of T1 on the CEST effect.31 Nevertheless, these data demonstrate a distinct dual-mode response and reveal the oxidation state of Eu without knowledge of its concentration. Therefore, (1) if T1 enhancement and CEST effect are both present, the agent has not responded. Similarly, (2) if T1 enhancement is no longer observed and CEST effect is still present, then the agent has responded. If neither forms of contrast are detected, then (3) the agent is no longer present or is present at a level below the detection limit of MRI. Based on these three scenarios, one can determine the oxidation state of Eu (and therefore a response) without knowledge of the concentration of Eu. This method does not quantify the amount of oxidant present, but reports on the oxidation itself in a concentration-independent manner by using two orthogonal detection modes (one of which changes and one of which does not change in response to oxidation).
Fig. 4.
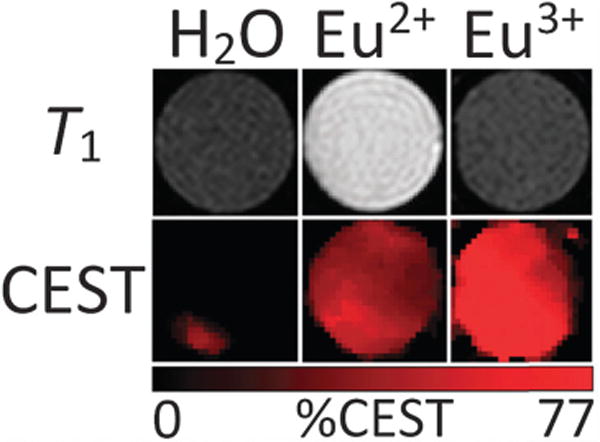
MR phantom images (5 mm tube diameter) at 7 T and 24 °C of water, non-oxidized liposomes containing Eu2+, and oxidized liposomes containing Eu3+. In the top row are T1-weighted images and on the bottom is a CEST map generated by subtracting presaturation at 1.2 ppm from presaturation at −1.2 ppm and the difference was divided by presaturation at −1.2 ppm. %CEST represents the decrease in bulk water signal intensity as a result of presaturation exchangeable water protons associated with liposomes. Based on the error associated with the CEST imaging, the difference between the Eu2+ and Eu3+ samples is not significant.
With this demonstration of distinct orthogonal imaging, we envision tracking the migration of the contrast agent with T1-weighted imaging. Upon disappearance of T1 enhancement, the imaging mode of detection would be changed to CEST. The presence of CEST effect would indicate oxidation, and an absence of CEST effect would indicate clearance of the contrast agent. Furthermore, CEST effect could be used to indicate one or more specific disease states because the oxidation potential, and consequently loss of T1 enhancement, of Eu(2.2.2)2+ is tunable through ligand structure modifications.20 Accordingly, our in vitro data provide a strong framework for optimizing our system for in vivo imaging.
The kinetic stability of Eu(2.2.2)3+ relative to Eu(2.2.2)2+ is of importance because of the toxic nature of uncomplexed trivalent lanthanide ions. It has been demonstrated that Eu(2.2.2)3+ is less kinetically stable relative to Eu(2.2.2)2+,32 which is primarily due to the reduction in size of Eu upon oxidation. To demonstrate that our liposomes did not leach Eu, the oxidized liposomes were filtered, and the Eu concentration of the filtrate was measured to be below the detection limit (<66 nM) of inductively coupled plasma optical emission spectroscopy. This result indicates that the liposome traps uncomplexed Eu3+, which is likely present as a species coordinated with phosphate from the buffer, phosphate from the phospholipid membrane, or as the free aqua ion.
In conclusion, we have demonstrated the first oxidation-responsive dual-mode contrast agent for MRI based on the redox chemistry of Eu. Contrast enhancement in orthogonal imaging modes allows for the detection of Eu oxidation states without knowledge of contrast agent concentration. Notably, the response of our system is irreversible due to the stability of Eu3+ with respect to reduction. Irreversible response is potentially advantageous in vivo because the contrast agent is in a dynamic environment and can indicate oxidation even if no longer in the oxidizing region. For these reasons, we expect this system to open the door for molecular imaging using the Eu2+/3+ redox switch, and we are currently exploring the scope of the system to identify physiologically relevant oxidants and the kinetics of intraliposomal Eu2+ oxidation.
Supplementary Material
Acknowledgments
The authors acknowledge research support from a Schaap Faculty Scholar Award (M.J.A.) and the National Institutes of Health (NIH) grant EB013663 (M.J.A.). Imaging time was supported by NIH grant CA129173 (M.M.A.). We thank Mark D. Pagel and Tian Shi for helpful discussions.
Footnotes
Electronic supplementary information (ESI) available: Experimental procedures, preparation of hydration solution, preparation of liposomes, raw CEST data, Lorentzian function fitting, and dynamic light scattering data. See DOI: 10.1039/c4cc07027e
Notes and references
- 1.(a) Hermann P, Kotek J, Kubíček V, Lukeš I. Dalton Trans. 2008:3027. doi: 10.1039/b719704g. [DOI] [PubMed] [Google Scholar]; (b) Radecki G, Nargeot R, Jelescu IO, Le Bihan D, Ciobanu L. Proc Natl Acad Sci U S A. 2014;111:8667. doi: 10.1073/pnas.1403739111. [DOI] [PMC free article] [PubMed] [Google Scholar]
- 2.Wu Y, Soesbe TC, Kiefer GE, Zhao P, Sherry AD. J Am Chem Soc. 2010;132:14002. doi: 10.1021/ja106018n. [DOI] [PMC free article] [PubMed] [Google Scholar]
- 3.(a) Torres E, Mainini F, Napolitano R, Fedeli F, Cavalli R, Aime S, Terreno E. J Controlled Release. 2011;154:196. doi: 10.1016/j.jconrel.2011.05.017. [DOI] [PubMed] [Google Scholar]; Opina ACL, Wu Y, Zhao P, Kiefer G, Sherry AD. Contrast Media Mol Imaging. 2011;6:(b). 459. doi: 10.1002/cmmi.445. [DOI] [PMC free article] [PubMed] [Google Scholar]; Ali MM, Woods M, Caravan P, Opina ACL, Spiller M, Fettinger JC, Sherry AD. Chem – Eur J. 2008;14:(c). 7250. doi: 10.1002/chem.200800402. [DOI] [PMC free article] [PubMed] [Google Scholar]; Tóth É, Bolskar RD, Borel A, González G, Helm L, Merbach AE, Sitharaman B, Wilson LJ. J Am Chem Soc. 2005;127:(d). 799. doi: 10.1021/ja044688h. [DOI] [PubMed] [Google Scholar]; Woods M, Kiefer GE, Bott S, Castillo-Muzquiz A, Eshelbrenner C, Michaudet L, McMillan K, Mudigunda SDK, Ogrin D, Tircsó G, Zhang S, Zhao P, Sherry AD. J Am Chem Soc. 2004;126:(e). 9248. doi: 10.1021/ja048299z. [DOI] [PMC free article] [PubMed] [Google Scholar]
- 4.(a) Coman D, Kiefer GE, Rothman DL, Sherry AD, Hyder F. NMR Biomed. 2011;24:1216. doi: 10.1002/nbm.1677. [DOI] [PMC free article] [PubMed] [Google Scholar]; (b) Langereis S, Keupp J, van Velthoven JLJ, de Roos IHC, Burdinski D, Pikkemaat JA, Grüll H. J Am Chem Soc. 2009;131:1380. doi: 10.1021/ja8087532. [DOI] [PubMed] [Google Scholar]; (c) Zhang S, Malloy CR, Sherry AD. J Am Chem Soc. 2005;127:17572. doi: 10.1021/ja053799t. [DOI] [PMC free article] [PubMed] [Google Scholar]
- 5.(a) Que EL, Gianolio E, Baker SL, Wong AP, Aime S, Chang CJ. J Am Chem Soc. 2009;131:8527. doi: 10.1021/ja900884j. [DOI] [PubMed] [Google Scholar]; (b) Li W, Fraser SE, Meade TJ. J Am Chem Soc. 1999;121:1413. [Google Scholar]; (c) Trokowski R, Ren J, Kálmán FK, Sherry AD. Angew Chem, Int Ed. 2005;44:6920. doi: 10.1002/anie.200502173. [DOI] [PubMed] [Google Scholar]
- 6.(a) Hingorani DV, Randtke EA, Pagel MD. J Am Chem Soc. 2013;135:6396. doi: 10.1021/ja400254e. [DOI] [PMC free article] [PubMed] [Google Scholar]; (b) Moats RA, Fraser SE, Meade TJ. Angew Chem, Int Ed Engl. 1997;36:726. [Google Scholar]
- 7.Liu G, Liang Y, Bar-Shir A, Chan KWY, Galpoththawela CS, Bernard SM, Tse T, Yadav NN, Walczak P, McMahon MT, Bulte JWM, van Zijl PCM, Gilad AA. J Am Chem Soc. 2011;133:16326. doi: 10.1021/ja204701x. [DOI] [PMC free article] [PubMed] [Google Scholar]
- 8.Aime S, Botta M, Gianolio E, Terreno E. Angew Chem, Int Ed. 2000;39:747. doi: 10.1002/(sici)1521-3773(20000218)39:4<747::aid-anie747>3.0.co;2-2. [DOI] [PubMed] [Google Scholar]
- 9.(a) Gløgård C, Stensrud G, Aime S. Magn Reson Chem. 2003;41:585. [Google Scholar]; (b) Liu G, Li Y, Pagel MD. Magn Reson Med. 2007;58:1249. doi: 10.1002/mrm.21428. [DOI] [PubMed] [Google Scholar]
- 10.Ratnakar SJ, Soesbe TC, Lumata LL, Do QN, Viswanathan S, Lin CY, Sherry AD, Kovacs Z. J Am Chem Soc. 2013;135:14904. doi: 10.1021/ja406738y. [DOI] [PMC free article] [PubMed] [Google Scholar]
- 11.Huang CH, Hammell J, Ratnakar SJ, Sherry AD, Morrow JR. Inorg Chem. 2010;49:5963. doi: 10.1021/ic1004616. [DOI] [PMC free article] [PubMed] [Google Scholar]
- 12.Song B, Wu Y, Yu M, Zhao P, Zhou C, Kiefer GE, Sherry AD. Dalton Trans. 2013;42:8066. doi: 10.1039/c3dt50194a. [DOI] [PMC free article] [PubMed] [Google Scholar]
- 13.Loving GS, Mukherjee S, Caravan P. J Am Chem Soc. 2013;135:4620. doi: 10.1021/ja312610j. [DOI] [PMC free article] [PubMed] [Google Scholar]
- 14.Tsitovich PB, Spernyak JA, Morrow JR. Angew Chem. 2013;125:14247. doi: 10.1002/anie.201306394. [DOI] [PMC free article] [PubMed] [Google Scholar]
- 15.(a) Facciabene A, Peng X, Hagemann IS, Balint K, Barchetti A, Wang LP, Gimotty PA, Gilks CB, Lal P, Zhang L, Coukos G. Nature. 2011;475:226. doi: 10.1038/nature10169. [DOI] [PubMed] [Google Scholar]; (b) Shweiki D, Itin A, Soffer D, Keshet E. Nature. 1992;359:843. doi: 10.1038/359843a0. [DOI] [PubMed] [Google Scholar]
- 16.Karhausen J, Furuta GT, Tomaszewski JE, Johnson RS, Colgan SP, Haase VH. J Clin Invest. 2004;114:1098. doi: 10.1172/JCI21086. [DOI] [PMC free article] [PubMed] [Google Scholar]
- 17.Weir EK, López-Barneo J, Buckler KJ, Archer SL. N Engl J Med. 2005;353:2042. doi: 10.1056/NEJMra050002. [DOI] [PMC free article] [PubMed] [Google Scholar]
- 18.Aime S, Fedeli F, Sanino A, Terreno E. J Am Chem Soc. 2006;128:11326. doi: 10.1021/ja062387x. [DOI] [PubMed] [Google Scholar]
- 19.Terreno E, Boffa C, Menchise V, Fedeli F, Carrera C, Castelli DD, Digilio G, Aime S. Chem Commun. 2011;47:4667. doi: 10.1039/c1cc10172b. [DOI] [PubMed] [Google Scholar]
- 20.Gamage NDH, Mei Y, Garcia J, Allen MJ. Angew Chem, Int Ed. 2010;49:8923. doi: 10.1002/anie.201002789. [DOI] [PMC free article] [PubMed] [Google Scholar]
- 21.(a) Garcia J, Neelavalli J, Haacke EM, Allen MJ. Chem Commun. 2011;47:12858. doi: 10.1039/c1cc15219j. [DOI] [PMC free article] [PubMed] [Google Scholar]; (b) Garcia J, Kuda-Wedagedara ANW, Allen MJ. Eur J Inorg Chem. 2012:2135. doi: 10.1002/ejic.201101166. [DOI] [PMC free article] [PubMed] [Google Scholar]
- 22.Burai L, Scopelliti R, Tóth E. Chem Commun. 2002:2366. doi: 10.1039/b206709a. [DOI] [PubMed] [Google Scholar]
- 23.(a) Aime S, Castelli DD, Terreno E. Angew Chem, Int Ed. 2005;44:5513. doi: 10.1002/anie.200501473. [DOI] [PubMed] [Google Scholar]; (b) Zhao JM, Har-el Y, McMahon MT, Zhou J, Sherry AD, Sgouros G, Bulte JWM, van Zijl PCM. J Am Chem Soc. 2008;130:5178. doi: 10.1021/ja710159q. [DOI] [PMC free article] [PubMed] [Google Scholar]
- 24.Gianolio E, Porto S, Napolitano R, Baroni S, Giovenzana GB, Aime S. Inorg Chem. 2012;51:7210. doi: 10.1021/ic300447n. [DOI] [PubMed] [Google Scholar]
- 25.(a) Moats RA, Fraser SE, Meade TJ. Angew Chem, Int Ed Engl. 1997;36:726. [Google Scholar]; (b) Duimstra JA, Femia FJ, Meade TJ. J Am Chem Soc. 2005;127:12847. doi: 10.1021/ja042162r. [DOI] [PubMed] [Google Scholar]; (c) Hanaoka K, Kikuchi K, Urano Y, Nagano T. J Chem Soc, Perkin Trans 2. 2001:1840. [Google Scholar]; (d) Hanaoka K, Kikuchi K, Urano Y, Narazaki M, Yokawa T, Sakamoto S, Yamaguchi K, Nagano T. Chem Biol. 2002;9:1027. doi: 10.1016/s1074-5521(02)00216-8. [DOI] [PubMed] [Google Scholar]; (e) Hifumi H, Tanimoto A, Citterio D, Komatsu H, Suzuki K. Analyst. 2007;132:1153. doi: 10.1039/b707225b. [DOI] [PubMed] [Google Scholar]; (f) Tu C, Osborne EA, Louie AY. Tetrahedron. 2009;65:1241. doi: 10.1016/j.tet.2008.12.020. [DOI] [PMC free article] [PubMed] [Google Scholar]; (g) Martinelli J, Fekete M, Tei L, Botta M. Chem Commun. 2011;47:3144. doi: 10.1039/c0cc05428c. [DOI] [PubMed] [Google Scholar]; (h) Shuhendler AJ, Staruch R, Oakden W, Gordijo CR, Rauth AM, Stanisz GJ, Chopra R, Wu XY. J Controlled Release. 2012;157:478. doi: 10.1016/j.jconrel.2011.09.061. [DOI] [PubMed] [Google Scholar]; (i) Xu W, Lu Y. Chem Commun. 2011;47:4998. doi: 10.1039/c1cc10161g. [DOI] [PMC free article] [PubMed] [Google Scholar]; (j) Catanzaro V, Gringeri CV, Menchise V, Padovan S, Boffa C, Dastrù W, Chaabane L, Digilio G, Aime S. Angew Chem, Int Ed. 2013;52:3926. doi: 10.1002/anie.201209286. [DOI] [PubMed] [Google Scholar]
- 26.Aime S, Castelli DD, Lawson D, Terreno E. J Am Chem Soc. 2007;129:2430. doi: 10.1021/ja0677867. [DOI] [PubMed] [Google Scholar]
- 27.Liu G, Moake M, Har-el Y, Long CM, Chan KWY, Cardona A, Jamil M, Walczak P, Gilad AA, Sgouros G, van Zijl PCM, Bulte JWM, McMahon MT. Magn Reson Med. 2012;67:1106. doi: 10.1002/mrm.23100. [DOI] [PMC free article] [PubMed] [Google Scholar]
- 28.(a) Longo DL, Dastrù W, Digilio G, Keupp J, Langereis S, Lanzardo S, Prestigio S, Steinbach O, Terreno E, Uggeri F, Aime S. Magn Reson Med. 2011;65:202. doi: 10.1002/mrm.22608. [DOI] [PubMed] [Google Scholar]; (b) Zheng S, van der Bom IMJ, Zu Z, Lin G, Zhao Y, Gounis MJ. Magn Reson Med. 2014;71:1082. doi: 10.1002/mrm.24770. [DOI] [PubMed] [Google Scholar]; (c) Chan KWY, Yu T, Qiao Y, Liu Q, Yang M, Patel H, Liu G, Kinzler KW, Vogelstein B, Bulte JWM, van Zijl PCM, Hanes J, Zhou S, McMahon MT. J Controlled Release. 2014;180:51. doi: 10.1016/j.jconrel.2014.02.005. [DOI] [PMC free article] [PubMed] [Google Scholar]; (d) Sun PZ, Wang E, Cheung JS, Zhang X, Benner T, Sorensen AG. Magn Reson Med. 2011;66:1042. doi: 10.1002/mrm.22894. [DOI] [PMC free article] [PubMed] [Google Scholar]; (e) Bar-Shir A, Liu G, Liang Y, Yadav NN, McMahon MT, Walczak P, Nimmagadda S, Pomper MG, Tallman KA, Greenberg MM, van Zijl PCM, Bulte JWM, Gilad AA. J Am Chem Soc. 2013;135:1617. doi: 10.1021/ja312353e. [DOI] [PMC free article] [PubMed] [Google Scholar]
- 29.Fralix TA, Ceckler TL, Wolff SD, Simon SA, Balaban RS. Magn Reson Med. 1991;18:214. doi: 10.1002/mrm.1910180122. [DOI] [PubMed] [Google Scholar]
- 30.Opina ACL, Ghaghada KB, Zhao P, Kiefer G, Annapragada A, Sherry AD. PLoS One. 2011;6:e27370. doi: 10.1371/journal.pone.0027370. [DOI] [PMC free article] [PubMed] [Google Scholar]
- 31.van Zijl PCM, Yadav NN. Magn Reson Med. 2011;65:927. doi: 10.1002/mrm.22761. [DOI] [PMC free article] [PubMed] [Google Scholar]
- 32.Yee EL, Gansow OA, Weaver MJ. J Am Chem Soc. 1980;102:2278. [Google Scholar]
Associated Data
This section collects any data citations, data availability statements, or supplementary materials included in this article.