

Abstract
Proliferative vitreoretinopathy (PVR) is a nonneovascular blinding disease and the leading cause for failure in surgical repair of rhegmatogenous retinal detachments. Once formed, PVR is difficult to treat. Hence, there is an acute interest in developing approaches to prevent PVR. Of the many growth factors and cytokines that accumulate in vitreous as PVR develops, neutralizing vascular endothelial growth factor (VEGF) A has recently been found to prevent PVR in at least one animal model. The goal of this study was to test if Food and Drug Administration–approved agents could protect the eye from PVR in multiple animal models and to further investigate the underlying mechanisms. Neutralizing VEGF with aflibercept (VEGF Trap-Eye) safely and effectively protected rabbits from PVR in multiple models of disease. Furthermore, aflibercept reduced the bioactivity of both experimental and clinical PVR vitreous. Finally, although VEGF could promote some PVR-associated cellular responses via VEGF receptors expressed on the retinal pigment epithelial cells that drive this disease, VEGF's major contribution to vitreal bioactivity occurred via platelet-derived growth factor receptor α. Thus, VEGF promotes PVR by a noncanonical ability to engage platelet-derived growth factor receptor α. These findings indicate that VEGF contributes to nonangiogenic diseases and that anti–VEGF-based therapies may be effective on a wider spectrum of diseases than previously appreciated.
Proliferative vitreoretinopathy (PVR) occurs in 5% to 10% of eyes after surgical repair of rhegmatogenous retinal detachment (RD); in cases of RD arising from severe ocular trauma—such as penetration of the ocular globe—the incidence can be as high as 50%.1–4 PVR remains the prevalent obstacle to successful surgical outcome, accounting for nearly 75% of all surgical failures.5–7 Because of this, approaches to reduce its incidence are greatly needed.
PVR occurs when cells are dispersed into the vitreous cavity after a breach of the retina. These cells proliferate, generate extracellular matrix, and coalesce into an epiretinal membrane (ERM) capable of contracting and redetaching the retina.4,8–10 Growth factors and cytokines in vitreous act on the displaced cells to reduce their level of TP53, thereby boost their ability to resist apoptosis and senescence; such a mechanism explains how these cells can thrive and promote pathological features in the vitreous environment.11–14 These principles, which emerged from studies with cultured cells and animal models, are in agreement with recent genome-wide association studies that show a predisposition to PVR in patients with particular polymorphisms in the genes encoding the TP53 protein and its upstream negative regulator Mdm2.15–17
Efforts to identify vitreous growth factors and cytokines that drive PVR pathogenesis indicated that there is a long list of candidates, and that platelet-derived growth factors (PDGFs) are particularly notable because of their abundance.18 However, despite the concordance between the presence of PDGFs in vitreous and development of PVR, and the requirement for PDGF receptor α (PDGFRα) in experimental disease,19–22 PDGFs are dispensable for pathology. Instead, PDGFRα is activated indirectly by vitreal growth factors and cytokines outside of the PDGF family (non-PDGFs).22–24 These non-PDGFs drive an indirect mode of PDGFRα activation that circumvents receptor down-regulation (internalization and degradation) mediated by PDGF, thereby perpetuating PDGFRα activation.12 In cells harboring indirectly activated PDGFRα, the level of TP53 declines precipitously compared with the null/modest TP53 decline observed for cells in which PDGFRα has been activated directly.12 Thus, vitreous contains more than one class of PDGFRα agonist, and, more important, non-PDGFs are the key agonist driving PVR pathogenesis.
The presence of multiple classes of PDGFRα agonist in PVR vitreous begs the question of how they functionally interact to influence the bioactivity of vitreous.21,24–27 PDGF prevents the indirect activation of PDGFRα by assembling receptors into dimers, which are poorly activated by non-PDGFs.12,14,28 If PDGFs and non-PDGFs were the only agents influencing activation of PDGFRα, then PVR would never develop because the non-PDGFs are held in check by PDGFs. However, we recently reported that vascular endothelial growth factor (VEGF) A (herein referred to as VEGF) promotes the non–PDGF-dependent mode of activating PDGFRα by antagonizing PDGF-mediated dimerization of PDGFRs.28 Thus, there are three classes of growth factors (PDGFs, non-PDGFs, and VEGF) in PVR vitreous, which are engaged in functional interactions that determine the activation state of PDGFRα (Figure 1).
Figure 1.
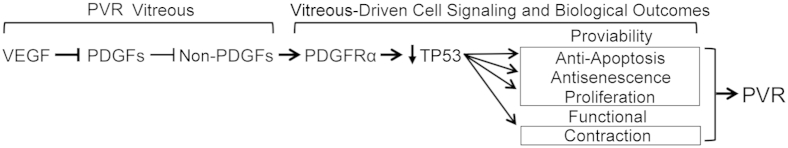
The bioactivity of proliferative vitreoretinopathy (PVR) vitreous depends on three classes of growth factors: vascular endothelial growth factor (VEGF), platelet-derived growth factor (PDGF), and non-PDGFs (growth factors outside of the PDGF family). The scheme shows the functional relationship for these growth factors and the signaling events and cellular responses triggered by indirectly activated PDGFRα. VEGF competitively inhibits PDGF-dependent activation of PDGFRα. This direct mode of activating PDGFRα antagonizes the indirect mode of activating PDGFRα, which is driven by non-PDGFs. Indirectly activated PDGFRα promotes TP53 reduction, a key event in driving PVR, because TP53 suppression promotes the viability of cells displaced into the vitreous and also mediates the contraction of PVR membranes formed from these cells; both outcomes are likely to contribute to retinal detachment.18
Figure 1 shows that VEGF enables non–PDGF-driven activation of PDGFRα and, therefore, predicts that VEGF is an Achilles heel of PVR. Indeed, we recently reported that neutralizing VEGF with ranibizumab mitigated the bioactivity of vitreous and prevented PVR in an animal model of this disease.14 In light of the translatability of this discovery, and because existing PVR prophylactic therapies are few and frequently ineffective,18 we tested the efficacy and safety of additional Food and Drug Administration–approved drugs to prevent PVR using multiple animal models. Herein, we report that aflibercept (trade name Eylea; Regeneron, Tarrytown, NY) safely and effectively protected rabbits from succumbing to PVR. Furthermore, aflibercept reduced the bioactivity of PVR vitreous isolated from experimental animals and patient donors. The results of these preclinical studies reinforce the emerging idea that anti-VEGF therapy may potentially apply as a prophylaxis for clinical PVR.
Materials and Methods
Biological Agents and Major Reagents
All antibodies, neutralizing agents, and human recombinant growth factors and cytokines used in this study are detailed in Table 1. Aflibercept/VEGF-Tr, a dimeric, recombinant fusion glycoprotein comprising portions of the VEGFR1 and VEGFR2 extracellular domains fused to the Fc region of human IgG1, was used as the VEGF neutralizing agent in all experiments. Human IgG1, added at an equimolar concentration to aflibercept, was used as the isotype-matched control. All growth factors/cytokines, except PDGF-D, were combined at their mean PVR vitreous concentrations and used directly to treat cells as part of growth factors PVR. Recombinant human PDGF-C, PDGF-D, hepatocyte growth factor (HGF), insulin-like growth factor (IGF)-1, and connective tissue growth factor (CTGF) were used as standards to quantify the level of their respective rabbit orthologs in experimental vitreous by using Western immunoblot analysis (quant-IB); all other growth factor/cytokine quantification was performed by multiplex assays (see Multiplex Analysis).
Table 1.
Antibodies, Neutralizing Agents, and Growth Factors/Cytokines Used in This Study
| Agent | Type/use | Source | Target | Effective dose∗ | Producer | Notes |
|---|---|---|---|---|---|---|
| Aflibercept | sR-Decoy | Engineered | VEGFs A-E, PlGF | 40 μg/μL (0.9 mg) | Regeneron | † |
| α-PDGF-AB | nAb | Human | PDGFs A, AB, B | Per manuf. | Millipore | |
| α-PDGF-C | nAb, quant-IB | Human | PDGF-C | 1:2000 serum Ab | ZymoGenetics (Seattle, WA) | 21 |
| α-PDGF-D | nAb, quant-IB | Human | PDGF-D | Per manuf. | R&D Systems (Minneapolis, MN) | |
| α-CTGF | nAb, quant-IB | Goat | CTGF (see Notes) | 200 ng/mL | Santa Cruz Biotechnology (Santa Cruz, CA) | 24 |
| sEGFR | sR-Decoy | Engineered | EGF, TGF-α | 4 μg/mL | R&D Systems | 27 |
| α-FGF-2 | nAb | Mouse | FGF-2 (bFGF) | Per manuf. | R&D Systems | |
| α-G-CSF | nAb | Rabbit | G-CSF | Per manuf. | Millipore | |
| α-HGF | nAb, quant-IB | Goat | HGF | Per manuf. | R&D Systems | |
| α-IFN-γ | nAb | Mouse | IFN-γ | Per manuf. | Millipore | |
| α-IGF-1 | nAb, quant-IB | Mouse | IGF-1 | Per manuf. | Millipore | |
| α-IL-6 | nAb | Mouse | IL-6 | Per manuf. | Millipore | |
| α-MCP-1 | nAb | Rabbit | MCP-1 | Per manuf. | Millipore | |
| α-TGF-β | nAb | Rabbit | TGF-βs (see Notes) | Per manuf. | R&D Systems | Detects β1-3 |
| α-TP53 | IB-Ab | Mouse | TP53 | 250 ng/mL | Cell Signaling (Beverly, MA) | |
| α-RasGAP | IB-Ab | Rabbit | RasGAP | 1:5000 Serum Ab | Kazlauskas Lab | |
| α-VEGFR2 | IB-Ab | Mouse | VEGFR2 | 100 ng/mL | Cell Signaling | |
| α-pVEGFR2 | IB-Ab | Rabbit | Phospho-VEGFR2 | 200 ng/mL | Cell Signaling | |
| HRP-α-IgG | Secondary Ab | Goat | Primary IB-Abs | Per manuf. | Santa Cruz | |
| Isotype IgGs | Control Ab | Human | NA | 52 μg/μL (1.2 mg) | Santa Cruz | ‡ |
| VEGF | GF | Human | VEGFR 1/2, PDGFRs | 2–50 ng/mL | NCI Repository | |
| PDGF-A | GF | Human | PDGFRα | 2–50 ng/mL | PeproTech (Rocky Hills, NJ) | |
| PDGF-AB | GF | Human | PDGFRs α and αβ | 2–50 ng/mL | PeproTech | |
| PDGF-B | GF | Human | PDGFRs | 2–50 ng/mL | PeproTech | |
| PDGF-C | GF, quant-IB | Human | PDGFRs α and αβ | 2–50 ng/mL | R&D Systems | |
| PDGF-D | GF, quant-IB | Human | PDGFRβ, (-αβ) | 2–50 ng/mL | R&D Systems | |
| CTGF | GF, quant-IB | Human | M6P, TrkA, others? | 2–50 ng/mL | PeproTech | |
| EGF | GF | Human | EGFR, HER2/3 | 5–50 ng/mL | PeproTech | |
| FGF-2 | GF | Human | FGFR-1 | 2–50 ng/mL | PeproTech | |
| G-CSF | GF | Human | G-CSF-R | 5–75 ng/mL | PeproTech | |
| HGF | GF, quant-IB | Human | c-Met | 2–50 ng/mL | PeproTech | |
| IFN-γ | GF | Human | IFN-γR | 0.5–25 ng/mL | PeproTech | |
| IGF-1 | GF, quant-IB | Human | IGFR-1, IR | 2–50 ng/mL | PeproTech | |
| IL-6 | GF | Human | IL-6R | 0.2–10 ng/mL | NCI Repository | |
| MCP-1 | GF | Human | CCR2 | 10–100 ng/mL | PeproTech | |
| TGF-α | GF | Human | EGFR | 5–50 ng/mL | PeproTech | |
| TGF-β1 | GF | Human | TGF-βR | 2–20 ng/mL | PeproTech | |
| TGF-β2 | GF | Human | TGF-βR | 2–20 ng/mL | PeproTech | |
| TGF-β3 | GF | Human | TGF-βR | 2–20 ng/mL | PeproTech |
All growth factor and cytokine antibodies used in this study detect both human and rabbit orthologs.
GF, recombinant human growth factor/cytokine; HRP, horseradish peroxidase; IB-Ab, Western immunoblot analysis antibody; Per manuf., set according to manufacturer's instructions; nAb, neutralizing antibody; PlGF, placenta growth factor; quant-IB, antibody used in quantitative Western immunoblot analysis or ligand used as a purified standard in quantitative Western immunoblot analysis; sR-Decoy, soluble receptor decoy (also considered ligand traps).
Values pertain to in vitro dosing, with the exception of values in parentheses, which indicate in vivo dosing amounts (ie, for intravitreal injections in experimental models).
Aflibercept is a fusion protein consisting of the extracellular domains of VEGFRs 1 and 2.
Amount used is equimolar to experimental treatment (with aflibercept).
All growth factor/cytokine antibodies used in this study, including those in multiplex assays, detect and neutralize human and rabbit orthologs equally well; this was determined, where necessary (ie, cross-species reactivity was not evident from analysis of shared epitope sequences, the literature, or technical manuals), by pilot experiments. The VEGFR tyrosine kinase inhibitor II (VR-Inh) was obtained from Calbiochem (San Diego, CA; catalog number 676481), and blocks both VEGFR1 and VEGFR2 kinases (inhibitory concentration of 50% of 180 and 20 nmol/L, respectively). To ensure that both VEGFR kinases were completely inhibited by the time treatment was administered, cells were pretreated for 30 minutes with inhibitor, and added at a final concentration of 360 nmol/L.
Experimental PVR Models
PVR was induced in the right eyes of outbred composite pigmented rabbits [retinal pigment epithelium (RPE)-injection model, purchased from Robinson Services Inc., Mocksville, NC] or Dutch-belted rabbits (fibroblast-injection model, purchased from Millbrooke, Rockland, MA), as previously described.14,19,24,29–31 In brief, rabbits were acclimated for 1 week, anesthetized, and then injected with 0.1 mL of perfluoropropane gas (Alcon, Fort Worth, TX) into the vitreous cavity 3 to 4 mm posterior to the limbus. After 1 week, rabbits were anesthetized and each experimental eye was injected with 2.5 × 10⁵ ARPE-19α cells (RPE-injection model) or 2 × 10⁵ rabbit conjunctival fibroblasts (RCFs; fibroblast-injection model) in 0.1 mL platelet-rich plasma (PRP) and 0.1 mL of balanced salt solution containing either 0.88 mg aflibercept (a dose equivalent to 2.0 mg in humans, as determined by interspecies dose extrapolation32) or an equimolar amount of isotype-matched control IgG1 (IgG). The PRP, obtained from rabbits immediately before injection, is thought to emulate the intravitreal plasma influx that accompanies traumatic PVR in humans and is used to enhance the severity and consistency of pathological features in these models.19 Because of the longer time course used for the RPE-injection model (49 days, compared with 28 days for the fibroblast-injection model), rabbits were injected again on day 21 with aflibercept/IgG. Left eyes were not injected.
Retinal status was monitored using an indirect ophthalmoscope (Keeler Instruments, Broomall, PA) fitted with a 30-diopter fundus lens (Volk Optical, Mentor, OH) at days 1, 3, 5, and 7, and once per week thereafter until the end of the experiment (day 49 for RPE-injection model, day 28 for fibroblast-injection model). Fundus photography was performed using the iPhone 5 (Apple, Cupertino, CA) and a 30-diopter lens, as previously described.33 Intraocular pressures were monitored daily for 3 days after gas injection and for 1 day after the coinjections using a Tono-Pen (Reichert Technologies, Depew, NY). PVR was graded using the Fastenberg 5-stage scale34: stage 0, no observable disease; stage 1, presence of an ERM; stage 2, ERM with focal retinal traction; stage 3, localized RD of one to two quadrants; stage 4, extensive RD of two to four quadrants without complete detachment; and stage 5, complete RD. Signs of toxicity during the experiment, including intraocular inflammation and retinal hemorrhages, were assessed during each fundus examination. Two days before the end of each experiment, electroretinograms (ERGs) were obtained from rabbits representative of each treatment type (see below). At the end of the experiment, rabbits were sacrificed, eyes were enucleated, and then eyes were either fixed in 10% formalin, embedded in methacrylate, and divided into sections for histological analysis with hematoxylin and eosin (H&E), or frozen at −80°C for subsequent extraction of vitreous. All procedures were performed aseptically and in pursuance with the Association for Research in Vision and Ophthalmology Statement for the Use of Animals in Ophthalmic and Vision Research. The Schepens Animal Care and Use Committee approved the protocol (S-349-0715) used for these animal experiments.
Electroretinography of Rabbits
Rabbit ERGs were obtained 2 days before the end of each experiment, on the basis of the protocol of Duke et al.35 Retinal function was thoroughly assessed by obtaining ERGs after scotopic flash, photopic flash, and photopic flicker modes of stimulation using the ColorDome stimulator (Diagnosys, Westford, MA), and analyzing the a- and b-wave components, as described previously.36–39 Three representative rabbits from aflibercept- or IgG-treated groups were used to obtain ERGs. The noninjected contralateral eye was measured to obtain reference readout for each rabbit.
Preparation and Use of Rabbit Vitreous
Vitreous was removed from frozen eyes, allowed to thaw to room temperature, and then centrifuged at 4°C for 5 minutes at 10,000 × g. The resultant clarified vitreous was used for subsequent analysis. Vitreous was from PVR-positive rabbit eyes (RV-PVR), PVR-negative aflibercept-treated eyes (RV-VTr), or healthy noninjected control eyes (RV). Half the volume of each sample was set aside for quantitation (see below). All vitreous used to treat cells is an equal-volume mix from several (five or more) rabbit eyes of the same PVR stage. Vitreous was diluted 1:1 in serum-free medium immediately before using it for treatment.
Cell Culture and Treatment
ARPE-19α cells are derived from the human retinal pigment epithelial (RPE) cell line ARPE-19 (ATCC, Manassas, VA) and made to overexpress human PDGFRα.21 Primary RCFs were isolated as described previously.31 ARPE-19α and RCFs are used in the RPE-injection model and fibroblast-injection model of PVR, respectively. RPEM cells are primary RPE cells isolated from a human PVR membrane surgically removed during routine vitrectomy.40 RPEMs were used at low passage (4 to 8) in experiments assessing the PVR bioactivity of human vitreous. Primary human corneal fibroblasts (HCFs) and primary human umbilical vascular endothelial cells (HUVECs) were used at low passage (4 to 9) alongside ARPE-19α and RPEMs to compare and contrast mRNA expression of PDGFRα and VEGFRs among RPE cells, fibroblasts, and endothelial cells.
RCFs and HCFs were maintained in high glucose-containing Dulbecco's modified Eagle's medium (DMEM; Gibco BRL, Gaithersburg, MD) containing 10% fetal bovine serum. ARPE-19α and RPEM cells were maintained in a 1:1 mixture of high-glucose DMEM and Ham's F12 medium (Gibco BRL) containing 10% fetal bovine serum. HUVECs were maintained on collagen-coated plates in EGM-2 medium (Clonetics; Lonza, Walkersville, MD) containing 10% horse serum and 0.1% bovine brain extract (Lonza). All cells were cultured in media supplemented with 500 U/mL penicillin and 500 μg/mL streptomycin, and incubated at 37°C in a humidified 5% CO2 atmosphere.
For in vitro experiments involving Western blot analysis by SDS-PAGE and immunoblot, near-confluent cells were serum starved overnight (minimum, 16 hours) and treated the next morning. For treatments involving neutralizations and/or inhibitions, neutralizing agents/inhibitors were preincubated with their targets in solution at the targets’ ambient temperature for 30 minutes before addition to cells. Cell treatments were performed under the same conditions as cells cultured normally.
Quantification of Growth Factors and Cytokines in Experimental Vitreous
Vitreous isolated from experimental rabbits was analyzed by multiplex or quantitative immunoblot, as previously described.24 A panel of 26 growth factors/cytokines were chosen for analysis on the basis of their association with PVR.18,24,41 These were VEGF, PDGF-A, PDGF-AB, PDGF-B, PDGF-C, PDGF-D, CTGF, EGF, fibroblast growth factor (FGF)-2, granulocyte colony-stimulating factor (G-CSF), granulocyte-macrophage (GM)-CSF, HGF, interferon (IFN)-γ, IGF-1, IL-1β, IL-6, IL-8, IL-9, IL-10, monocyte chemoattractant protein (MCP)-1, transforming growth factor (TGF)-α, TGF-β1, TGF-β2, TGF-β3, tumor necrosis factor (TNF)-α, and TNF-β.
Quantitative Immunoblot
Quantitative immunoblot was performed, as previously described,24 to measure the vitreous levels of PDGF-C, PDGF-D, CTGF, HGF, and IGF-1 (for which the multiplex platform is not yet available/feasible). Briefly, vitreous was sufficiently diluted (1:50 to 1:200, so as not to hinder electrophoretic flow of proteins) and run on 8% to 12% SDS-PAGE gel alongside recombinant human growth factor/cytokine standards of known concentration. Proteins were transferred to polyvinylidene difluoride membranes and blotted with the appropriate detection antibodies (Table 1). Signal intensity was determined by densitometry using Quantity One (Bio-Rad, Hercules, CA) and growth factor/cytokine concentrations interpolated on the basis of a standard curve generated from the known concentrations of standards run on the same gel. In some cases, membranes were stripped and reprobed to quantify multiple growth factors and cytokines from a single gel. At minimum, experiments were performed in quadruplicate to ensure acceptable quantitative accuracy.
Multiplex Analysis
Multiplex analysis of the remaining 21 growth factors/cytokines was performed, as previously described,24 using two different immunoassay kits: one to quantify the three TGF-β isoforms (in their activated state) and the other customized to quantify the remaining 19; both kits were purchased from Millipore (Billerica, MA). Immunoassays were performed on the basis of the manufacturer's instructions for each kit, and as previously described.24 Briefly, each vitreous sample (50 μL) was added in triplicate to a 96-well plate and then incubated overnight with a mixture of monoclonal antibody–coated capture beads. Beads were washed and incubated with biotin-labeled anti-human polyclonal growth factor/cytokine antibodies for 1 hour, and then streptavidin-phycoerythrin was added for 30 minutes. Fluorescent emissions distinct to each growth factor/cytokine were simultaneously measured using the BioPlex Detection System, and the resulting data were analyzed using BioPlex software version 4.1 (Bio-Rad). Growth factor/cytokine concentrations were determined on the basis of standards run in parallel.
Vitreous from each eye was quantified separately and then compiled into groups (RV, n = 12; RV-PVR, n = 12; and RV-VTr, n = 8) for statistical analysis. The levels of PDGF-D, GM-CSF, IL-9, IL-10, TNF-α, TNF-β, and PDGF-D were lower than detection (<0.1 ng/mL), although this was not due to non–cross-reactivity with the rabbit growth factor/cytokine ortholog, as ruled out by confirming the detection of these rabbit proteins in degranulated rabbit blood or in primary rabbit cells (RCFs).
Western Immuoblot Analysis
After treatment and conditioning, cells were washed twice with ice-cold phosphate-buffered saline (PBS) and then lysed in sample buffer (50 mmol/L Tris-HCl, pH 6.8, 10% glycerol, 2% SDS, 1% β-mercaptoethanol, 10 mmol/L EDTA, and 0.02% bromophenol blue) for 15 minutes on ice. Total cell lysates (TCLs) were heated to 95°C for 5 minutes, clarified by centrifugation at 14,000 × g for 15 minutes at 4°C, and then run on 10% acrylamide SDS-PAGE gel. Electrophoretically resolved proteins were transferred to polyvinylidene difluoride membranes by semidry transfer, blocked, and blotted with the appropriate detection and loading control antibodies (Table 1). The enhanced chemiluminescent substrate used with horseradish peroxidase detection (via horseradish peroxidase α-IgG) (Table 1) was from Pierce Research (Rockford, IL). Each immunoblot area shown is representative of at least three independent experiments. Immunoblot signals were captured and analyzed by scanning densitometry in conjunction with Quantity One software version 4.6 (Bio-Rad). Experimental signal intensities were adjusted for background and loading (on the basis of signal intensity of the loading control), and then normalized to the negative control in the experiment (or otherwise the signal expected to be the lowest), which is arbitrarily assigned a value of 1. Where immunoblot signals were quantified, normalized values are given underneath them.
Cell Viability Assays
Determination of Cell Proliferation
ARPE-19α cells were seeded onto 12-well plates at 10,000 cells per well in the appropriate serum-supplemented culturing media and allowed to attach overnight. The next morning, media were replaced with serum-free DMEM, supplemented with either vehicle or the indicated treatments. Media plus supplements were replaced daily. At 96 hours (4 days), viable cells from each plate were counted with a hemocytometer. Experiments were performed independently three times.
Detection of Apoptotic or Senescent Cells
Cells (ARPE-19α or RPEMs) were seeded onto 24-well plates with coverslips at 5000 ARPE-19α or 10,000 RPEM cells per well in the appropriate serum-supplemented culturing media and allowed to attach overnight. The next morning, media were replaced with DMEM for 24 hours to induce cell cycle exit (quiescence) by serum deprivation. Wells were then replaced with fresh serum-free medium (DMEM) supplemented with vehicle or the indicated treatments. Media plus supplements were replaced every 24 hours for the next 72 hours. After a total of 96 hours (4 days), cells were washed with PBS to remove debris and dead cells, replaced with fresh serum-free DMEM, and immediately subjected to either of the following: terminal deoxynucleotidyl transferase-mediated dUTP nick-end labeling (TUNEL) analysis for detection of apoptotic cells—using the Promega apoptosis detection system (Promega, Fitchburg, WI), as previously described14—or cytochemical detection of senescence-associated (SA)–β-galactosidase activity (AppliChem, St. Louis, MO) for the detection of senescent cells, as previously described.42 The percentage of apoptotic cells, determined under the fluorescent microscope, was calculated as the number of TUNEL-positive nuclei cells/the total number of viable, DAPI-stained nuclei in the same field. In each experiment, a minimum of 10 randomly chosen fields, each at ×100 magnification, were analyzed. The percentage of senescent cells was determined as the number of blue staining cells (SA–β-galactosidase positive)/the total number of cells in the same field. In each experiment, a minimum of 12 randomly chosen fields, each at ×100 magnification, were analyzed.
Absolute Quantification of Receptors by RT-PCR
Standard curves for absolute RT-PCR quantification were generated as follows. T7 RNA polymerase (Life Technologies, Woburn, MA) was used to generate homogenous pools of complementary RNA (cRNA) transcripts from purified pGEM (3.0-kB) plasmids containing cDNA sequence inserts corresponding to human mRNA for PDGFRα (NM_006206), VEGFR2 (AF063658), or VEGFR1 (AF063657). The cRNA products were purified from in vitro transcription mixes using RNeasy Mini Kit (Qiagen, Valencia, CA) and quantified by UV absorbance at 260 nm. RNA concentrations were converted to copy number for each transcript using that transcript's molecular weight, and equal copy numbers for each transcript were diluted 1:100 with unrelated tRNA from baker's yeast (Sigma-Aldrich, St. Louis, MO) to mimic the heterogeneous background of experimental samples. Three separate cRNA dilution series were prepared in duplicate over five orders of magnitude (spanning 105- to 1010-fold dilutions), and then subjected to RT-PCR amplification, along with unknowns and controls (described below). For each standard, average CT values were determined from each dilution series and used to generate a standard curve, from which absolute copy number could be interpolated using CT values determined for each unknown.
Approximately 2.5 μg of total RNA was extracted from approximately 2 × 10⁵ cells for each cell type analyzed: ARPE-19α, RPEM, HCFs (primary HCFs), and HUVECs (primary HUVECs). RNA was extracted using TRIzol reagent (Invitrogen, Carlsbad, CA) and quantified by UV absorbance, as described above. The cDNA was generated using an iScript cDNA synthesis kit (Bio-Rad), according to the manufacturer's instructions. The resulting cDNA product (1 μL) was subjected to real-time PCR amplification alongside standards and controls using the SYBR Green system in conjunction with a 96-well plate Lightcycler (Roche, Branford, CT). Forward and reverse PCR primers corresponded to each receptor cDNA and each primer pair designed or chosen to generate amplicons of similar size to each other. PDGFRα mRNA primers (sense, 5′-TGGGAGGGTGGTCTGGATGAG-3′; antisense, 5′-GATGAAGGTGGAACTGCGGGAAC-3′), VEGFR2 mRNA primers (sense, 5′-CACCACTCAAACGCTGACATGTA-3′; antisense, 5′-GCTCGTTGGCGCACTCTT-3′), and VEGFR1 mRNA primers (sense, 5′-GTCACAGAAGAGGATGAAGGTGTC-3′; antisense, 5′-CACAGTCCGGCACGTAGGTGATT-3′) were used.
A negative no template control was run to exclude contamination of buffers, primers, and enzymes. Real-time PCR amplification was performed as follows: 50°C for 2 minutes once → 95°C for 10 minutes once; then 30 cycles of 95°C for 15 seconds → 60°C for 30 seconds (annealing temperatures of all primers were the same) → 72°C for 45 seconds; then 72°C for 10 minutes on the last cycle. A 30-cycle limit was established on the basis of amplification of nonsense products in the no template control. Dissociation curve analysis was performed, and real-time PCR data were analyzed with Applied Biosystems 7000 SDS software verison 1.4.1; no bimodel dissociation or abnormal amplification was observed. Transcript abundances interpolated from standard-curve CT values are expressed as absolute receptor mRNA copy number per 100 ng of total RNA (100 ng total RNA approximates 5000 to 10,000 cells).
Meta-Analysis of Patient Vitreous
Human PVR vitreous samples (n = 36) that had been previously profiled14,24 were recompiled into traumatic and non-traumatic categories and compared with experimental PVR vitreous profiles to identify a core set of growth factors/cytokines that putatively constitute PVR bioactivity in both rabbits and humans.
Collagen Gel Contraction Assay
As a surrogate model for ERM contraction during PVR, cell-mediated collagen gel contraction was assayed, as described previously.14,24 Briefly, RPEMs were starved and preconditioned for 24 hours with the indicated treatment before being harvested and suspended at 1 × 10⁶ cells/mL in a solution containing 1.5 mg/mL neutralized collagen I (INAMED, Fremont, CA) at pH 7.2 plus the same indicated treatment. Cell suspensions were then transferred at 0.1 mL/well into 24-well plates that had been preincubated with PBS and 5 μg/μL bovine serum albumin for a minimum of 4 hours. After polymerization of the collagen gel at 37°C after 60 to 90 minutes, 24 wells were overlaid with 0.5 mL serum-free DMEM supplemented with nothing or the indicated treatment (same as above). Media plus supplements were replaced every 24 hours for the next 72 hours. Collagen gel area was measured at 96 hours to determine percentage contraction, calculated as follows:
| (1) |
At 0 hour, the diameter of each gel equals the diameter of the well. Values are reported as the mean % contraction ± SD, obtained from at least three independent experiments (each performed in triplicate).
Statistical Analysis
Data were analyzed throughout this study using unpaired t-tests and one-way analysis of variance by Mann-Whitney analysis post hoc test using Sigmaplot 5 (Systat Software Inc., Chicago, IL). P < 0.05 was considered statistically significant.
Results
Aflibercept Safely and Effectively Prevents PVR in Two Experimental Models
In light of our previous preclinical studies validating ranibizumab as a prophylactic for experimental PVR,14 we considered if other approaches to neutralize VEGF were also effective. To this end, we focused on aflibercept in two models of PVR. Aflibercept is a VEGF trap that includes portions of the extracellular domain of both VEGFR1 and VEGFR2; it is, therefore, capable of neutralizing all VEGF (VEGF-A) isoforms, VEGF-related proteins (VEGFs B, C, and D), and placenta growth factor.43,44
Retinal pigment epithelial (RPE) cells abound in ERMs from patients with PVR, and injecting these cells into vitreous of rabbits induces PVR.30,45 We tested if aflibercept prevents PVR in rabbits that were injected with ARPE-19α cells, which is an RPE cell line engineered to overexpress PDGFRα; consequentially, ARPE-19α cells induce PVR more aggressively than parental ARPE cells.30
Injection of ARPE-19α cells induced RD (stage 3 or higher) in 12 (100%) of 12 animals (Figure 2A). In contrast to this IgG-injected control group, only 3 (27%) of 11 aflibercept-injected rabbits developed RD (Figure 2A). Supplemental Figure S1A includes the clinical status of rabbits over additional time points spanning the entire 7-week experimental time course. Fundus images from a single IgG-injected rabbit typify the progression to complete RD observed in this model (Figure 2B). These results indicate that aflibercept prevented RD in most rabbits.
Figure 2.

Aflibercept safely and effectively prevents experimental proliferative vitreoretinopathy (PVR) in the retinal pigment epithelial (RPE)-injection model. A: Aflibercept treatment prevents PVR in rabbits injected with ARPE-19α cells. PVR was induced by intravitreal injection of ARPE-19α cells in platelet rich plasma (PRP), immediately followed by injection of aflibercept into 12 rabbits (pentagons) or the same molar amount of normal rabbit IgG into another 12 rabbits (triangles). Rabbits received an additional injection of aflibercept or IgG at day 21. Eyes were examined and scored for development of PVR at multiple time points using an indirect ophthalmoscope and fundus lens (days 1 and 49 shown here) (Supplemental Figure S1A shows additional time points). PVR was graded using the Fastenberg 5-stage scale.34 One rabbit in the aflibercept group developed a cataract on day 21 and was excluded from the remainder of the experiment. B: Fundus photographs of an IgG-injected rabbit eye over progressively worsening stages of PVR (stages 2, 4, and 5 PVR images, taken on days 14, 21, and 28, respectively). C: Aflibercept treatment preserves retinal function. Scotopic (dark-adapted) flash electroretinograms (ERGs) of three IgG-injected rabbits (PVR stage 5) and three aflibercept-injected rabbits (PVR stage 0) were taken on day 47; a representative ERG is shown from each group. Aflibercept-treated rabbit eyes elicit the same ERG response as their noninjected contralateral eyes, whereas control (IgG) injected eyes show no ERG response. Additional photopic (light-adapted) ERG responses are shown in Supplemental Figure S1B. D: Aflibercept treatment preserves retinal morphological characteristics. The same eyes used for ERG in B were fixed, divided into sections, and stained with H&E. Both noninjected and aflibercept-injected eyes show intact neural retinas and RPEs with no sign of morphological disruption. IgG-treated eyes (PVR stage 5) have convoluted retinas that are completely detached. The top half of the IgG-injected panel shows a region of adjacent epiretinal membrane (ERM), containing both pigmented cells (RPE derived) and nonpigmented cells; asterisk indicates the site in the middle panel where the ERM is contiguous with the detached retina. The complete image for the IgG-treated section is shown in Supplemental Figure S1C. ∗P < 0.01 between VEGF-Tr and IgG/mock-treated groups (Mann-Whitney analysis, A). a, a-wave component; b, b-wave component; GCL, ganglion cell layer; INL, inner nuclear layer; IPL, inner plexiform layer; IS, inner segment of the PRL; ONL, outer nuclear layer; OPL, outer plexiform layer; OS, outer segment of the PRL; PRL, photoreceptor layer; Vit, vitreous side of the retina.
We examined the ability of aflibercept to preserve retinal function in this animal model of PVR. The scotopic flash ERGs in Figure 2C (representative of three independently measured rabbits for each group) show that PVR abolished retinal function, whereas aflibercept prevented this outcome. Furthermore, comparison of the scotopic flash ERG data from noninjected and aflibercept-injected eyes demonstrates that aflibercept itself did not compromise the functional integrity of the retina (Figure 2C). These same conclusions emerged from consideration of additional modes of ERG response (Supplemental Figure S1B). Thus, aflibercept safely and effectively prevented the PVR-associated loss in retinal function, likely because it prevented RD (Figure 2A), which triggers TP53-associated death of neural retinal cells due, in part, to loss of metabolic and nutritional support from the underlying RPE layer.46–49
Next, we examined the ability of aflibercept to preserve retinal structure in our present experimental model. Both an RPE-rich ERM and a highly disordered neural retina were prominent features of eyes that developed PVR (Figure 2D and Supplemental Figure S1C). In contrast, the layers of neural retinal cells in aflibercept-injected eyes were overtly normal (Figure 2D). These results suggest that aflibercept prevents PVR after RPE injection and thereby preserved retinal function and morphological features in most of the rabbits that received this treatment.
We repeated the experiments using a second model of PVR in which RCFs were injected instead of ARPE-19α cells with similar results. Aflibercept prevented RD in 11 (100%) of 11 animals (Figure 3A and Supplemental Figure S2A), halted the associated abrogation of retinal function (Figure 3B and Supplemental Figure S2B), and deterred the development of an ERM and the concomitant morphological disorganization of the retina (Figure 3C and Supplemental Figure S2C). Although PVR was induced by injection of nonpigmented fibroblasts, the ERM contained an abundance of pigmented cells (Figure 3C and Supplemental Figure S2C). Such an observation suggests that resident pigmented cells (eg, RPE) contribute to the formation of an ERM, even though they were not among the cells that instigated disease.
Figure 3.

Aflibercept safely and effectively prevents experimental proliferative vitreoretinopathy (PVR) in the fibroblast-injection model. A: A single injection of aflibercept prevents PVR in rabbits injected with rabbit conjunctival fibroblasts (RCFs). PVR was induced by intravitreal injection of RCFs, immediately followed by injection of aflibercept (pentagons) or the same molar amount of normal rabbit IgG (triangle; simultaneously with the induction of PVR on day 0). Only 9 of 11 rabbits were analyzed in the IgG control group because of complications unrelated to the experiment. Rabbit eyes were examined postinjection and graded for PVR using the Fastenberg 5-stage scale at days 1 and 28 (Supplemental Figure S2A). B: Aflibercept treatment preserves retinal function. Scotopic (dark-adapted) flash ERGs of IgG-injected rabbits (PVR stage 4) and aflibercept-injected rabbits (PVR stage 0) were taken on day 26; a representative ERG is shown from each group. Data shown are representative of all rabbits in each treatment group measured (n = 3). Photopic ERG responses are shown in Supplemental Figure S2B. C: Aflibercept treatment preserves retinal morphological characteristics. The same eyes for ERG in B were fixed, divided into sections, and stained with H&E. Images of both noninjected and aflibercept-injected eyes show intact neural retinas with some associated RPE and no sign of morphological disruption. IgG-treated eyes have detached, convoluted retinas. The top half of the IgG-injected panel shows a region of adjacent ERM, containing nonpigmented and pigmented cells. ∗P < 0.01 between VEGF-Tr and IgG/mock-treated groups at day 28 (Mann-Whitney analysis, A). a, a-wave component; b, b-wave component; GCL, ganglion cell layer; INL, inner nuclear layer; IPL, inner plexiform layer; IS, inner segment of the PRL; ONL, outer nuclear layer; OPL, outer plexiform layer; OS, outer segment of the PRL; PRL, photoreceptor layer; Vit, vitreous side of the retina.
Taken together, the results from Figures 2 and 3 demonstrate that aflibercept suppresses PVR in two models of disease without adversely affecting retinal function or structure.
Aflibercept Reduces the Ability of Vitreous to Promote Viability of Cells
Components of the vitreous drive several cellular responses related to PVR, and these abilities are associated with a decline in the level of TP53.11,12,14,24 These observations predict that vitreous from aflibercept-injected animals would be less capable of reducing TP53 and promoting PVR-associated cellular responses compared with vitreous from IgG-injected animals, thus leading to elevated TP53-associated fates, including cell cycle arrest, apoptosis, and senescence.13,50 Indeed, we observed that RV-PVR (vitreous from IgG-injected rabbits) more efficiently suppressed TP53 and protected ARPE-19α cells from apoptosis and senescence than RV-VTr (vitreous from aflibercept-injected rabbits) (Figure 4, A–C). In contrast, there was no significant difference in the ability of RV-PVR and RV-VTr to stimulate cell proliferation (Figure 4D). These findings indicate that aflibercept reduced the ability of vitreous to protect cells from apoptosis and senescence, and that this phenomenon was associated with its reduced ability to depress the level of TP53.
Figure 4.

Vascular endothelial growth factor (VEGF)-Tr attenuates vitreous-driven cell viability associated with TP53. A: The ability of PVR vitreous to drive TP53 reduction in ARPE-19α cells depends on endogenous VEGF. ARPE-19α cells were serum starved and either left untreated (----) or treated for 2 hours with the indicated type of vitreous. After treatment, cells were lysed and the resulting total cell lysates were subjected to Western blot analysis using the indicated antibodies. The signal intensity of the resulting immunoblots was quantified by densitometry, and ratios representing band intensities normalized to non-stimulated cells are shown under the immunoblot. The data presented are representative of three independent experiments. B: The ability of PVR vitreous to protect from starvation-induced apoptosis in retinal pigment epithelial cells depends on endogenous VEGF. ARPE-19α cells were serum starved for 24 hours to induce quiescence, and then incubated an additional 72 hours in the same starvation medium supplemented with nothing (----) or the indicated vitreous. Media plus supplements were replaced daily. After a total of 96 hours, cells were washed and subjected to apoptosis detection assay by TUNEL. The data shown represent the means ± SD of three independent experiments. In each experiment, a minimum of 10 randomly chosen fields, each at ×100 magnification, were analyzed. C: PVR vitreous-driven protection from starvation-induced senescence in ARPE-19α cells depends on endogenous VEGF. ARPE-19α cells were starved and treated as in B. Senescent cells were quantified using phase-contrast microscopy. The percentage of senescent cells was determined as the number of SA–β-galactosidase–positive cells/the total number of viable cells in the same field. In each experiment, a minimum of 12 randomly chosen fields (each at ×100 magnification) were analyzed. D: The ability of PVR vitreous to drive proliferation of ARPE-19α cells occurs independent of VEGF. ARPE-19α cells were starved and treated as in B. The graph compiles data from three independent experiments, where each bar is the mean ± SD increase in cell number normalized to the number of cells initially seeded. Cell growth differs significantly between starved cells and those supplemented with vitreous, although no significant differences occur between any of the vitreous-supplemented cells. The data shown in B–D represent the means ± SD from three independent experiments. Data were compared using a paired t-test. ∗P < 0.05. RV, healthy vitreous isolated from noninjected eyes; RV-PVR, vitreous isolated from IgG-injected eyes with PVR stage 5; and RV-VTr, vitreous isolated from VEGF-Tr/aflibercept-injected eyes with PVR stages 0 to 1.
The Relationship between VEGF, PDGFs, and Non-PDGFs Determines the Bioactivity of RV-PVR
We first considered a straightforward explanation for why aflibercept eliminated the bioactivity of vitreous from ARPE-19α–injected rabbits (namely, because it globally reduced the level of non-PDGFs, many of which are required for PVR).24 Figure 5 shows the profile of growth factors and cytokines in vitreous from IgG- and aflibercept-injected rabbits (RV-PVR and RV-VTr, respectively). Although VEGF was not the only growth factor that was lower in RV-VTr versus RV-PVR vitreous, it was clear that aflibercept had not globally suppressed the level of growth factors and cytokines. Furthermore, the growth factors and cytokines in RV-VTr should be enough to constitute the bioactivity of vitreous, because their levels were higher than many growth factors and cytokines in the vitreous from healthy rabbits (RV) (Figure 5), and RV is fully capable of reducing TP53 and promoting viability (Figure 4). Consequently, these profiling data do not support the explanation that aflibercept reduced the bioactivity of vitreous by causing a universal reduction in the level of growth factors and cytokines in vitreous.
Figure 5.

Neutralizing vascular endothelial growth factor (VEGF) does not globally diminish growth factor levels in experimental proliferative vitreoretinopathy (PVR) vitreous. Vitreous isolated from retinal pigment epithelial (RPE)-injected rabbits was analyzed by multiplex or quantitative Western blot analysis to quantify 26 growth factors or cytokines associated with PVR.18,24,41 The following growth factors and cytokines were lower than detection (<0.1 ng/mL) and, thus, omitted from the bar graph: platelet-derived growth factor-D (PDGF-D), granulocyte macrophage colony-stimulating factor (GM-CSF), IL-9, IL-10, TNF-α, and TNF-β. Only the active forms of the three TGF-β isoforms were quantified. PDGF-C, PDGF-D, hepatocyte growth factor (HGF), insulin-like growth factor (IGF)-1, and connective tissue growth factor (CTGF) were quantified by using Western blot analysis, whereas all other factors were quantified by multiplex analysis. The anti-CTGF antibody recognizes both N- and C-terminal CTGF fragments. The bars represent the means, whereas error bars indicate SDs. The growth factor and cytokine profile for the fibroblast-injection model of PVR has been published elsewhere.24 Paired t-tests were used to compare RV with RV-PVR. ∗P < 0.05, RV-PVR to RV-VTr; †P < 0.05. RV, healthy vitreous isolated from noninjected eyes; RV-PVR, vitreous isolated from IgG-injected eyes with PVR stage 5; and RV-VTr, vitreous isolated from VEGF-Tr/aflibercept-injected eyes with PVR stages 0 to 1, were profiled.
Our previous findings, summarized in Figure 1, offer an alternative explanation; eliminating VEGF with aflibercept unleashed the antagonistic action of PDGF on non–PDGF-mediated indirect activation of PDGFRα, which drives signaling events and cellular responses associated with PVR.12,24 Neutralizing either non-PDGFs or VEGF significantly eliminated the ability of RV-PVR to suppress TP53 and protect ARPE-19α cells from apoptosis and senescence (Figure 6, A–C). Furthermore, neutralizing PDGFs had no impact on the bioactivity of RV-PVR (Figure 6, A–C), even though they were present at a concentration sufficient to drive signaling events and cellular responses (>20 ng/mL) (Figure 5). Similar results were seen from experiments in which purified growth factors were used instead of vitreous (Figure 6, A–C), indicating that all of the relevant contributors have been identified. The selection of growth factors and cytokines to include in these studies, as well as their concentrations, was on the basis of vitreous profiling data from two different animal models and patient donors (Table 2).
Figure 6.

Non–platelet-derived growth factors (non-PDGFs) and vascular endothelial growth factor (VEGF) are necessary for the bioactivity of proliferative vitreoretinopathy (PVR) vitreous–induced TP53 reduction in ARPE-19α cells. A: Cells were starved and then either left untreated (----) or treated for 2 hours as indicated in the presence of RV-PVR or GFs-PVR (comprising 16 recombinant human growth factors corresponding to the core set identified in Table 2). Treatments included 10 μg/mL of nonimmune IgG (IgG), a mixture of neutralizing antibodies directed against the 13 non-PDGFs included in GFs-PVR (α-nonPs), an equimolar mixture of neutralizing antibodies against all PDGF agonists of PDGFRα (α-PDGFs), or 250 μg/μL of aflibercept/VEGF-Trap (VEGF-Tr). After treatment, cells were lysed and the resulting total cell lysates (TCLs) were subjected to Western blot analysis using the indicated antibodies. The signal intensity of the resulting immunoblots was quantified by densitometry, and ratios representing band intensities normalized to non-stimulated cells are shown under the immunoblot. B: Non-PDGFs and VEGF were necessary for PVR vitreous–induced protection from apoptosis in ARPE-19α cells. Cells were starved 24 hours and then administered the same treatments as in A, except treatment was maintained for 72 hours instead of 2 hours; starvation media plus supplements were replaced daily. At 96 hours, cells were subjected to TUNEL analysis. The data shown represent the means ± SD of three independent experiments. Data were compared using a paired t-test. C: Non-PDGFs and VEGF are necessary for PVR vitreous–induced protection from senescence in ARPE-19α cells. Cells were starved and treated as in B. At 96 hours, the percentage of senescent cells was determined. The data shown represent the means ± SD from three independent experiments, and were statistically compared as in B. VEGF promotes vitreous-induced reduction of TP53 by counteracting vitreal PDGFs. ARPE-19α cells were starved and then either left untreated (----) or treated for 2 hours as indicated in the presence of RV-PVR or RV-VTr. Treatments included 10 μg/mL of nonimmune IgG (IgG), 250 μg/uL of aflibercept/VEGF-Trap (VEGF-Tr), an equimolar mixture of neutralizing antibodies against all PDGF agonists of PDGFRα (α-PDGFs), a combination of VEGF-Tr and α-PDGFs (same concentrations used individually), a supersaturating dose of 500 ng/mL PDGF-A (+PDGF-A), or 20 ng/mL of VEGF (VEGF-A). After treatment, treated cells were lysed and the resulting TCLs subjected to Western blot analysis using the indicated antibodies. The signal intensity of the resulting immunoblots was quantified by densitometry, and ratios representing band intensities normalized to non-stimulated cells are shown under the immunoblot. ∗P < 0.05. RV, healthy vitreous isolated from noninjected eyes; RV-VTr, vitreous isolated from VEGF-Tr/aflibercept-injected eyes with PVR stages 0 to 1.
Table 2.
PVR-Associated Growth Factors and Cytokines in Vitreous
| Growth factor/cytokine∗ | Rabbits† |
Humans† |
||
|---|---|---|---|---|
| Fibroblast-injection (n = 24) | RPE-injected (n = 12) | Non-traumatic (n = 21) | Traumatic (n = 15) | |
| VEGF | + + | + + | + | + + |
| PDGF-A | + + | + | + | + |
| PDGF-AB | + + | + | − | + |
| PDGF-B | + | + | − | − |
| PDGF-C | + + + | + + + | + + + | + + + |
| CTGF | + + + | + + + | + + | + |
| EGF | + | + | − | + |
| FGF-2 | + + | + + | + | + |
| G-CSF | − | + | − | + |
| HGF | + + | + | + + | + |
| IFN-γ | + + | + + | − | + + |
| IGF-1 | + + | + + | + | + |
| IL-6 | − | + | + + | + |
| MCP-1 | − | + | + + | + + |
| TGF-α | + | + | + | + + |
| TGF-β1 | + | + + | − | + |
| TGF-β2 | + + | + + | + | + |
| TGF-β3 | + | + | − | + |
Profiling data from two models of experimental PVR—the RPE-injection model (Figure 5) and the fibroblast-injection model24—together with clinical profiles from the vitreous of PVR patients,24 which is subdivided into traumatic and non-traumatic categories. All growth factors and cytokines listed are present in at least one type of vitreous from each species, and identify a core set of factors that putatively constitute PVR bioactivity in both experimental and clinical vitreous.
+, 0.1 to 2.5 ng/mL; ++, 2.5 to 10 ng/mL; +++, >10 ng/mL; −, <0.1 ng/mL (considered lower than detection).
The following three groups of growth factors and cytokines were omitted from this table: i) PDGF-D, GM-CSF, IL-9, and IL-10, each of which were lower than detection in all four types of vitreous (this was not due to a failure to detect the rabbit and/or human orthologs, as all four agents were detectable when tested in cells and/or serum from either species, data not shown); ii) IL-1β and IL-8, which were present (within the 0.1 to 2.5 ng/mL range) only in rabbit vitreous; and iii) TNF-α and TNF-β, which were present (within the 0.1 to 2.5 ng/mL range) only in traumatic human PVR vitreous. PDGF-B was detectable only in rabbit vitreous, although it was included as part of the core set because the presence of PDGF-AB in human vitreous suggests that some PDGF-B might exist; by including PDGF-B as part of the core set, we are able to ensure that all direct agonists of PDGFRα in vitreous are accounted for.
The + and − symbols indicate the concentration range at which growth factors and cytokines were present in each type of vitreous.
If the reason that aflibercept reduced the bioactivity of vitreous was because it derepressed PDGFs, then neutralizing PDGFs should overcome the effect of aflibercept. Indeed, the aflibercept-mediated change in the level of TP53 was substantially reduced when PDGFs were neutralized (Figure 6D). The same type of result was observed when PDGFs were neutralized in vitreous from rabbits that had been injected with aflibercept (RV-VTr) (Figure 6D). Finally, because the relationships shown in Figure 1 are competitive, increasing the concentration of PDGF should lower the bioactivity of vitreous. The ability of RV-PVR to reduce TP53 was suppressed by elevating PDGF-A (Figure 6D). We conclude that the bioactivity of vitreous from rabbits that developed PVR after injection of ARPE-19α cells is governed by the functional relationship among three classes of growth factors (Figure 1).
VEGF-Dependent Activation of VEGFRs Contributes Minimally to the Bioactivity of PVR Vitreous
Because VEGF promotes viability of VEGFR-expressing cells,51,52 which include ARPE-19α (Figure 7A), VEGF-mediated promotion of indirect PDGFRα activation by non-PDGFs (Figure 1) may not be the only way that VEGF contributes to the bioactivity of RV-PVR. It may also participate by the canonical route, which involves activation of VEGFRs. To investigate this issue, we stimulated ARPE-19α cells with purified VEGF and measured PVR-associated signaling events and cellular responses. VEGF was unable to suppress the level of TP53 or prevent senescence (Figure 7, B and D), although it protected cells from apoptosis (Figure 7C). Thus, VEGF was sufficient for certain outcomes, albeit with reduced efficiency, even when used at an approximately threefold higher dose than what was present in RV-PVR (Figure 5). To test the relative contribution of VEGF-dependent activation of VEGFRs to the overall bioactivity of RV-PVR, we assayed the effect of pharmacologically blocking VEGFRs on RV-PVR–triggered responses. There was no impact on suppression of TP53 (Figure 7B), and a modest and statistically significant decline in RV-PVR–mediated protection from apoptosis and senescence (Figure 7, C and D). Thus, the VEGFR-associated canonical action of VEGF makes a minor contribution to the bioactivity of RV-PVR. Put another way, most of VEGF's contribution to the bioactivity of vitreous appears to be via PDGFRα instead of VEGFR (Figure 1).
Figure 7.

Vascular endothelial growth factor (VEGF)-dependent activation of VEGF receptors (VEGFRs) contributes minimally to the bioactivity of proliferative vitreoretinopathy (PVR) vitreous. A: RT-PCR quantification of VEGFR2, VEGFR1, and platelet-derived growth factor alpha (PDGFRα) expression in human ARPE-19α cells, primary human corneal fibroblasts (HCFs), and primary human umbilical vascular endothelial cells (HUVECs). Resulting data show absolute mRNA copy number per 100 ng of total RNA, and were determined on the basis of comparison to standard curves using purified plasmids for each receptor type. ARPE-19α expresses both VEGFRs and PDGFRαs (the latter is overexpressed), whereas HCFs and HUVECs express only PDGFRα or VEGFRs, respectively. B: The kinase activity of VEGFRs expressed on ARPE-19α cells does not contribute to vitreous-induced reduction of TP53. Cells were starved and treated in parallel for 10 minutes (to assess VEGFR activation) or 2 hours (to assess TP53 reduction) with no treatment (----), 20 ng/mL VEGF, or RV-PVR in either the absence (--) or presence (+) of yrosine kinase inhibitor (VR-inh), which was added 30 minutes before treatment and used at a concentration of 360 nmol/L, sufficient to neutralize both VEGFR isoforms.28 After treatment, cells were lysed and subjected to Western blot analysis using the indicated antibodies. The signal intensity of the resulting immunoblots was quantified by densitometry, and ratios representing band intensities normalized to non-stimulated cells are shown under the immunoblot. C: Vitreous VEGF protects from apoptosis through its canonical ability to activate VEGFRs and its noncanonical ability to promote indirect activation of PDGFRα. ARPE-19α cells were starved and treated as in B, except treatment was maintained for 72 hours instead of 2 hours, with starvation media plus supplements replaced daily, including VR-Inh. At 96 hours, cells were subjected to TUNEL analysis. The data shown represent the means ± SD of three independent experiments. Data were compared using a paired t-test. D: Vitreous VEGF protects from senescence primarily by its noncanonical ability to promote indirect activation of PDGFRα. ARPE-19α cells were starved 24 hours and then treated as in C. The percentage of senescent cells was determined at 96 hours. The data shown represent the means ± SD from three independent experiments, and were statistically compared as in C. ∗P < 0.05. DMSO, dimethyl sulfoxide.
Aflibercept Neutralizes the Bioactivity of Vitreous from Patients with PVR
We previously reported that three classes of growth factors are present in vitreous from patients with PVR, they functionally interact as shown in Figure 1, and these relationships determine the bioactivity of such vitreous.14,24 More important, ranibizumab substantially reduced the ability of patient PVR vitreous to drive signaling events and cellular responses associated with PVR in cells derived from a donor PVR membrane (RPEM cells).14 In light of the translational focus of our present study, similar types of experiments were performed with aflibercept (VEGF-Tr) using vitreous from patients with traumatic PVR (HV-PVR), which contains relatively high and nearly equimolar levels of VEGF and PDGFs (Table 2),14 and, thus, is strongly relevant to the paradigm in Figure 1. Neutralization of non-PDGFs (the same 12 targeted in RV-PVR) or VEGF (aflibercept) in HV-PVR attenuated its ability to reduce TP53 (Figure 8A) or promote viability of RPEM cells (ie, protect against apoptosis and senescence) (Figure 8, B and C). Eliminating non-PDGFs, and to a lesser extent VEGF, from vitreous caused a modest, yet significant, decline in HV-PVR–induced contraction of RPEM-embedded collagen gels (Figure 8D). These cells, unlike ARPE-19α, are derived from a patient PVR membrane (RPEMs) and are capable of contracting a collagen matrix, which is considered a surrogate measure of RD.22,24 As in experimental PVR vitreous, PDGF behaved as an antagonist of HV-PVR bioactivity; aflibercept was overcome by neutralizing PDGFs, and boosting the level of PDGF-A attenuated the bioactivity of HV-PVR (Figure 8, A–D). Taken together, these results indicate that both VEGF and non-PDGFs—comprising the 12 present in GFs-PVR (Table 2)—are each essential for the bioactivity of vitreous from patients with severe PVR.
Figure 8.

Vascular endothelial growth factor (VEGF) and non–platelet-derived growth factors (non-PDGFs) enhance, whereas PDGFs antagonize, the bioactivity of vitreous from patients with proliferative vitreoretinopathy (PVR) after severe trauma. A: Non-PDGFs and VEGF are necessary for vitreous from patients with PVR after severe trauma (HV-PVR) to reduce TP53 in retinal pigment epithelial (RPE) cells isolated from a human PVR membrane (RPEM cells). RPEMs were starved and then either left untreated (----) or treated for 2 hours as indicated in the presence of HV-PVR—an equal volume mix of 10 vitreous samples from patients with post-traumatic grade C PVR. Treatments included 10 μg/mL of nonimmune IgG (IgG), a mixture of neutralizing antibodies directed against the 13 non-PDGFs included in GFs-PVR as listed in Table 2 (α-nonPs), an equimolar mixture of neutralizing antibodies against all PDGF agonists of PDGFRα (α-PDGFs), 250 μg/μL of aflibercept/VEGF-Trap (VEGF-Tr), a combination of VEGF-Tr + α-PDGFs (same concentrations used individually), and a supersaturating dose of 500 ng/mL PDGF-A (+PDGF-A). After treatment, cells were lysed and the resulting total cell lysates were subjected to Western blot analysis using the indicated antibodies. The signal intensity of the resulting immunoblots was quantified by densitometry, and ratios representing band intensities normalized to non-stimulated cells are shown under the immunoblot. B: Non-PDGFs and VEGF were necessary for HV-PVR's ability to protect RPEMs from starvation-induced apoptosis. RPEMs were starved 24 hours and then administered the same treatments as in A except treatment was maintained for 72 hours instead of 2 hours, with starvation media plus supplements replaced daily. At 96 hours, cells were subjected to TUNEL analysis. The data shown represent the means ± SD of three independent experiments. Data were compared using a paired t-test. Endogenous PDGF contributes a small amount to HV-PVR–driven contraction; elevating the concentration of PDGFs in HV-PVR can also drive contraction. Both these results are expected because PDGF itself can drive contraction,53,54 which is much more apparent at earlier time points (<4 days, data not shown). C: Non-PDGFs and VEGF are necessary for HV-PVR’s ability to protect RPEMs from starvation-induced senescence. RPEMs were starved 24 hours and then administered the same treatments as in A except treatment was maintained for 72 hours instead of 2 hours, with starvation media plus supplements replaced daily. The percentage of senescent cells was determined at 96 hours. The data shown represent the means ± SD from three independent experiments, and were statistically compared as in B. D: Non-PDGFs and VEGF were necessary for RPEM-mediated collagen gel contraction driven by HV-PVR. RPEMs were starved, preconditioned for 24 hours with the same treatments in A, and then suspended in a collagen gel and treated an additional 72 hours, with starvation media plus supplements replaced daily. Gel area was measured at 96 hours to determine the percentage collagen contraction. Each bar represents a mean ± SD percentage contraction obtained from three independent experiments, and was statistically compared as in B. ∗P < 0.05.
VEGF Contributes to the Bioactivity of Patient Vitreous Independent of VEGFR Activity
Our results revealed that although the major determinant of VEGF's contribution to the bioactivity of vitreous involved antagonism of PDGFs, it can also serve this role canonically by activating VEGFRs. Because RPEM cells have VEGFRs (Figure 9A), in agreement with other RPE cell lines (Figure 7A),28 we considered to what extent VEGF-mediated VEGFR signaling contributed to biological outcomes in these cells. Purified VEGF was unable to reduce the level of TP53 or prevent senescence (Figure 9, B and C), although it protected RPEM cells from apoptosis (Figure 9D), and triggered a small, yet significant, level of collagen gel contraction (Figure 9E). We also tested the importance of VEGFR activity for the bioactivity of HV-PVR on RPEM cells. Pharmacologically blocking VEGFRs had no impact on the level of TP53, contraction, or viability in response to HV-PVR (Figure 9, B and E). These studies indicate that the canonical VEGF/VEGFR axis is dispensable for bioactivity of HV-PVR. Together with the data shown in Figure 8, we conclude that VEGF governs the bioactivity of vitreous from patients with traumatic PVR by antagonizing PDGFs, thereby enabling indirect activation of PDGFRα by non-PDGFs (Figure 1).
Figure 9.

Vascular endothelial growth factor (VEGF)-dependent activation of VEGF receptors (VEGFRs) is dispensable for the bioactivity of vitreous from patients with proliferative vitreoretinopathy (PVR) after severe trauma. RT-PCR quantification of VEGFR2, VEGFR1, and PDGFRα expression in human cells. Expression in RPEMs, primary human corneal fibroblasts (HCFs), and primary human umbilical vascular endothelial cells (HUVECs). A: Resulting data show absolute mRNA copy number per 100 ng of total RNA, and were determined on the basis of comparison to standard curves using purified plasmids for each receptor type. RPEMs express both VEGFRs and PDGFRαs, similar to ARPE-19α (Figure 7A), with the notable exception that PDGFRα is not overexpressed. HCFs and HUVECs express only PDGFRα and VEGFRs, respectively. B: The kinase activity of VEGFRs expressed on RPEMs does not contribute to vitreous-induced reduction of TP53. Cells were starved and treated in parallel for 10 minutes (to assess VEGFR activation) or 2 hours (to assess TP53 reduction) with no treatment (----), 20 ng/mL VEGF, or HV-PVR in either the absence (--) or presence (+) of a VEGFR tyrosine kinase inhibitor (VR-inh), which was added 30 minutes before treatment and used at a concentration of 360 nmol/L, sufficient to neutralize both VEGFR isoforms.28 After treatment, cells were lysed and subjected to Western blot analysis using the indicated antibodies. The signal intensity of the resulting immunoblots was quantified by densitometry, and ratios representing band intensities normalized to non-stimulated cells are shown under the immunoblot. Neither VEGFR1 nor VEGFR2 kinases are required for HV-PVR–driven TP53 reduction. C: VEGF-dependent activation of VEGFRs is dispensable for HV-PVR's ability to protect RPEMs from starvation-induced senescence. RPEMs were starved and preconditioned for 24 hours with the same treatments in B, except treatment was maintained for 72 hours instead of 2 hours, with starvation media plus supplements replaced daily. The percentage of senescent cells was determined at 96 hours. The data shown represent the means ± SD from three independent experiments. Data were compared using a paired t-test. D: VEGF-dependent activation of VEGFRs is dispensable for HV-PVR's ability to protect RPEMs from starvation-induced apoptosis. RPEMs were starved 24 hours and then administered the same treatments as in B, except treatment was maintained for 72 hours and media plus any supplements were replaced daily. At 96 hours, cells were subjected to TUNEL analysis. The data shown represent the means ± SD of three independent experiments and were statistically compared as in C. E: VEGF-dependent activation of VEGFRs is dispensable for HV-PVR’s ability to drive collagen gel contraction containing RPEMs. RPEMs were starved, preconditioned for 24 hours with the same treatments in B, and then suspended in a collagen gel, after which cells were administered treatment an additional 72 hours, with starvation media plus supplements replaced daily. Gel area was measured at 96 hours to determine percentage collagen contraction. Each bar represents a mean ± SD percentage contraction obtained from three independent experiments and was statistically compared as in C. ∗P < 0.05. DMSO, dimethyl sulfoxide.
Discussion
We found that neutralizing VEGF with aflibercept protected rabbits from PVR in two models of disease (Figures 2 and 3) and eliminated PVR bioactivity in both experimental and clinical vitreous. Furthermore, our data show that VEGF primarily contributes to PVR bioactivity through its noncanonical function as an enabler of indirect PDGFRα activation, despite the existence of two routes (via VEGFRs or PDGFRα) through which VEGF can promote PVR-associated events in RPE cells.
Recent publications strongly implicate the TP53 pathway in the pathogenesis of PVR in our model of PVR and in patients.11,15,16 Rabbit vitreous-mediated suppression of TP53 is required for four cellular responses associated with PVR (protection from apoptosis and senescence, proliferation, and contraction). Furthermore, preventing the decline in TP53 protects rabbits from succumbing to PVR.11 However, merely reducing TP53 does not trigger proliferation or contraction, which indicates that additional vitreous-driven events are required for these cellular responses.11 Finally, patients with single-nucleotide polymorphisms that compromise the TP53 pathway have an increased probability of developing PVR.15,16
Which of the VEGF-neutralizing agents—aflibercept or ranibizumab—is the better candidate for protecting patients from PVR? Direct comparison using the same animal model (Figure 3)14 revealed comparable efficacy in preventing RD (100% for aflibercept and 91% for ranibizumab). Furthermore, neither treatment induced deleterious effects on retinal function and structure within the study period (Figure 3 and Supplemental Figure S2).14 Both agents also eliminated bioactivity in human PVR vitreous by derepressing vitreal PDGFs, which is the same mechanism that governs the bioactivity of rabbit PVR vitreous (Figures 6 and 8).14 We conclude that the efficacy and safety of aflibercept and ranibizumab are comparable, and hence both are suitable candidates for preventing clinical PVR.
Although the focus of this project is on the neutralization of VEGF, it is possible that the VEGF-related proteins (ie, VEGFs C, D, and E), also targeted by aflibercept and ranibizumab, somehow contribute to PVR bioactivity. Although numerous groups have reported that VEGF is present in PVR vitreous,24,41,55 there are no reports regarding VEGFs C, D, and E. Of the three, VEGF-E is the most likely to be present in vitreous because its distribution is reportedly ubiquitous.56 However, VEGF-E is heat stable,57 whereas agents that antagonize PDGF in vitreous are heat labile.28 Additional experimentation is necessary to directly address if VEGFs C, D, and E are present in PVR vitreous, and if they contribute to its bioactivity.
When we investigated the growth factor profile of vitreous treated with aflibercept (RV-VTr), we were somewhat surprised to find that growth factors other than VEGF had changed (Figure 5). The decrease in the level of PDGF-A may result from clearance of PDGF via PDGF-PDGFR complexes, which would be more prevalent after neutralization of VEGF (Figure 1). Such an explanation seems irrelevant for the decline in HGF, CTGF, IL-6, and IL-8, or the increase in FGF-2. Perhaps the cells responsible for producing HGF, CTGF, IL-6, and IL-8 perish as a consequence of aflibercept-mediated loss of cell viability. The similar level of these growth factors in both post-treatment vitreous (RV-VTr) and healthy vitreous (RV) supports this explanation (Figure 5). The exception to this is FGF-2, whose level in healthy vitreous is the same as in PVR vitreous, and this points toward an alternate and as of yet unknown mechanism. VEGF acts noncanonically via PDGFRα to promote viability of cells. The requirements for this mechanism include PDGFRα-expressing cells, PDGFs, and non-PDGFs (Figure 1). In the case of PVR, VEGF is presumed to promote the viability of cells displaced into the vitreous. Although this results in pathology, this same mechanism may be essential for physiology in a different setting. For instance, noncanonical VEGF action may contribute to the survival of PDGFRα-positive/VEGFR-negative cells (pericytes and astrocytes) during hypoxia. Because the elements of this survival mechanism are present in a variety of pathological and physiological contexts, it is possible that the VEGF/PDGF/non-PDGF paradigm extends beyond PVR pathogenesis.
Conceptually, the VEGF/PDGF/non-PDGF paradigm (Figure 1) can guide the design of therapies and therapeutic strategies. In the case of PVR—where survival of cells is a component of pathogenicity—a PDGFRα kinase inhibitor would be predicted to prevent PVR, whereas inhibition of VEGFR kinase would not. In contrast, antibodies that neutralize PDGF would have no effect, whereas antibodies that neutralize VEGF should prevent PVR. By extension, therefore, simultaneously neutralizing VEGF and PDGF would be much less effective than neutralizing VEGF alone. It is particularly bolstering to the integrity of this paradigm that many of these predictions have turned out to be correct.14,22,58,59 Overall, these principles are instructive in the design of therapeutic strategies for preventing PVR, and their application to additional pathological and physiological settings is an intriguing and as of yet unaddressed question.
Acknowledgments
We thank Dr. Magali Saint-Geniez for supplying the plasmids and primers required for real-time PCR; the clinicians who contributed to our existing collection of human vitreous for use in our translational work including Dr. Leo Kim (Massachusetts Eye and Ear Infirmary), Dr. Robert J. van Geest and colleagues (Ocular Angiogenesis Group and Academic Medical Center, Meibergdreef, Amsterdam), Drs. Dal W. Chun and Matthew Kuhnle (formerly of the Walter Reed Medical Center, Washington, DC), and Drs. Jing Cui and Joanne Matsubara (University of British Columbia); our peers at Schepens Eye Research Institute and Massachusetts Eye and Ear Infirmary, including Jessica Lanzim, Marie Ortega, Karen Krueger, and Henry Moreno for assistance with the rabbit experiments, and Drs. Hetian Lei and Sarah Jacobo for reviewing the manuscript and constructive input.
Footnotes
Supported by NIH grant EY022970 (A.K.) and the Mukai Fund of the Massachusetts Eye and Ear Infirmary (Boston) (S.M.).
Disclosures: None declared.
Supplemental Data
Aflibercept safely and effectively prevents experimental proliferative vitreoretinopathy (PVR) in the retinal pigment epithelial (RPE)-injection model. A: Aflibercept treatment prevents PVR in rabbits subjected to the RPE-injection model (expansion of Figure 2A). Rabbit eyes were examined postinjection and scored for development of PVR at the indicated time using an indirect ophthalmoscope and fundus lens. Day 21 examination preceded the second injection of aflibercept or IgG. The gray arrow traces the individual rabbit whose fundus was photographed on days 14, 21, and 28, as shown in Figure 2B. B: Aflibercept treatment in rabbits subjected to the RPE-injection model does not interfere with retinal function (expansion of Figure 2C). Aflibercept-treated rabbit eyes elicit the same electrophysiological response over three functional light-induced modes as their noninjected contralateral eyes, whereas control (IgG) injected eyes show no electrophysiological response. Aflibercept does not compromise the functional integrity of the retina or the electrical activity of retinal cells post-synaptic to photoreceptors.36–39C: Aflibercept treatment in rabbits subjected to the RPE-injection model does not significantly alter retinal morphological characteristics. The same eyes used for electroretinograms in Figure 2C were used for histological analysis of the retina (described in Figure 2D). A larger representative image of IgG-injected eyes (PVR stage 5) is shown. Note the convoluted retinas that appear completely detached, and the region of adjacent epiretinal membrane (ERM), containing both pigmented cells (RPE derived) and nonpigmented cells (possibly fibroblasts and glial cells). The asterisk in C indicates sites where the ERM is contiguous with the detached retina. ∗P < 0.05, ∗∗P < 0.01, VEGF Trap and IgG/mock control (Mann-Whitney analysis, A). a, negative a-wave component; b, positive b-wave component.
Aflibercept safely and effectively prevents experimental proliferative vitreoretinopathy (PVR) in the fibroblast-injection model. A: A single injection of aflibercept prevents PVR in rabbits subjected to the fibroblast-injection model. This figure is an expansion of Figure 3A, showing the PVR score from every time point examined over the course of the experiment. Rabbit eyes were examined postinjection and scored for development of PVR at days 1, 3, 5, and 7, and once per week thereafter (days 14, 21, and 28, respectively) using an indirect ophthalmoscope and fundus lens. Statistically significant differences between VEGF-Tr and IgG/mock-control–treated groups appeared starting at day 7. B: Aflibercept treatment in rabbits subjected to the fibroblast-injection model does not interfere with retinal function. This figure is an expansion of Figure 3B, showing scotopic flash and two additional modes of light-adapted ERG response: photopic flash and photopic flicker, all taken on day 26. Aflibercept does not compromise the functional integrity of the retina or the electrical activity of retinal cells post-synaptic to photoreceptors.36–39C: Aflibercept treatment in rabbits subjected to the fibroblast-injection model does not significantly alter retinal morphological characteristics. Histological analysis of the retina was performed on the same eyes used for ERG in Figure 3B (described in Figure 3C). A representative section from an IgG-injected eye (PVR stage 4) displays a detached, convoluted retina and an adjacent region of epiretinal membrane, the latter containing both pigmented and nonpigmented cells. ∗P < 0.05, ∗∗P < 0.01 (Mann-Whitney analysis, A). a, negative a-wave component; b, positive b-wave component.
References
- 1.Asaria R.H., Charteris D.G. Proliferative vitreoretinopathy: developments in pathogenesis and treatment. Compr Ophthalmol Update. 2006;7:179–185. [PubMed] [Google Scholar]
- 2.Campochiaro P.A. Mechanisms in ophthalmic disease: pathogenic mechanisms in proliferative vitreoretinopathy. Arch Ophthalmol. 1997;115:237–241. doi: 10.1001/archopht.1997.01100150239014. [DOI] [PubMed] [Google Scholar]
- 3.de la Rua E.R., Pastor J.C., Fernandez I., Sanabria M.R., Garcia-Arumi J., Martinez-Castillo V., Coco R., Manzanas L., Miranda I. Non-complicated retinal detachment management: variations in 4 years: retina 1 project; report 1. Br J Ophthalmol. 2008;92:523–525. doi: 10.1136/bjo.2007.127688. [DOI] [PubMed] [Google Scholar]
- 4.Glaser B.M., Cardin A., Biscoe B. Proliferative vitreoretinopathy: the mechanism of development of vitreoretinal traction. Ophthalmology. 1987;94:327–332. doi: 10.1016/s0161-6420(87)33443-8. [DOI] [PubMed] [Google Scholar]
- 5.Cardillo J.A., Stout J.T., LaBree L., Azen S.P., Omphroy L., Cui J.Z., Kimura H., Hinton D.R., Ryan S.J. Post-traumatic proliferative vitreoretinopathy: the epidemiologic profile, onset, risk factors, and visual outcome. Ophthalmology. 1997;104:1166–1173. doi: 10.1016/s0161-6420(97)30167-5. [DOI] [PubMed] [Google Scholar]
- 6.Machemer R., Aaberg T.M., Freeman H.M., Irvine A.R., Lean J.S., Michels R.M. An updated classification of retinal detachment with proliferative vitreoretinopathy. Am J Ophthalmol. 1991;112:159–165. doi: 10.1016/s0002-9394(14)76695-4. [DOI] [PubMed] [Google Scholar]
- 7.Tseng W., Cortez R.T., Ramirez G., Stinnett S., Jaffe G.J. Prevalence and risk factors for proliferative vitreoretinopathy in eyes with rhegmatogenous retinal detachment but no previous vitreoretinal surgery. Am J Ophthalmol. 2004;137:1105–1115. doi: 10.1016/j.ajo.2004.02.008. [DOI] [PubMed] [Google Scholar]
- 8.The classification of retinal detachment with proliferative vitreoretinopathy. Ophthalmology. 1983;90:121–125. doi: 10.1016/s0161-6420(83)34588-7. [DOI] [PubMed] [Google Scholar]
- 9.Campochiaro P.A., Bryan J.A., 3rd, Conway B.P., Jaccoma E.H. Intravitreal chemotactic and mitogenic activity: implication of blood-retinal barrier breakdown. Arch Ophthalmol. 1986;104:1685–1687. doi: 10.1001/archopht.1986.01050230123046. [DOI] [PubMed] [Google Scholar]
- 10.Clarkson J.G., Green W.R., Massof D. A histopathologic review of 168 cases of preretinal membrane. Am J Ophthalmol. 1977;84:1–17. [PubMed] [Google Scholar]
- 11.Lei H., Rheaume M.A., Cui J., Mukai S., Maberley D., Samad A., Matsubara J., Kazlauskas A. A novel function of p53: a gatekeeper of retinal detachment. Am J Pathol. 2012;181:866–874. doi: 10.1016/j.ajpath.2012.05.036. [DOI] [PMC free article] [PubMed] [Google Scholar]
- 12.Lei H., Velez G., Kazlauskas A. Pathological signaling via platelet-derived growth factor receptor {alpha} involves chronic activation of Akt and suppression of p53. Mol Cell Biol. 2011;31:1788–1799. doi: 10.1128/MCB.01321-10. [DOI] [PMC free article] [PubMed] [Google Scholar]
- 13.Levine A.J., Oren M. The first 30 years of p53: growing ever more complex. Nat Rev Cancer. 2009;9:749–758. doi: 10.1038/nrc2723. [DOI] [PMC free article] [PubMed] [Google Scholar]
- 14.Pennock S., Kim D., Mukai S., Kuhnle M., Chun D.W., Matsubara J., Cui J., Ma P., Maberley D., Samad A., Van Geest R.J., Oberstein S.L., Schlingemann R.O., Kazlauskas A. Ranibizumab is a potential prophylaxis for proliferative vitreoretinopathy, a nonangiogenic blinding disease. Am J Pathol. 2013;182:1659–1670. doi: 10.1016/j.ajpath.2013.01.052. [DOI] [PMC free article] [PubMed] [Google Scholar]
- 15.Pastor-Idoate S., Rodriguez-Hernandez I., Rojas J., Fernandez I., Garcia-Gutierrez M.T., Ruiz-Moreno J.M., Rocha-Sousa A., Ramkissoon Y., Harsum S., Maclaren R.E., Charteris D., van Meurs J., Gonzalez-Sarmiento R., Pastor J.C. The p53 codon 72 polymorphism (rs1042522) is associated with proliferative vitreoretinopathy: the Retina 4 Project. Ophthalmology. 2013;120:623–628. doi: 10.1016/j.ophtha.2012.08.019. [DOI] [PubMed] [Google Scholar]
- 16.Pastor-Idoate S., Rodriguez-Hernandez I., Rojas J., Fernandez I., Garcia-Gutierrez M.T., Ruiz-Moreno J.M., Rocha-Sousa A., Ramkissoon Y., Harsum S., MacLaren R.E., Charteris D., VanMeurs J.C., Gonzalez-Sarmiento R., Pastor J.C. The T309G MDM2 gene polymorphism is a novel risk factor for proliferative vitreoretinopathy. PLoS One. 2013;8:e82283. doi: 10.1371/journal.pone.0082283. [DOI] [PMC free article] [PubMed] [Google Scholar]
- 17.Rojas J., Fernandez I., Pastor J.C., Maclaren R.E., Ramkissoon Y., Harsum S., Charteris D.G., Van Meurs J.C., Amarakoon S., Ruiz-Moreno J.M., Rocha-Sousa A., Brion M., Carracedo A. A genetic case-control study confirms the implication of SMAD7 and TNF locus in the development of proliferative vitreoretinopathy. Invest Ophthalmol Vis Sci. 2013;54:1665–1678. doi: 10.1167/iovs.12-10931. [DOI] [PubMed] [Google Scholar]
- 18.Pennock S., Haddock L.J., Eliott D., Mukai S., Kazlauskas A. Is neutralizing vitreal growth factors a viable strategy to prevent proliferative vitreoretinopathy? Prog Retin Eye Res. 2014;40:16–34. doi: 10.1016/j.preteyeres.2013.12.006. [DOI] [PubMed] [Google Scholar]
- 19.Andrews A., Balciunaite E., Leong F.L., Tallquist M., Soriano P., Refojo M., Kazlauskas A. Platelet-derived growth factor plays a key role in proliferative vitreoretinopathy. Invest Ophthalmol Vis Sci. 1999;40:2683–2689. [PubMed] [Google Scholar]
- 20.Ikuno Y., Leong F.L., Kazlauskas A. Attenuation of experimental proliferative vitreoretinopathy by inhibiting the platelet-derived growth factor receptor. Invest Ophthalmol Vis Sci. 2000;41:3107–3116. [PubMed] [Google Scholar]
- 21.Lei H., Hovland P., Velez G., Haran A., Gilbertson D., Hirose T., Kazlauskas A. A potential role for PDGF-C in experimental and clinical proliferative vitreoretinopathy. Invest Ophthalmol Vis Sci. 2007;48:2335–2342. doi: 10.1167/iovs.06-0965. [DOI] [PubMed] [Google Scholar]
- 22.Lei H., Velez G., Hovland P., Hirose T., Gilbertson D., Kazlauskas A. Growth factors outside the PDGF family drive experimental PVR. Invest Ophthalmol Vis Sci. 2009;50:3394–3403. doi: 10.1167/iovs.08-3042. [DOI] [PMC free article] [PubMed] [Google Scholar]
- 23.Lei H., Kazlauskas A. Growth factors outside of the platelet-derived growth factor (PDGF) family employ reactive oxygen species/Src family kinases to activate PDGF receptor alpha and thereby promote proliferation and survival of cells. J Biol Chem. 2009;284:6329–6336. doi: 10.1074/jbc.M808426200. [DOI] [PMC free article] [PubMed] [Google Scholar]
- 24.Pennock S., Rheaume M.A., Mukai S., Kazlauskas A. A novel strategy to develop therapeutic approaches to prevent proliferative vitreoretinopathy. Am J Pathol. 2011;179:2931–2940. doi: 10.1016/j.ajpath.2011.08.043. [DOI] [PMC free article] [PubMed] [Google Scholar]
- 25.Baudouin C., Fredj-Reygrobellet D., Brignole F., Negre F., Lapalus P., Gastaud P. Growth factors in vitreous and subretinal fluid cells from patients with proliferative vitreoretinopathy. Ophthalmic Res. 1993;25:52–59. doi: 10.1159/000267221. [DOI] [PubMed] [Google Scholar]
- 26.Kon C.H., Occleston N.L., Aylward G.W., Khaw P.T. Expression of vitreous cytokines in proliferative vitreoretinopathy: a prospective study. Invest Ophthalmol Vis Sci. 1999;40:705–712. [PubMed] [Google Scholar]
- 27.Robbins S.G., Mixon R.N., Wilson D.J., Hart C.E., Robertson J.E., Westra I., Planck S.R., Rosenbaum J.T. Platelet-derived growth factor ligands and receptors immunolocalized in proliferative retinal diseases. Invest Ophthalmol Vis Sci. 1994;35:3649–3663. [PubMed] [Google Scholar]
- 28.Pennock S., Kazlauskas A. Vascular endothelial growth factor A competitively inhibits platelet-derived growth factor (PDGF)-dependent activation of PDGF receptor and subsequent signaling events and cellular responses. Mol Cell Biol. 2012;32:1955–1966. doi: 10.1128/MCB.06668-11. [DOI] [PMC free article] [PubMed] [Google Scholar]
- 29.Lei H., Rheaume M.A., Kazlauskas A. Recent developments in our understanding of how platelet-derived growth factor (PDGF) and its receptors contribute to proliferative vitreoretinopathy. Exp Eye Res. 2010;90:376–381. doi: 10.1016/j.exer.2009.11.003. [DOI] [PMC free article] [PubMed] [Google Scholar]
- 30.Lei H., Rheaume M.A., Velez G., Mukai S., Kazlauskas A. Expression of PDGFRalpha is a determinant of the PVR potential of ARPE19 cells. Invest Ophthalmol Vis Sci. 2011;52:5016–5021. doi: 10.1167/iovs.11-7442. [DOI] [PMC free article] [PubMed] [Google Scholar]
- 31.Nakagawa M., Refojo M.F., Marin J.F., Doi M., Tolentino F.I. Retinoic acid in silicone and silicone-fluorosilicone copolymer oils in a rabbit model of proliferative vitreoretinopathy. Invest Ophthalmol Vis Sci. 1995;36:2388–2395. [PubMed] [Google Scholar]
- 32.Morris T.H. Formulary for Laboratory Animals: Third Edition. In: Hawk CT L.S., Morris T., editors. Blackwell Publishing; Ames, IA: 2005. pp. 3–13. [Google Scholar]
- 33.Haddock L.J., Kim D.Y., Mukai S. Simple, inexpensive technique for high-quality smartphone fundus photography in human and animal eyes. J Ophthalmol. 2013;2013:518479. doi: 10.1155/2013/518479. [DOI] [PMC free article] [PubMed] [Google Scholar]
- 34.Fastenberg D.M., Diddie K.R., Sorgente N., Ryan S.J. A comparison of different cellular inocula in an experimental model of massive periretinal proliferation. Am J Ophthalmol. 1982;93:559–564. doi: 10.1016/s0002-9394(14)77369-6. [DOI] [PubMed] [Google Scholar]
- 35.Duke S.L., Kump L.I., Yuan Y., West W.W., Sachs A.J., Haider N.B., Margalit E. The safety of intraocular linezolid in rabbits. Invest Ophthalmol Vis Sci. 2010;51:3115–3119. doi: 10.1167/iovs.09-4244. [DOI] [PubMed] [Google Scholar]
- 36.Brown K.T., Wiesel T.N. Localization of origins of electroretinogram components by intraretinal recording in the intact cat eye. J Physiol. 1961;158:257–280. doi: 10.1113/jphysiol.1961.sp006768. [DOI] [PMC free article] [PubMed] [Google Scholar]
- 37.Brown K.T., Wiesel T.N. Analysis of the intraretinal electroretinogram in the intact cat eye. J Physiol. 1961;158:229–256. doi: 10.1113/jphysiol.1961.sp006767. [DOI] [PMC free article] [PubMed] [Google Scholar]
- 38.Pepperberg D.R., Masland R.H. Retinal-induced sensitization of light-adapted rabbit photoreceptors. Brain Res. 1978;151:194–200. doi: 10.1016/0006-8993(78)90964-2. [DOI] [PubMed] [Google Scholar]
- 39.Sillman A.J., Ito H., Tomita T. Studies on the mass receptor potential of the isolated frog retina, I: general properties of the response. Vision Res. 1969;9:1435–1442. doi: 10.1016/0042-6989(69)90059-5. [DOI] [PubMed] [Google Scholar]
- 40.Wong C.A., Potter M.J., Cui J.Z., Chang T.S., Ma P., Maberley A.L., Ross W.H., White V.A., Samad A., Jia W., Hornan D., Matsubara J.A. Induction of proliferative vitreoretinopathy by a unique line of human retinal pigment epithelial cells. Can J Ophthalmol. 2002;37:211–220. doi: 10.1016/s0008-4182(02)80112-0. [DOI] [PubMed] [Google Scholar]
- 41.Banerjee S., Savant V., Scott R.A., Curnow S.J., Wallace G.R., Murray P.I. Multiplex bead analysis of vitreous humor of patients with vitreoretinal disorders. Invest Ophthalmol Vis Sci. 2007;48:2203–2207. doi: 10.1167/iovs.06-1358. [DOI] [PubMed] [Google Scholar]
- 42.Debacq-Chainiaux F., Erusalimsky J.D., Campisi J., Toussaint O. Protocols to detect senescence-associated beta-galactosidase (SA-betagal) activity, a biomarker of senescent cells in culture and in vivo. Nat Protoc. 2009;4:1798–1806. doi: 10.1038/nprot.2009.191. [DOI] [PubMed] [Google Scholar]
- 43.Alitalo K. The lymphatic vasculature in disease. Nat Med. 2011;17:1371–1380. doi: 10.1038/nm.2545. [DOI] [PubMed] [Google Scholar]
- 44.Robinson C.J., Stringer S.E. The splice variants of vascular endothelial growth factor (VEGF) and their receptors. J Cell Sci. 2001;114:853–865. doi: 10.1242/jcs.114.5.853. [DOI] [PubMed] [Google Scholar]
- 45.Agrawal R.N., He S., Spee C., Cui J.Z., Ryan S.J., Hinton D.R. In vivo models of proliferative vitreoretinopathy. Nat Protoc. 2007;2:67–77. doi: 10.1038/nprot.2007.4. [DOI] [PubMed] [Google Scholar]
- 46.Cook B., Lewis G.P., Fisher S.K., Adler R. Apoptotic photoreceptor degeneration in experimental retinal detachment. Invest Ophthalmol Vis Sci. 1995;36:990–996. [PubMed] [Google Scholar]
- 47.Lo A.C., Woo T.T., Wong R.L., Wong D. Apoptosis and other cell death mechanisms after retinal detachment: implications for photoreceptor rescue. Ophthalmologica. 2011;226(Suppl 1):10–17. doi: 10.1159/000328206. [DOI] [PubMed] [Google Scholar]
- 48.Rosenbaum D.M., Rosenbaum P.S., Gupta H., Singh M., Aggarwal A., Hall D.H., Roth S., Kessler J.A. The role of the p53 protein in the selective vulnerability of the inner retina to transient ischemia. Invest Ophthalmol Vis Sci. 1998;39:2132–2139. [PubMed] [Google Scholar]
- 49.Trichonas G., Murakami Y., Thanos A., Morizane Y., Kayama M., Debouck C.M., Hisatomi T., Miller J.W., Vavvas D.G. Receptor interacting protein kinases mediate retinal detachment-induced photoreceptor necrosis and compensate for inhibition of apoptosis. Proc Natl Acad Sci U S A. 2010;107:21695–21700. doi: 10.1073/pnas.1009179107. [DOI] [PMC free article] [PubMed] [Google Scholar]
- 50.Levine A.J. p53, The cellular gatekeeper for growth and division. Cell. 1997;88:323–331. doi: 10.1016/s0092-8674(00)81871-1. [DOI] [PubMed] [Google Scholar]
- 51.Koch S., Tugues S., Li X., Gualandi L., Claesson-Welsh L. Signal transduction by vascular endothelial growth factor receptors. Biochem J. 2011;437:169–183. doi: 10.1042/BJ20110301. [DOI] [PubMed] [Google Scholar]
- 52.Matsumoto T., Claesson-Welsh L. VEGF receptor signal transduction. Sci STKE. 2001;2001:RE21. doi: 10.1126/stke.2001.112.re21. [DOI] [PubMed] [Google Scholar]
- 53.Maier R., Weger M., Haller-Schober E.M., El-Shabrawi Y., Theisl A., Barth A., Aigner R., Haas A. Application of multiplex cytometric bead array technology for the measurement of angiogenic factors in the vitreous. Mol Vis. 2006;12:1143–1147. [PubMed] [Google Scholar]
- 54.Ogawa S., Oku A., Sawano A., Yamaguchi S., Yazaki Y., Shibuya M. A novel type of vascular endothelial growth factor, VEGF-E (NZ-7 VEGF), preferentially utilizes KDR/Flk-1 receptor and carries a potent mitotic activity without heparin-binding domain. J Biol Chem. 1998;273:31273–31282. doi: 10.1074/jbc.273.47.31273. [DOI] [PubMed] [Google Scholar]
- 55.Meyer M., Clauss M., Lepple-Wienhues A., Waltenberger J., Augustin H.G., Ziche M., Lanz C., Buttner M., Rziha H.J., Dehio C. A novel vascular endothelial growth factor encoded by Orf virus, VEGF-E, mediates angiogenesis via signalling through VEGFR-2 (KDR) but not VEGFR-1 (Flt-1) receptor tyrosine kinases. EMBO J. 1999;18:363–374. doi: 10.1093/emboj/18.2.363. [DOI] [PMC free article] [PubMed] [Google Scholar]
- 56.Velez G., Weingarden A.R., Lei H., Kazlauskas A., Gao G. SU9518 inhibits proliferative vitreoretinopathy in fibroblast and genetically modified Muller cell-induced rabbit models. Invest Ophthalmol Vis Sci. 2013;54:1392–1397. doi: 10.1167/iovs.12-10320. [DOI] [PMC free article] [PubMed] [Google Scholar]
- 57.Zheng Y., Ikuno Y., Ohj M., Kusaka S., Jiang R., Cekic O., Sawa M., Tano Y. Platelet-derived growth factor receptor kinase inhibitor AG1295 and inhibition of experimental proliferative vitreoretinopathy. Jpn J Ophthalmol. 2003;47:158–165. doi: 10.1016/s0021-5155(02)00698-6. [DOI] [PubMed] [Google Scholar]
- 58.Ikuno Y., Kazlauskas A. TGFbeta1-dependent contraction of fibroblasts is mediated by the PDGFalpha receptor. Invest Ophthalmol Vis Sci. 2002;43:41–46. [PubMed] [Google Scholar]
- 59.Tingstrom A., Heldin C.H., Rubin K. Regulation of fibroblast-mediated collagen gel contraction by platelet-derived growth factor, interleukin-1 alpha and transforming growth factor-beta 1. J Cell Sci. 1992;102(Pt 2):315–322. doi: 10.1242/jcs.102.2.315. [DOI] [PubMed] [Google Scholar]
Associated Data
This section collects any data citations, data availability statements, or supplementary materials included in this article.
Supplementary Materials
Aflibercept safely and effectively prevents experimental proliferative vitreoretinopathy (PVR) in the retinal pigment epithelial (RPE)-injection model. A: Aflibercept treatment prevents PVR in rabbits subjected to the RPE-injection model (expansion of Figure 2A). Rabbit eyes were examined postinjection and scored for development of PVR at the indicated time using an indirect ophthalmoscope and fundus lens. Day 21 examination preceded the second injection of aflibercept or IgG. The gray arrow traces the individual rabbit whose fundus was photographed on days 14, 21, and 28, as shown in Figure 2B. B: Aflibercept treatment in rabbits subjected to the RPE-injection model does not interfere with retinal function (expansion of Figure 2C). Aflibercept-treated rabbit eyes elicit the same electrophysiological response over three functional light-induced modes as their noninjected contralateral eyes, whereas control (IgG) injected eyes show no electrophysiological response. Aflibercept does not compromise the functional integrity of the retina or the electrical activity of retinal cells post-synaptic to photoreceptors.36–39C: Aflibercept treatment in rabbits subjected to the RPE-injection model does not significantly alter retinal morphological characteristics. The same eyes used for electroretinograms in Figure 2C were used for histological analysis of the retina (described in Figure 2D). A larger representative image of IgG-injected eyes (PVR stage 5) is shown. Note the convoluted retinas that appear completely detached, and the region of adjacent epiretinal membrane (ERM), containing both pigmented cells (RPE derived) and nonpigmented cells (possibly fibroblasts and glial cells). The asterisk in C indicates sites where the ERM is contiguous with the detached retina. ∗P < 0.05, ∗∗P < 0.01, VEGF Trap and IgG/mock control (Mann-Whitney analysis, A). a, negative a-wave component; b, positive b-wave component.
Aflibercept safely and effectively prevents experimental proliferative vitreoretinopathy (PVR) in the fibroblast-injection model. A: A single injection of aflibercept prevents PVR in rabbits subjected to the fibroblast-injection model. This figure is an expansion of Figure 3A, showing the PVR score from every time point examined over the course of the experiment. Rabbit eyes were examined postinjection and scored for development of PVR at days 1, 3, 5, and 7, and once per week thereafter (days 14, 21, and 28, respectively) using an indirect ophthalmoscope and fundus lens. Statistically significant differences between VEGF-Tr and IgG/mock-control–treated groups appeared starting at day 7. B: Aflibercept treatment in rabbits subjected to the fibroblast-injection model does not interfere with retinal function. This figure is an expansion of Figure 3B, showing scotopic flash and two additional modes of light-adapted ERG response: photopic flash and photopic flicker, all taken on day 26. Aflibercept does not compromise the functional integrity of the retina or the electrical activity of retinal cells post-synaptic to photoreceptors.36–39C: Aflibercept treatment in rabbits subjected to the fibroblast-injection model does not significantly alter retinal morphological characteristics. Histological analysis of the retina was performed on the same eyes used for ERG in Figure 3B (described in Figure 3C). A representative section from an IgG-injected eye (PVR stage 4) displays a detached, convoluted retina and an adjacent region of epiretinal membrane, the latter containing both pigmented and nonpigmented cells. ∗P < 0.05, ∗∗P < 0.01 (Mann-Whitney analysis, A). a, negative a-wave component; b, positive b-wave component.