

Abstract
Background
As large genomics and phenotypic datasets are becoming more common, it is increasingly difficult for most researchers to access, manage, and analyze them. One possible approach is to provide the research community with several petabyte-scale cloud-based computing platforms containing these data, along with tools and resources to analyze it.
Methods
Bionimbus is an open source cloud-computing platform that is based primarily upon OpenStack, which manages on-demand virtual machines that provide the required computational resources, and GlusterFS, which is a high-performance clustered file system. Bionimbus also includes Tukey, which is a portal, and associated middleware that provides a single entry point and a single sign on for the various Bionimbus resources; and Yates, which automates the installation, configuration, and maintenance of the software infrastructure required.
Results
Bionimbus is used by a variety of projects to process genomics and phenotypic data. For example, it is used by an acute myeloid leukemia resequencing project at the University of Chicago. The project requires several computational pipelines, including pipelines for quality control, alignment, variant calling, and annotation. For each sample, the alignment step requires eight CPUs for about 12 h. BAM file sizes ranged from 5 GB to 10 GB for each sample.
Conclusions
Most members of the research community have difficulty downloading large genomics datasets and obtaining sufficient storage and computer resources to manage and analyze the data. Cloud computing platforms, such as Bionimbus, with data commons that contain large genomics datasets, are one choice for broadening access to research data in genomics.
Keywords: cloud computing, biomedical clouds, genomic clouds
Objective
This paper describes the Bionimbus Protected Data Cloud (PDC), an open-source cloud-based infrastructure for managing, analyzing, and sharing large amounts of genomics and phenotypic data in a secure and compliant manner.
As hundreds to thousands of exomes and whole genomes are now being routinely sequenced as part of biomedical studies, it has become a challenge for all but the largest research groups to manage computational systems able to store and analyze these datasets. One possible approach to this problem is to manage and operate a centralized resource for the research community that provides the required data management, data analysis, and data sharing infrastructure.
Such a resource needs to be able to manage and analyze petabytes of data and to be able to provide the security and compliance required by controlled-access data, such as The Cancer Genome Atlas (TCGA) and other controlled-access data from dbGaP (database of genotypes and phenotypes; http://www.ncbi.nlm.nih.gov/gap).
In this paper, we describe such a resource, called Bionimbus.
Background and significance
Challenges created by large genomics datasets
The research community is facing a difficult challenge as the cost of sequencing continues to decrease and the amount of sequenced genomics data continues to grow exponentially. As large genomics datasets are becoming more common, it has become increasingly difficult for most researchers to access, manage, and analyze these data.
As one example, TCGA is sequencing the normal and diseased tissue for a projected 500 patients across each of over 20 different cancer types (cancergenome.nih.gov). The genomics data (BAM (binary alignment map) files), which are stored at CG Hub (cghub.ucsc.edu), are now about 500 TB in size and are expected to grow to 2.5 PB within the next 3 years. It is simply not practical for every medical research center to duplicate these data and to assemble enough computing resources to be able to perform an integrative analysis of them. It is also a challenge, even for large centers, to provide the required and usually stringent compliance and security when working with protected human genomics data.
As the analysis of a patient's genome to provide individualized treatment1 becomes more common, there will be a growing need for computational environments that can support the analysis of large amounts of human genomics data in a secure and compliant fashion.
One approach that has been suggested is to provide cloud-based access to large genomics and phenotypic datasets.2–4
Cloud computing platforms
By a computing platform we mean an integrated hardware architecture and a software stack consisting of an operating system, libraries, software frameworks, and applications that allows user-developed software to run. The basic properties of cloud computing platforms, the advantages they provide, and the relevance to genomics has been articulated over the past few years.2–5
A formal definition of a cloud has been developed by the National Institute of Standards and Technology (NIST).6 For purposes of the system we describe here, the essential properties are that a cloud-based infrastructure is a shared pool of configurable computing resources6 that provide:
on-demand self service
rapid elasticity.
On-demand self service refers to the ability of a user to acquire computing resources when they need them, and for as long as they need them, through a simple web portal. Figure 1 is an example of the portal that Bionimbus uses when users need computing resources.
Figure 1.
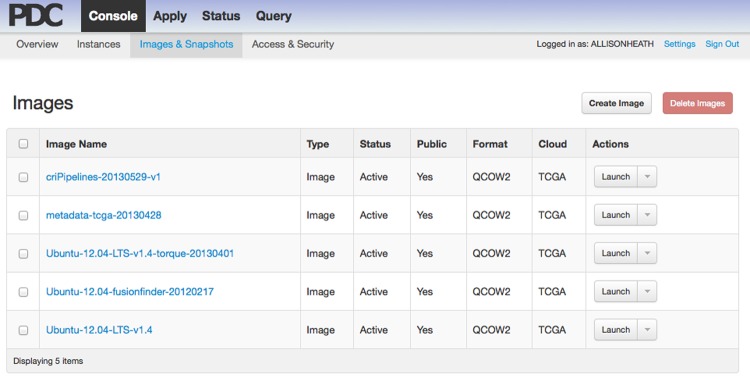
Screenshot of the Tukey console from the Bionimbus Protected Data Cloud. A user can click an image and then click the button labeled ‘Launch’ to start one or more virtual machines. Different images contain different tools, utilities, and pipelines. Users can also create their own custom images containing specific pipelines, tools, and applications of interest.
Rapid elasticity means that the computing resource can scale up (or down) as the needs of the user change. In practice, this means that the scale of the underlying resource is significantly larger than any user or project requires and that the resource as a whole is managed in such a way that each individual user or project has as many resources as they require.
A common way to support rapid elasticity is to launch virtualized machines as needed and to retire them when no longer needed, instead of assigning physical machines to individuals and projects on what is usually a much longer time period.7
The definition developed by NIST also distinguishes between several deployment models, including public clouds, such as Amazon Web Services (AWS), which support multiple organizations over a shared infrastructure, and private clouds, such as clouds that are run internally by an organization, such as a company or a university.
Data commons
The term ‘commons’ is defined as a resource that belongs to, or affects, the whole community. There are a number of efforts and proposals to create biomedical data commons in order to support the research community, such as Sage Bionetworks,8 CG Hub, and the Global Alliance (http://www.broadinstitute.org/news/globalalliance). For the reasons mentioned above, cloud computing platforms are one mechanism for supporting data commons.
Biomedical clouds are cloud computing platforms that might support data commons that include genomics data, medical images, electronic medical records, and many other types of biomedical data. Here we describe one such cloud that, so far, primarily supports genome sequences and associated metadata. Sometimes the term genomics cloud is used to describe a biomedical cloud that primarily supports genomics data.
Open-access versus controlled-access data
Genomics data are sometimes distinguished by using the concepts of different levels of processing—for example, level 1 can be defined as raw data; level 2 as processed data; level 3 data as interpretations; and level 4 data as aggregated and summarized.9 Access to level 1 data is usually controlled and restricted to users who agree to terms and conditions in a data use agreement unless the consent process under which the data has been collected has authorized researchers to make the data generally available. An example of raw data that are open access is genomics data from the 1000 Genomes Project.10 At the other end of the spectrum, level 4 data are aggregated in a way that makes it impossible to identify individuals and are open-access data available to any interested researcher. In general, level 2 and level 3 data are also treated as open-access data if the data are not viewed as being able to identify individuals. Clouds that contain controlled-access data, including genomics clouds that contain level 1 data, require additional security and compliance in order to protect the controlled-access data.
In this paper, we describe a petabyte-scale cloud computing platform that we have developed, implemented, and now operate for the research community called Bionimbus.
Methods
Open science data cloud software architecture
Bionimbus is part of a larger project called the Open Science Data Cloud (OSDC)11 and there is a version of Bionimbus (Bionimbus Community Cloud) for open-access data and a version for controlled-access data (Bionimbus PDC).
The software architecture is shown in figure 2. The OSDC architecture uses OpenStack (openstack.org) to launch and manage virtual machines and GlusterFS (gluster.org) to manage the data commons and to give users access to working space. Both OpenStack and GlusterFS are open source.
Figure 2.
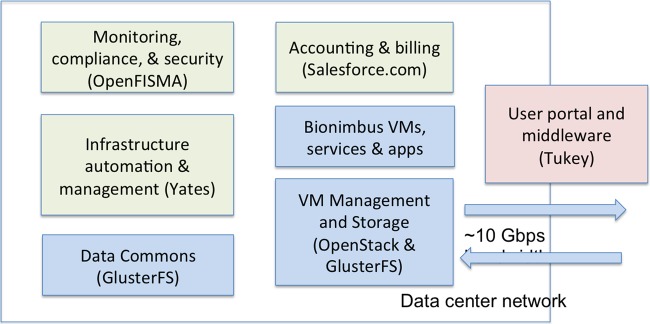
Major components of the Open Science Data Cloud (OSDC). The OpenFISMA-based application for monitoring, compliance and security is only part of the Bionimbus Protected Data Cloud, and not used by the OSDC in general. FISMA, Federal Information Security Management Act.
One of our goals was to create a minimal software suite to allow for the efficient operation of the OSDC and Bionimbus, using as small a staff as possible. With that goal in mind we developed the following software:
Tukey, which consists of a portal to provide users with a single entry point to OSDC services, and middleware to manage and integrate the various OSDC services.
Yates, which is an application used to install automatically our OSDC software stack in a new rack.
An accounting system to track users, the core hours they use, and the storage they use.
In addition, for the Bionimbus PDC, we developed an application based upon OpenFISMA (openfisma.org):
A status and monitoring system that includes compliance and security services.
Tukey is currently available from GitHub (github.com/opencloudconsortium). We plan to make Yates available via GitHub in late 2013 or early 2014.
Tukey console and middleware
The Tukey Console is a web application based on Django (http://www.djangoproject.com) and uses the Tukey middleware (described below) to provide users with a single point of access to OSDC resources. The project began as an extension of Horizon, OpenStack's Dashboard (horizon.openstack.org); however, the need to support different authentication methods and other cloud software stacks required the development of a separate application based on Horizon. The core functionality of the web application is virtual machine provisioning with usage and billing information. Tukey also supports file sharing management and public dataset management.
The middleware portion of Tukey provides the ability to authenticate users and interface with various cloud software stacks. It consists of HTTP-based proxies for authentication and application programming interface (API) translations that sit between the Tukey web application and the cloud software stacks. This design allows it to be extensible to use other forms of authorization and cloud software stacks. Currently, the software can handle authentication via Shibboleth or OpenID and can interface with OpenStack and Eucalyptus-based clouds.
Authentication and authorization
In general for the OSDC, we use Internet2's InCommon to authenticate researchers. Some contracts and agreements that govern how we make controlled-access datasets available to authorized users require that we use specific procedures to authenticate users and verify their authorizations to certain datasets. For example, to analyze controlled-access genomics data from dbGaP, researchers login into the Bionimbus PDC using their NIH eRA Common credentials. This securely passes authentication to Bionimbus using the same protocols and software as InCommon. The NCBI/NIH maintains tables of authorized dbGaP users and the Bionimbus PDC queries these tables at least twice a day to determine which dbGaP datasets a user is authorized to access. To access other controlled-access data, researchers login into the Bionimbus PDC using their university's credentials. This securely passes authentication to Bionimbus via InCommon. In this case, the Bionimbus PDC maintains an internal database of which datasets users are authorized to access it.
Data transport
Transferring large genomics datasets over wide area networks can require days to weeks. Various solutions have been developed including Aspera, which is used by NIH, and GeneTorrent, which is used by CG Hub.
Bionimbus uses an open-source high-performance network protocol called UDT12 and an application called UDR (github.com/LabAdvComp/UDR) that integrates UDT with the Unix utility rsync that is used for synchronizing two datasets.
We use UDR within Bionimbus to synchronize some of the large genomics sets that are part of the Bionimbus Data Commons. For example, we keep a synchronized copy of the Encyclopedia of DNA Elements (ENCODE) project data repository (genome.ucsc.edu/ENCODE/) that is maintained by the ENCODE Data Coordinating Center located at the University of California, Santa Cruz (UCSC).
Before starting the product synchronization, we tested UDR and rsync to transfer the same ENCODE data from UCSC to an empty directory on an OSDC system. UDR consistently performed at about 1 Gbps while rsync was <200 Mbps; both transfers were unencrypted. A plot of the transfer speed over time is depicted in figure 3. After these tests, the initial production transfer was 3.3 TB and took about 7 h and 30 min with UDR in April 2013. Since then we have kept these data synchronized daily and it has grown to 32.4 TB.
Figure 3.
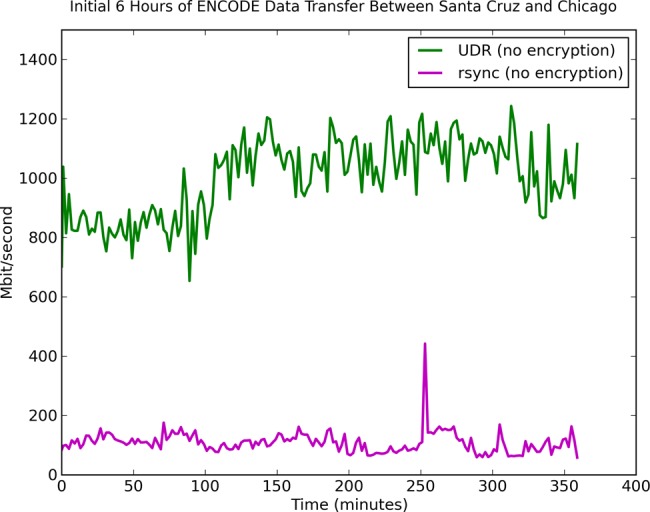
Moving large genomics datasets over wide area networks can be difficult. The Open Science Data Cloud (OSDC) supports several protocols for moving datasets, including the open-source UDR protocol, which integrates UDT with rsync and is designed to synchronize large datasets over wide-area, high-performance networks. The figure shows the relative comparison of UDR with rsync when synchronizing the Encyclopedia of DNA Elements (ENCODE) repository between the OSDC in Chicago and the ENCODE Data Coordination Center in Santa Cruz. The transfer speed varies, but UDR consistently has at least four to five times the performance of rsync. ENCODE is open access and UDR without encryption can be used. UDR with encryption enabled (for moving controlled-access data) achieves about 660 Mb/s when transferring data between the Bionimbus Protected Data Cloud in Chicago with a server at the Ontario Institute for Cancer Research in Toronto, Canada. The speed can be increased using disks with higher throughput or using multiple flows to multiple disks.
Infrastructure automation
To provide elastic computing capacity requires operating large-scale clouds, which in turn requires automating the process of installing, configuring, and managing the OSDC hardware, systems software, software frameworks, and application software. Sometimes this is called infrastructure automation. Yates is a flexible, turn-key solution that the OSDC developed for automating installation of software ‘a rack at a time’. Yates automates the pieces of a setup process that are normally done by hand, one node at a time, and allows changes to our setup to propagate in minutes. It uses the preboot execution environment capability of servers to load a minimal system to install an operating system and to configure networking. Yates also employs Chef (http://www.opscode.com/chef), an infrastructure-as-code tool, to install and configure the full software stack of a cloud environment. Using Yates in the OSDC has reduced the formerly week-long process of setting up a rack of nodes to under an hour.
Billing and accounting
One of the lessons learnt from the first 2 years of OSDC operations is that even basic billing and accounting are effective at limiting unused resources and providing incentives to properly share resources. We currently bill based on core hours and storage usage. We poll every minute to see the number and types of virtual machine a user has provisioned and then use this information to calculate the core hours. Storage is checked once a day for each user. Our billing cycle is monthly and users can check their current usage via the OSDC web interface. Accounting and invoicing are done using Salesforce.com.
Security and compliance
As part of the contractual relationships required to access large collections of controlled-access data, such as TCGA, Bionimbus needs enhanced security, reporting, and compliance. In particular, the Bionimbus PDC is required to operate under a set of guidelines developed by NIST called FISMA. These requirements served as a guide to improve the security of Bionimbus and to generate the associated documentation. We modified the open source OpenFISMA application to help automate this process. For example, with our modifications, security scans are performed automatically at regular intervals and the results recorded.
Results
Bionimbus has been in operation for 4 years and the current version is V.3.0. The Bionimbus Community Cloud data commons contains a variety of open-access datasets, including the 1000 Genomes and ENCODE datasets.10 13 The Bionimbus PDC hosts controlled access data from the TCGA project and allows researchers who have the appropriate dbGaP approvals to log in to Bionimbus and to analyze the data within Bionimbus in a secure and compliant fashion.
In this section, we describe two studies that are typical of the way in which Bionimbus is being used. Table 1 summarizes some of the basic facts about the OSDC and Bionimbus.
Table 1.
The Open Science Data Cloud (OSDC; in October 2013) consists of 7994 cores, 9.2 PB of raw storage and 5.7 PB of usable storage
| All OSDC resources | Cores | Compute cores | Total RAM (TB) | Computed RAM (TB) | Raw storage (PB) | Usable storage (PB) |
|---|---|---|---|---|---|---|
| Open access clouds | 3632 | 3168 | 13.9 | 12.9 | 4.4 | 2.6 |
| Bionimbus PDC | 2816 | 2664 | 11.0 | 10.9 | 2.5 | 1.5 |
| Hadoop | 1090 | 1030 | 3.5 | 3.2 | 1.5 | 1.1 |
| Other resources | 456 | 352 | 1.5 | 1.4 | 0.8 | 0.5 |
| Total | 7994 | 7214 | 29.9 | 28.4 | 9.2 | 5.7 |
This includes both the open-access Bionimbus Community Cloud and the controlled-access Bionimbus Protected Data Cloud (PDC). There is a data commons that is part of the open-access OSDC that consists of 1.4 PB of raw storage and 0.9 PB of usable storage. The Bionimbus PDC contains a data commons that contains about 0.5 PB of usable storage. The Bionimbus PDC can also access data from the open-access data commons. The other OSDC resources consist of a test bed, development machines, web servers, etc. During October 2013, there were about 150 active users out of a total of about 360 users. During October 2013, an average of 47% of the available core hours were used for the resources that were available for general users. Older resources were more highly used (86%), while newer resources were more lightly used (18%). The amount of usable space is less than the raw storage, since we make use of redundant array of independent disks (RAID) 5 and RAID 6 for GlusterFS and keep disks as hot spares.
Analysis of RNA sequencing and exome sequencing data
The goal of the acute myeloid leukemia (AML) resequencing project was to identify somatic variants expressed in adverse-risk primary AML samples. This effort led to the identification of a gene frequently disrupted in this type of AML.14 Most of the data analysis for this project was performed on Bionimbus. This project is representative of 27 other projects that involve next-generation sequencing analysis of a similar number of primary patient samples (average number=30, range 2–120), which required similar computational and storage resources on Bionimbus.
The AML project involved RNA sequencing or exome sequencing of 56 patient samples. The patient samples were de-identified; however, sequence data was maintained in an HIPAA-compliant manner to maintain the security of the genetic information. Both single and paired-end next-generation sequencing data were produced on Illumina Genome Analyzer II and HiSeq machines. After base-calling, the sequence files were transferred to Bionimbus. Each sample generated between 20 to over 100 million reads which was stored as gzip compressed FASTQ files requiring between 1 and 6 GB of storage space for each sample. The data were processed through several computational pipelines. The first was trimming of low-quality bases using custom scripts, followed by alignment to the human reference genome using TopHat15 for RNA and BWA (Burrows–Wheeler Aligner)16 for exome sequence and output in the BAM format.17 The alignment step was performed using eight central processing units (CPUs) for about 12 h for each sample. Most of the downstream programs used one CPU. BAM file sizes ranged from 5 to 10 GB for each sample. Further quality control, alignment manipulation, and refinement was performed with SAMtools,17 Picard (picard.sourceforge.net), the Genome Analysis Toolkit18 and custom Perl scripts. These steps generated intermediate files close in size to the original BAM files, which were also retained.
The ultimate goal of sequencing was to identify variants within the sequence such as single nucleotide polymorphisms, somatic mutations, and small insertions and deletions. To this end, all samples were genotyped using several algorithms.19 20 Genotype data were then annotated with databases, including dbSNP,21 COSMIC22 and evolutionary constraint.23 The Cufflinks program was used to estimate transcript abundance24 within the RNA-sequencing data. Bionimbus was employed for developing software for, and detecting fusions in, the RNA-sequencing data as detailed below.
Gene fusion analyses
Many biologically significant fusions have been identified that serve as diagnostic, prognostic, and therapeutic targets. BCR-ABL1 is a classic example of a fusion seen in chronic myelogenous leukemia. This fusion results in loss of the phosphatase-binding pocket of the ABL1 protein and as a consequence its tyrosine kinase domain is constitutively activated, which subsequently misregulates many regulatory pathways.25 Transcriptome sequencing has been demonstrated successfully to capture numerous such fusions in different types of tumors.26–28 We have used Bionimbus as a platform to identify many fusions using both transcriptome and whole-genome paired-end sequencing of tumors.
Computational requirements remain a significant challenge in fusion discovery from RNA sequencing. Our fusion discovery pipeline on Bionimbus involves first aligning the reads to the genome/transcriptome using BWA.16 Initial lists of candidate fusions are identified by clustering pairs of discordant reads with each end mapping to two different genes. Next, breakpoint junctions for each candidate fusion are identified by local assembly of reads at regions proximal to the ends of the breakpoint cluster. Finally, a series of filters are applied to remove false positive results. On average, a sample with 50 million 2×100 bp reads requires 96–144 core hours (12–18 node hours) on a 32 GB memory machine and ∼40 GB of scratch space during each run. We have identified numerous fusions from various cancer sequencing projects. In one study, we identified a recurrent fusion with potential clinical significance in our bladder cohort. To establish the frequency of this fusion, we ran fusion identification analyses on 138 bladder cancer transcriptomes from the TCGA. This analysis took ∼20 000 core hours spanning 2 days on Bionimbus and a temporary scratch space of 7 TB.
We have also identified fusion genes from whole-genome sequencing using an intersection of calls from three structural variation discovery methods: CREST,29 BreakDancer30 and GASVPro.31 In order to establish the validation rate of our RNA-sequencing fusion discovery pipeline (manuscript in preparation), we downloaded 50 pairs of tumor/normal breast cancer genomes that were aligned to hg19 from the TCGA (13 TB) and analyzed them using the three methods. In contrast to other studies that primarily focus on a single method, our objective in using three methods was to maximize specificity. This analysis took 22 500 core hours on Bionimbus and a temporary scratch space of 7 TB.
Discussion
Public, private, and community clouds
There is an active discussion today as to whether biomedical and genomics clouds should be private clouds run internally by an organization, community clouds run by a formal or informal consortium of organizations, or public clouds run by commercial cloud service providers (CSPs), such as Amazon, Google and Rackspace.
There are several considerations involved. For smaller clouds, any of the choices can be practical. For larger clouds, such as the petabyte-scale clouds costing millions of dollars that are required for an integrative analysis of TCGA and other similar size datasets, it is probably not affordable for every research center to have its own cloud. For this reason, community or public clouds may provide an attractive alternative.
Some concerns have been raised about using public clouds to house controlled-access genomics data—specifically, (1) the cost, (2) the security infrastructure, and (3) the wisdom in providing all of one's research data to a company that might be acquired in the future or may decide to exit the business of cloud computing.
With respect to the cost, one important difference is that from a researcher's perspective using public clouds to analyze petabyte-scale datasets requires no capital costs, but relatively high operating costs, while private or community clouds have relatively high capital costs but relatively low operating costs. For example, with the proper infrastructure automation, a six-person OSDC technical staff can manage about 20–50 racks. The incremental cost of providing 1 PB of storage for the OSDC for the year 2013 is about $280 000 (combined capital and operating expenses), while the cost to a researcher of 1 PB of storage at AWS is about $816 000 (all operating expenses) (figure 4).
Figure 4.
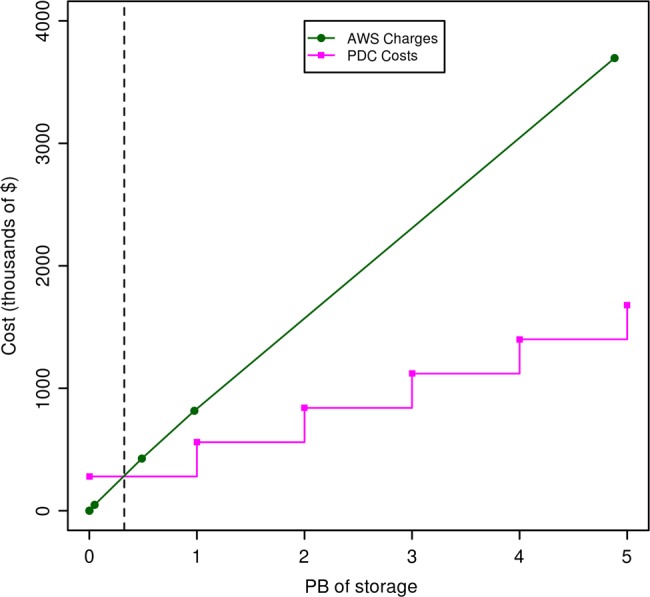
This figure compares the charges for Amazon Web Services (AWS) S3 storage, with the costs incurred as the Open Science Data Cloud (OSDC) adds 1 PB of storage. The AWS costs were computed using the Simple Monthly Calculator on the AWS web site (/calculator.s3.amazonaws.com/calc5.html) and does not include the cost of accessing the data. We used a simple cost model for the OSDC that includes the capital charges for equipment amortized over 3 years, the operating costs of supplying power, space and cooling, and the operating costs of the staff required to manage the OSDC. This cost model assumes that we are operating a minimum of 20 racks and that we refresh one-third of the racks each year.
We compute the incremental cost as follows: currently, we are buying racks of storage infrastructure costing about $210 000 that contain 9 4-U units, with each 4-U unit containing 36 4 TB disks (3.8 TB of usable storage), which provides about 1231 TB per rack. We amortize these units over 3 years, so that the yearly cost that we capitalize is about $70 000. The cost of the power, space, and cooling required to operate the rack is about $25 000. The yearly cost of six staff amortized over 20 racks is about $20 000 per rack. The total cost to provide a rack of storage infrastructure is therefore $115 000 ($70 000+$20 000+$25 000) per year. We use OpenStack's Swift with 3× replication as one of our storage options and the cost per PB is therefore about $280 000=$115 000/(1231/3). It is important to note that this is an incremental cost for 1 PB of storage, assuming that we are operating about 20 racks or more. The cost for 1 B of AWS storage is computed using the AWS cost estimator (calculator.s3.amazonaws.com/calc5.html). This cost does not include the cost of accessing the data on AWS or of moving the data out of AWS.
Today, satisfying certain required security and compliance policies is easier at a private or community cloud, since the implementation of these policies is completely under the control of those operating the cloud. Owing to economies of scale, however, the security itself would, in general, be better at large, well-managed public clouds. Complicating the matter though is that the larger a public cloud becomes, the more attractive a target it can be.
Interoperability with other clouds, exporting data
A high priority for many of the Bionimbus users is the ability to move their data and applications to other clouds. This is one of the reasons that we support UDR, which as noted above, can replicate datasets that are tens to hundreds of TB. For other clouds that are connected via high-performance research networks, such as Internet2, UDR provides a practical solution for exporting data from the OSDC and importing into another cloud (UDR is open source and can be installed easily on the target cloud). In addition, virtual machines from the OSDC can be used on other OpenStack-based clouds, and, with some modification, on Amazon. To further improve interoperability, we have recently extended the OSDC so that AWS images can be launched from the Bionimbus Tukey portal.
Organizational structure
Because of the concerns described above when researchers have to rely exclusively on commercial CSPs, we have set up a not-for-profit system called the Open Cloud Consortium (OCC) (http://www.opencloudconsortium.org). Activity within the OCC is organized by working groups, which have a governance structure broadly similar to that used by the World Wide Web Consortium (W3C) working groups. One of the OCC working groups is the OSDC working group.11 Bionimbus is part of the OSDC.
Governance
Governance is provided for the Bionimbus in general through the OCC's governance structure. For controlled-access data, the Bionimbus PDC is operated by the University of Chicago with support from the OCC, and governance is provided by the University of Chicago's Biological Sciences Division Research Informatics Governance Committee.
Sustainability
The OSDC and Bionimbus are designed so that projects can join and the OSDC acts as a cloud service provider, passing its costs to the project. Owing to the economy of scale and efficiency that the OSDC can operate, its costs are almost always lower than costs would be for an organization to set up and operate its own private cloud, and its services are usually better than the services it could provide.
To reduce our costs and to improve our services, the Bionimbus and other OSDC projects also apply for federal grants and receive charitable contributions.
The goal of the OSDC is to have about the same capital expense each year. With the decreasing cost of storage and processors, this means that the actual storage and computing power of the OSDC doubles every 14–20 months. In exchange for a project paying for an additional year or two of storage, the OSDC offers a guarantee that it will keep its data for the lifetime of the project. Concerned projects can export the data to another cloud at any time, as described above.
Conclusion
We have described the architecture and some typical use cases of the cloud-based Bionimbus system, which is designed for managing, analyzing, and sharing large genomics datasets in a secure and compliant fashion. Bionimbus is part of a larger science cloud called the OSDC.
Most members of the research community have difficulty downloading large genomics datasets and obtaining sufficient storage and compute resources to manage and analyze the data. Cloud computing platforms with data commons that contain large genomics datasets are one choice for broadening access so that more researchers can analyze the large genomics datasets that are being produced. Bionimbus simplifies access to users who would otherwise have to set up and manage their own storage and computing infrastructure.
Footnotes
Contributors: APH, MG, RP, JS, RS, DH, KPW, and RLG developed Bionimbus. CB and MEM used Bionimbus for their research.
Funding: The Bionimbus Protected Data Cloud is supported in by part by the US National Institutes of Health (NIH/SAIC contract 13XS021/HHSN261200800001E and NIMH/NIH P50MH094267). The Open Science Data Cloud is supported in part by the Gordon and Betty Moore Foundation and by the National Science Foundation (NSF OISE—1129076). The Bionimbus Community Cloud was supported in part by the US National Institutes of Health (NIGMS/NIH P50GM081892-03A1). The development of UDR is supported in part by the National Science Foundation (NSF CISE 1127316).
Competing interests: None.
Provenance and peer review: Not commissioned; externally peer reviewed.
References
- 1.Mardis ER. The $1,000 genome, the $100,000 analysis? Genome Med 2010;2:84. [DOI] [PMC free article] [PubMed] [Google Scholar]
- 2.Stein LD. The case for cloud computing in genome informatics. Genome Biol 2010;11:207. [DOI] [PMC free article] [PubMed] [Google Scholar]
- 3.Greenbaum D, Gerstein M. The role of cloud computing in managing the deluge of potentially private genetic data. Am J Bioeth 2011;11:39–41 [DOI] [PubMed] [Google Scholar]
- 4.Grossman RL, White KP. A vision for a biomedical cloud. J Intern Med 2012; 271:122–30 [DOI] [PMC free article] [PubMed] [Google Scholar]
- 5.Wall DP, Kudtarkar P, Fusaro VA, et al. Cloud computing for comparative genomics. BMC Bioinformatics 2010;11:259. [DOI] [PMC free article] [PubMed] [Google Scholar]
- 6.Mell P, Grance T. The NIST Definition of Cloud Computing (draft): recommendations of the National Institute of Standards and Technology: National Institute of Standards and Technology. 2011
- 7.Grossman RL. The case for cloud computing. IT Professional 2009;11:23–7 [Google Scholar]
- 8.Friend SH, Norman TC. Metcalfe's law and the biology information commons. Nat Biotechnol 2013;31:297–303 [DOI] [PubMed] [Google Scholar]
- 9.Chin L, Hahn WC, Getz G, et al. Making sense of cancer genomic data. Genes Dev 2011;25:534–55 [DOI] [PMC free article] [PubMed] [Google Scholar]
- 10.1000 Genomes Project Consortium, Abecasis GR, Altshuler D, et al. A map of human genome variation from population-scale sequencing. Nature 2010;467:1061–73 [DOI] [PMC free article] [PubMed] [Google Scholar]
- 11.Grossman RL, Gu Y, Mambretti J, et al. An overview of the Open Science Data Cloud. Proceedings of the 19th ACM International Symposium on High Performance Distributed Computing. Chicago, Illinois: ACM, 2010 [Google Scholar]
- 12.Gu Y, Grossman RL. UDT: UDP-based data transfer for high-speed wide area networks. Computer Networks 2007;51:1777–99 [Google Scholar]
- 13. doi: 10.1038/nature11247. The ENCODE Project Consortium. An integrated encyclopedia of DNA elements in the human genome. Nature 2012;489:57–74. [DOI] [PMC free article] [PubMed] [Google Scholar]
- 14.McNerney ME, Brown CD, Wang X, et al. CUX1 is a haploinsufficient tumor suppressor gene on chromosome 7 frequently inactivated in acute myeloid leukemia. Blood 2013;121:975–83 [DOI] [PMC free article] [PubMed] [Google Scholar]
- 15.Trapnell C, Pachter L, Salzberg SL. TopHat: discovering splice junctions with RNA-Seq. Bioinformatics 2009;25:1105–11 [DOI] [PMC free article] [PubMed] [Google Scholar]
- 16.Li H, Durbin R. Fast and accurate short read alignment with Burrows-Wheeler transform. Bioinformatics 2009;25:1754–60 [DOI] [PMC free article] [PubMed] [Google Scholar]
- 17.Li H, Handsaker B, Wysoker A, et al. The sequence alignment/map format and SAMtools. Bioinformatics 2009;25:2078–9 [DOI] [PMC free article] [PubMed] [Google Scholar]
- 18.McKenna A, Hanna M, Banks E, et al. The Genome Analysis Toolkit: a MapReduce framework for analyzing next-generation DNA sequencing data. Genome Res 2010;20:1297–303 [DOI] [PMC free article] [PubMed] [Google Scholar]
- 19.Koboldt DC, Zhang Q, Larson DE, et al. VarScan 2: somatic mutation and copy number alteration discovery in cancer by exome sequencing. Genome Res 2012;22:568–76 [DOI] [PMC free article] [PubMed] [Google Scholar]
- 20.Cibulskis K, Lawrence MS, Carter SL, et al. Sensitive detection of somatic point mutations in impure and heterogeneous cancer samples. Nat Biotechnol 2013;31:213–19 [DOI] [PMC free article] [PubMed] [Google Scholar]
- 21.Sherry ST, Ward MH, Kholodov M, et al. dbSNP: the NCBI database of genetic variation. Nucleic Acids Res 2001;29:308–11 [DOI] [PMC free article] [PubMed] [Google Scholar]
- 22.Forbes SA, Bindal N, Bamford S, et al. COSMIC: mining complete cancer genomes in the Catalogue of Somatic Mutations in Cancer. Nucleic Acids Res 2011;39(Database issue):D945–50 [DOI] [PMC free article] [PubMed] [Google Scholar]
- 23.Cooper GM, Stone EA, Asimenos G, et al. Distribution and intensity of constraint in mammalian genomic sequence. Genome Res 2005;15:901–13 [DOI] [PMC free article] [PubMed] [Google Scholar]
- 24.Trapnell C, Williams BA, Pertea G, et al. Transcript assembly and quantification by RNA-Seq reveals unannotated transcripts and isoform switching during cell differentiation. Nat Biotechnol 2010;28:511–15 [DOI] [PMC free article] [PubMed] [Google Scholar]
- 25.Rowley JD. Letter: a new consistent chromosomal abnormality in chronic myelogenous leukaemia identified by quinacrine fluorescence and Giemsa staining. Nature 1973;243:290–3 [DOI] [PubMed] [Google Scholar]
- 26.Maher CA, Kumar-Sinha C, Cao X, et al. Transcriptome sequencing to detect gene fusions in cancer. Nature 2009;458:97–101 [DOI] [PMC free article] [PubMed] [Google Scholar]
- 27.Cancer Genome Atlas Network. Comprehensive molecular portraits of human breast tumours. Nature 2012;490:61–70 [DOI] [PMC free article] [PubMed] [Google Scholar]
- 28.Cancer Genome Atlas Research Network. Integrated genomic analyses of ovarian carcinoma. Nature 2011;474:609–15 [DOI] [PMC free article] [PubMed] [Google Scholar]
- 29.Wang J, Mullighan CG, Easton J, et al. CREST maps somatic structural variation in cancer genomes with base-pair resolution. Nat Methods 2011;8:652–4 [DOI] [PMC free article] [PubMed] [Google Scholar]
- 30.Chen K, Wallis JW, McLellan MD, et al. BreakDancer: an algorithm for high-resolution mapping of genomic structural variation. Nat Methods 2009;6:677–81 [DOI] [PMC free article] [PubMed] [Google Scholar]
- 31.Sindi SS, Onal S, Peng LC, et al. An integrative probabilistic model for identification of structural variation in sequencing data. Genome Biol 2012;13:R22. [DOI] [PMC free article] [PubMed] [Google Scholar]