

Abstract
Background. The phase III Zostavax Efficacy and Safety Trial of 1 dose of licensed zoster vaccine (ZV; Zostavax; Merck) in 50–59-year-olds showed approximately 70% vaccine efficacy (VE) to reduce the incidence of herpes zoster (HZ). An objective of the trial was to assess immune response biomarkers measuring antibodies to varicella zoster virus (VZV) by glycoprotein-based enzyme-linked immunosorbent assay as correlates of protection (CoPs) against HZ.
Methods. The principal stratification vaccine efficacy curve framework for statistically evaluating immune response biomarkers as CoPs was applied. The VE curve describes how VE against the clinical end point (HZ) varies across participant subgroups defined by biomarker readout measuring vaccine-induced immune response. The VE curve was estimated using several subgroup definitions.
Results. The fold rise in VZV antibody titers from the time before immunization to 6 weeks after immunization was an excellent CoP, with VE increasing sharply with fold rise: VE was estimated at 0% for the subgroup with no rise and at 90% for the subgroup with 5.26-fold rise. In contrast, VZV antibody titers measured 6 weeks after immunization did not predict VE, with similar estimated VEs across titer subgroups.
Conclusions. The analysis illustrates the value of the VE curve framework for assessing immune response biomarkers as CoPs in vaccine efficacy trials.
Clinical Trials Registration. NCT00534248.
Keywords: causal inference, correlate of immunity, immune correlate of protection, principal stratification, signature of protection, statistical analysis, surrogate endpoint, vaccine efficacy trial
(See the editorial commentary by Wittes on pages 1523–5.)
Herpes zoster (HZ), caused by reactivation of latent varicella zoster virus (VZV) [1], entails rash and pain that decreases daily functioning and health-related quality of life, more so with increasing age [1–10]. The phase III Shingles Prevention Study (SPS) showed that the live, attenuated zoster vaccine (ZV; Zostavax, Merck, Whitehouse Station, NJ) had an estimated 51% vaccine efficacy (VE; 95% confidence interval [CI], 44%–58%) to reduce the incidence of HZ in persons aged ≥60 years [11]. Subsequently, another phase III Zostavax Efficacy and Safety Trial (ZEST) was conducted to assess the VE of ZV in persons aged 50–59 years and showed an estimated 70% VE (95% CI, 54%–81%) [12]. Secondary analyses of the SPS suggested that 3 different measures of VZV-specific immunity were correlated with protection from HZ: responder cell frequency–determined cell-mediated immunity (CMI), interferon γ (IFN-γ) enzyme-linked immunosorbent spot–determined CMI, and glycoprotein-based enzyme-linked immunosorbent assay (gpELISA)–determined antibody level [13]. Because the gpELISA is easier to use and more validated as a reproducible quantitative assay and because the combination of titers and fold rise appeared to best correlate with protection in the SPS [14], the ZEST included an objective to assess VZV antibody titers by gpELISA but not by the CMI measures as a correlate of protection (CoP). Both week 6 and fold rise in VZV antibody titers determined by gpELISA were strong inverse correlates of risk (CoRs) of HZ in vaccine recipients [15], where a CoR is defined as an immune biomarker that is associated with the rate of a study end point used to measure VE in a defined population [16]. Here we directly assess whether the identified CoRs are also good CoPs [16]. A CoP may be defined as an immune biomarker measuring a response to vaccination that reliably predicts the level of VE to prevent a clinically meaningful end point.
The literature on approaches for assessing CoPs has used different meanings for the term “CoP,” with no consensus [16–20]. Plotkin and Gilbert [21] advocated for the common use of the definition specified above, which is solely about reliable statistical prediction and is silent about whether the biomarker is also a mechanism of protection. These authors also advocated for annotating CoPs as mCoPs (mechanistic CoPs) or nCoPs (nonmechanistic CoPs) for scenarios in which experiments have determined whether the biomarker is a true mechanism of protection. Validated CoPs benefit vaccine development by serving as reliable surrogate end points for true clinical end points of interest, thereby allowing using surrogate end points in phase I and II trials to provide reliable answers about clinical VE without requiring phase III field trials. Validated CoPs confer many other benefits, as extensively discussed elsewhere [16–20, 22]. Given that reliable prediction of VE is very useful in itself, even as a so-called black box predictor with no associated mechanism, nCoPs and mCoPs are highly beneficial for vaccine development.
The concept of a CoP is the same as a valid surrogate end point in the clinical trials statistical literature. Two major statistical frameworks have been developed for assessing the validity of a surrogate end point based on an efficacy trial, the Prentice framework [16, 23–25] and the principal stratification or VE curve framework [26, 27]. While both are useful for assessing the validity of the candidate gpELISA CoPs, this article focuses on the VE curve framework. This approach directly estimates the VE curve, defined as the VE against the clinical end point for each of a spectrum of participant subgroups defined by their biomarker readout measuring vaccine-induced immune response. The major challenge posed to using this approach is that the vaccine-induced immune response is only measured in subjects assigned to receive the vaccine (it is unknown in subjects assigned to receive placebo). Consequently, its effective application requires availability of a subject characteristic before immunization that predicts the candidate CoP [28]; such a baseline immunogenicity predictor (BIP) allows inclusion of an estimate of the immune response to the vaccine that placebo recipients would have had had they been vaccinated, thereby enabling estimation of the VE curve. This approach can be used for estimating the VE curve for subgroups defined either by levels of the vaccine-induced immune response or by both the levels of this response and the response under assignment to placebo.
Several statistical methods have been developed for estimating the VE curve based on a BIP [27–32]. However, because adequately predictive BIPs have not been available, the methods have not yet been effectively applied. Fortunately, a high-quality BIP is available in the ZEST, and here we report, for the first time, an application of this framework to produce clear results that validate one biomarker as an excellent CoP (fold rise in gpELISA titers) and another biomarker as a poor CoP (week 6 gpELISA titers). By directly assessing how VE varies with participant subgroups defined by gpELISA readouts, this framework provides clearly interpretable results that lend themselves to central applications, such as comparing the utility of different immune response biomarkers as CoPs and estimating seroprotection levels.
METHODS
Study Design
The ZEST design, including study population, vaccine intervention, follow-up, HZ end point determination, and efficacy and safety evaluation, is described in the article by Schmader et al [12]. Briefly, 22 439 North American and European subjects aged 50–59 years with a history of varicella or residence in a VZV-endemic area for at least 30 years were randomly assigned to receive a single dose of ZV or placebo in a 1 to 1 allocation. Suspected HZ cases (determined by subject-initiated contact of their study site and by monthly contact by interactive voice response system) were defined as “confirmed HZ” if VZV DNA was detected by polymerase chain reaction analysis of a skin lesion specimen or, for missing or inadequate specimens, by judgment of a clinical evaluation committee. Subjects were followed for ≥1 year until at least 96 confirmed HZ cases (ie, primary end points) occurred. VE was assessed with an intention-to-treat (ITT) analysis, counting all confirmed HZ cases, and with a modified ITT analysis, which excludes HZ cases occurring within 30 days of vaccination.
Measurement of Anti-VZV Antibodies
A case-cohort design [33] was used to assess CoPs, in which VZV-specific antibody responses were measured at Merck Research Laboratories in 10% of study participants selected prior to study initiation via simple random sampling and in all cases (subjects who experienced HZ after the week 6 visit). These antibody responses were measured using gpELISA on day 1 (before immunization) and week 6 (after immunization).
The gpELISA for VZV-specific immunoglobulin G antibody was performed at PPD Vaccines and Biologics (Wayne, PA) [13], and the gpELISA readout was defined as described by Levin et al [14], with a cutoff 1.25 gpELISA U/mL for VZV seropositivity. The assays were performed blinded to treatment assignment and HZ case status.
Statistical Analyses
Predictors of Antibody Response and HZ
Vaccination status, age, sex, and baseline antibody response were assessed as predictors of week 6 antibody response, using multivariable linear regression with inverse probability weighting to account for the subsampling of immune responses. These same variables were assessed as prognostic factors for HZ, using weighted multivariable Cox regression.
Assessment of Candidate CoPs
Two gpELISA-derived biomarkers were evaluated as CoPs, the week 6 titers and the fold rise, where the week 6 titers are the log10 value of gpELISA antibody titers at week 6 and the fold rise is the fold increase in titers from baseline to week 6. Negative values of the log10 fold rise were assumed to reflect assay variability rather than a true biological decrease in antibody response and were therefore set to 0; <10% of vaccine recipients had negative values, and these tended to be close to 0 (suggesting no biological change). A valid immunological CoP is defined as an immune response biomarker that reliably predicts VE to prevent HZ, where reliable prediction means that the VE is 0 for subgroups with no vaccine-induced biomarker response and varies widely across subgroups defined by the level of response [21, 34].
Four statistical methods were used to evaluate the candidate CoPs: method A, the parametric method of Gilbert and Hudgens [27], which assumes the risk of HZ conditional on the candidate CoP treated as a quantitative variable, follows a probit model in each of the vaccine and placebo groups; method B, the parametric method of Gabriel and Gilbert [35], which assumes the time from week 6 to HZ conditional on the quantitative candidate CoP, follows a Weibull model in each treatment group; method C, the nonparametric method of Gilbert and Hudgens [27], which assesses the VE for each of 3 subgroups, defined by the lower third, middle third, and upper third of vaccine recipient response levels of the candidate CoP; and method D, the Cox model method of Miao et al [32], which uses Bayesian multiple imputation [36] and assumes proportional hazard rates of HZ in the vaccine and placebo groups within each of 3 participant subgroups defined below. Methods B and D account for the time of HZ, whereas methods A and C do not. For the 2.8% of participants lost to follow-up after 6 weeks, the former methods censor the HZ failure time at the date of last contact, whereas the latter methods count lost participants as non-HZ cases. Because a small number of lost participants likely experienced HZ, the time-to-event methods are more fully justified.
Whereas methods A−C define subgroups on the basis of the vaccine-induced response only, method D defines subgroups on the basis of a subject's set of 4 potential outcomes of antibody response, for week 6 titer and fold rise, each under both treatment assignments [32]. For method D, each immune response is dichotomized as low or high on the basis of a previous threshold analysis [32], with a high week 6 titer defined by >116.7 gpELISA U and a high fold rise defined by fold rise of >1.44. These cutoffs were selected to maximize the partial likelihood function and the goodness of fit of the threshold model. The no response subgroup contains subjects with the same response category under both treatment assignments for week 6 titers and fold rise; the partial response subgroup has the same response category under both treatment assignments for week 6 titers but a high fold rise under vaccine assignment and a low fold rise under placebo assignment; and the high-response subgroup has high week 6 titers and fold rise under vaccine assignment but low values for both markers under placebo assignment. For a good CoP, the VE would be expected to be near 0 for nonresponders, high for high responders, and intermediate for partial responders. For each method, the analysis includes subjects in the ITT cohort who were HZ free at the week 6 visit. The Supplementary Materials provide additional details about the statistical methods. All CoP analyses used baseline titers as the BIP.
RESULTS
VE Results and VE Curve Results
The primary ZEST results are described by Schmader et al [12], with an estimated VE of 70% (95% CI, 54%–81%) based on 129 confirmed HZ cases and an average of 1.3 years of postvaccination monitoring for HZ in the ITT analysis. The study completion rate was 94%, with 3.1% prematurely discontinuing study participants (311 vaccine and 309 placebo recipients). Sex did not significantly modify the VE (interaction test P > .20).
Antibody Responses and Predictors of Antibody Response
The immunogenicity analysis presented here included all subjects with available serology measurements except for the 13 subjects (5 vaccine and 8 placebo recipients) who developed a confirmed case of HZ prior to the week 6 titer measurement. All subjects with enough serum for gpELISA testing (1218 in the vaccine group and 1273 in the placebo group) were seropositive for VZV antibody at baseline. Figure 1 shows that the vaccine and placebo groups had similar titer distributions at baseline and considerable overlap in distributions at week 6. Antibody responses clearly increased from baseline to week 6 in vaccine recipients but not in placebo recipients. Figure 2 shows that baseline titers were positively correlated with week 6 titers in vaccine recipients, with a Spearman rank correlation of 0.67, and were slightly less and negatively correlated with fold rise, with a Spearman rank correlation of −0.58. Table 1 shows the geometric mean values of baseline, week 6, and fold rise of gpELISA titers. The geometric mean of the fold rise was 2.31 (95% CI, 2.20–2.43) for the vaccine group and 1.00 (95% CI, .98–1.03) for the placebo group. The baseline, week 6, and fold rise of gpELISA titers were similar in women and men (Mann–Whitney P > .20), which was also found by Levin et al [15].
Figure 1.
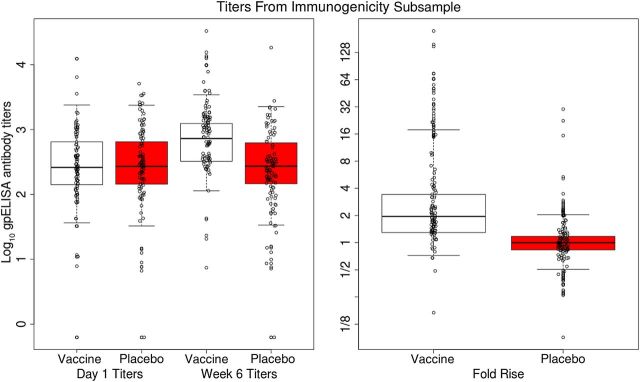
For vaccine and placebo recipients in the immunological substudy, the left 2 box plots depict the log10 baseline titers by treatment arm, the middle 2 box plots depict the log10 week 6 titers by treatment arm, and the right 2 box plots depict the log10 fold rise from baseline to week 6 by treatment arm, with the y-axis denoting the multiplicative fold rise scale. The edges of the boxes are 25th and 75th percentiles, the horizontal lines inside the boxes are medians, and the vertical whiskers represent the 2.5th and 97.5th percentiles. Data points are shown for random samples of 100 participants. gpELISA, glycoprotein-based enzyme-linked immunosorbent assay.
Figure 2.

For vaccine recipients in the immunological substudy, the left panel depicts the correlation between the log10 fold rise in titers from baseline to week 6 and the log10 baseline titers (with the y-axis denoting the multiplicative fold rise scale). The right panel depicts the association between log10 week 6 titers and log10 baseline titers.
Table 1.
Glycoprotein-Based Enzyme-Linked Immunosorbent Assay (gpELISA) Responses at Baseline and Week 6 and Fold Rise From Baseline to Week 6, by Trial Arm
| Trial Arm | Subgroup | gpELISA Data at Baseline, No. | Baseline GMT (95% CI) | gpELISA Data at Week 6, No. | Week 6 GMT (95% CI) | gpELISA Data at Baseline and Week 6, No. | Fold Rise in GMTa (95% CI) |
|---|---|---|---|---|---|---|---|
| Vaccine | Overall | 1218 | 284 (267–303) | 1179 | 662 (627–698) | 1177 | 2.31 (2.20–2.43) |
| Placebo | Overall | 1273 | 291 (273–310) | 1230 | 292 (275–311) | 1228 | 1.00 (.98–1.03) |
| Vaccine | Women | 765 | 290 (266–315) | 740 | 657 (614–704) | 738 | 2.25 (2.11–2.38) |
| Placebo | Women | 808 | 287 (266–310) | 780 | 289 (268–313) | 779 | 1.01 (.98–1.04) |
| Vaccine | Men | 453 | 276 (251–303) | 439 | 669 (614–728) | 439 | 2.42 (2.23–2.63) |
| Placebo | Men | 465 | 297 (267–330) | 450 | 298 (268–331) | 449 | 1.00 (.97–1.04) |
Abbreviations: CI, confidence interval; GMT, geometric mean titer.
aCalculated as week 6 titer minus baseline titer.
Predictors of HZ
Multivariable Cox models including age, sex, and baseline gpELISA titer were fit for the vaccine and placebo groups separately to explore predictors of HZ. Age (50–54 years vs 55–59 years) did not significantly predict HZ in either group (P > .10). Women were at significantly higher risk of HZ than men in the placebo group (estimated hazard ratio [HR], 2.08; P = .002) but not in the vaccine group (P = .85). Baseline titers were strongly inversely correlated with HZ in the placebo group (HR, 0.44 per unit increase [95% CI, .31–.63]; P < .001) but not in the vaccine group (P = .71). Based on these results and because age was an important covariate in other clinical trials of the zoster vaccine, the VE curves were estimated both with and without adjustment for age, sex, and baseline titer, as reported below.
Results on the VE Curve
Fold Rise in Titers
Figure 3 shows the estimated VE curves for the fold rise candidate CoP, using methods A, B, and C. The Weibull-based analysis (method B) showed no evidence that VE curves varied with time (P = .65); therefore, we used a proportional hazards version of the Weibull model. The estimated VE curves for fold rise as a quantitative variable support the conclusion that fold rise is an excellent CoP, with VEs ranging from approximately 0 for vaccine recipients with no rise in gpELISA response from baseline to VEs near 100% for vaccine recipients with the greatest rise from baseline (P < .001 for variation in the VE curve via methods A and B). The estimated VE curve ranging over the tertile response subgroups defined for method C supports these same conclusions (P < .001 for variation in VE curves), with an estimated VE near 0 and 95% CI overlapping 0% for the lowest tertile subgroup and an estimated VE of 84% for the middle and upper tertile subgroups. The analysis using method A, when repeated after adjustment for baseline titers, age, and sex, yielded similar results (Supplementary Figure 1).
Figure 3.

A and B, Estimated vaccine efficacy curves across levels of vaccine-induced fold rise in titers from baseline to week 6, using the probit estimated likelihood method [27] and the Weibull estimated likelihood method [35], respectively, with 95% bootstrap confidence intervals. The lower x-axis indicates the multiplicative fold rise in titers. C, Estimated VEs with 95% bootstrap confidence intervals for subgroups defined by the lower, middle, and upper tertiles of vaccine-induced fold rise in titers, using the nonparametric estimated likelihood method [27].
For method D, Figure 4 shows that the VE curve sharply increased over the no response, partial response, and high response subgroups, with estimated VEs of 36%, 83%, and 96%, respectively. Thus, the subgroup with greatest VE has a combination of a high week 6 titer and a high fold rise.
Figure 4.

Estimated vaccine efficacies (VEs) for the no response, partial response, and high response subgroups described in Methods, using the Cox model with multiple imputation method [32].
Week 6 Titers
Figure 5 shows the parallel results for assessing week 6 titers as a CoP. Again the Weibull model showed no evidence for time-varying VE curves (P = .35); therefore the proportional hazards Weibull model was used. The estimated VE curves varied only slightly over the range of titers, with no statistical evidence of variability (P= 0.91 and P=.55 for variation in VE curves for methods A and B, respectively), supporting that week 6 titers are a less effective (or ineffective) CoP, compared with fold rise. The results for tertile response subgroups also support this finding (P= 0.82 for variation in VEs for method C). This lack of prediction of the VE occurs despite the fact that week 6 titers were strongly associated with HZ in placebo recipients (P = .001). An analysis comparing the ability of the 2 candidate CoPs to predict VE suggests that fold rise is a superior CoP, based on the standardized total gain measure (P = .0056) [37]. The analysis using method A, when repeated after adjustment for baseline titers, age, and sex, again yielded similar results (Supplementary Figure 2).
Figure 5.

A and B, Estimated vaccine efficacy curves across levels of vaccine-induced log10 week 6 titers, using the probit estimated likelihood method [27] and the Weibull estimated likelihood method [35], respectively, with 95% bootstrap confidence intervals. The lower x-axis indicates the multiplicative fold rise in titers. C, Estimated VEs with 95% bootstrap confidence intervals for subgroups defined by the lower, middle, and upper tertiles of vaccine-induced week 6 titers, using the nonparametric estimated likelihood method [27] (the lower confidence limit for the middle tertile is −224%).
Given the correlation between baseline and week 6 titers, we assessed whether baseline titers predicted VE via methods A, B, and C. The VE curves for baseline titers did not significantly vary (P > .20; Figure 6).
Figure 6.

A and B, Estimated vaccine efficacy curves across levels of log10 baseline titers, using the probit estimated likelihood method [27] and the Weibull estimated likelihood method [35], respectively, with 95% bootstrap confidence intervals. The lower x-axis indicates the multiplicative fold rise in titers. C, Estimated VEs with 95% bootstrap confidence intervals for subgroups defined by the lower, middle, and upper tertiles of baseline titers, using the nonparametric estimated likelihood method [27].
DISCUSSION
We addressed the objective of ZEST to assess gpELISA antibody titer measurements as correlates of protection against HZ in recipients of ZV. The analysis of VE curves showed that subgroups of ZV recipients with substantial fold rises in gpELISA antibody levels had high levels of VE against HZ, whereas subgroups with absent or minimal fold rises had at most minimal VE. In contrast, the analysis showed that week 6 titers alone (irrespective of baseline titer) did not predict VE well, despite its strong inverse relationship with the risk of HZ. Therefore, the fold rise in gpELISA antibody titers can be used as a correlate of protection against HZ for ZV in the trial population of the ZEST, suggesting that additional field trials of ZV in the ZEST population are not needed, whereas week 6 titers have little utility as a correlate of protection in this population. These results suggest that for the ZEST the quantification of additional antibody response boosted by vaccination above and beyond preexisting levels constitutes a more useful concept for predicting VE than quantification of the absolute level of antibodies after vaccination. On the basis of the current models, we were unable to find a univariate combination of week 6 titers and fold rise that was more predictive of VE than fold rise alone; future research is needed to assess whether a bivariate combination could potentially be more predictive.
The estimated VE curves were similar for women and men, and VZV antibody levels were not affected by sex or age. Moreover, the VE curves were similar after adjustment for age, sex, and baseline gpELISA titers, suggesting that the correlate of protection for ZV may apply for other healthy populations not studied in the ZEST. However, the results provide no direct evidence for the hypothesis that fold rise would be a reliable a predictor of VE in older populations who receive ZV. In addition, the identified CoP could be specific to ZV, which contains the entire Oka strain virus, and thus this finding may not be generalizable to other HZ vaccines made from different formulations in the future.
The analysis presented here illustrates that the estimated VE curve provides a simple and useful interpretation of the value of an immune response as a CoP by directly reporting the VEs for subgroups defined by vaccine-induced immune responses. In particular, the curves provide information on the degree of VE conferred for a range of immune response thresholds. For example, on the basis of Figure 3B, a fold rise from baseline of at least 2.39, 5.26, and 8.67 corresponds to estimated VEs of 70%, 90%, and 95%, respectively.
The assumptions of the VE curve methods are described in the methodological publications [25, 32, 35]. Key assumptions are (1) there is no VE before the immune responses are measured, or very few participants experience the disease end point before the immune responses are measured; and (2) the risk or incidence of the disease end point conditional on immune response and other covariates follows a regression model such as probit, Weibull, or Cox proportional hazards. Assumption 1 approximately attains for the ZEST, given that only 13 (5 in the vaccine group and 8 in the placebo group) of the 22 439 trial participants experienced HZ before week 6. Goodness-of-fit diagnostic findings supported assumption 2 as well, although an important caveat is that the methods assume that the VE depends on baseline and fold rise of gpELISA titers in a way that does not allow an interaction of these 2 variables; this assumption cannot be tested from the available data and hence should be borne in mind as a qualifying limitation of the methods.
Levin et al [14] posited that CMI responses, not antibodies, are the mechanism of protection against HZ, based on the observation that the former responses track with age and age-associated VE [11, 38, 39] whereas the latter do not. Importantly, the results presented here do not provide evidence for or against this inference, as VE curve methods have sole scope to assess directly the ability of an immune response to statistically predict VE in a reliable fashion but do not provide a direct assessment of protective mechanisms. In fact, as stated in Plotkin and Gilbert [21] and consistent with Levin et al [14] and Weinberg et al [40], we conjecture that the fold rise in gpELISA antibody titers is a nonmechanistic correlate of protection, exemplifying an immune response biomarker that provides value to vaccine development despite not being a true mechanism of protection; see the article by Borrow et al [41] for another example. The results suggest that, compared with week 6 antibody titers, the fold rise in antibody titers, as measured by gpELISA, is more strongly associated with whatever immune responses are true mechanisms of protection.
Given the previous results in the SPS suggesting that VZV CMI measured by IFN-γ enzyme-linked immunosorbent spot and responder cell frequency assays were also correlates of protection against HZ [14], it is possible that these CMI readouts would have been discovered to be equally strong CoPs, with steep VE curves, had they been evaluated in the ZEST. Given the apparent independence of the CMI and antibody responses [14], an open question of interest is whether a more predictive CoP could be derived on the basis of a combination of CMI and antibody responses.
Supplementary Data
Supplementary materials are available at The Journal of Infectious Diseases online (http://jid.oxfordjournals.org). Supplementary materials consist of data provided by the author that are published to benefit the reader. The posted materials are not copyedited. The contents of all supplementary data are the sole responsibility of the authors. Questions or messages regarding errors should be addressed to the author.
Notes
Acknowledgments. We thank all the volunteers who participated in the ZEST study, and the ZEST protocol 022 study groups.
Disclaimer. The content is solely the responsibility of the authors and does not necessarily represent the official views of the National Institutes of Health.
Financial support. This work was supported by the National Institute of Allergy and Infectious Diseases, National Institutes of Health (grant 2 R37 AI054165-11 to P. B. G. and grant R37-AI032042 to E. E. G.).
Potential conflicts of interest. S.-C. S., J. P., and I. S. F. C. are employees of Merck, which owns the Zostavax vaccine. All other authors report no potential conflicts.
All authors have submitted the ICMJE Form for Disclosure of Potential Conflicts of Interest. Conflicts that the editors consider relevant to the content of the manuscript have been disclosed.
References
- 1.Gnann JW, Jr, Whitley RJ. Clinical practice. Herpes zoster. N Engl J Med. 2002;347:340–6. doi: 10.1056/NEJMcp013211. [DOI] [PubMed] [Google Scholar]
- 2.Katz J, Cooper EM, Walther RR, Sweeney EW, Dworkin RH. Acute pain in herpes zoster and its impact on health-related quality of life. Clin Infect Dis. 2004;39:342–8. doi: 10.1086/421942. [DOI] [PubMed] [Google Scholar]
- 3.Schmader KE, Sloane R, Pieper C, et al. The impact of acute herpes zoster pain and discomfort on functional status and quality of life in older adults. Clin J Pain. 2007;23:490–6. doi: 10.1097/AJP.0b013e318065b6c9. [DOI] [PubMed] [Google Scholar]
- 4.Johnson RW, Bouhassira D, Kassianos G, Leplege A, Schmader KE, Weinke T. The impact of herpes zoster and post-herpetic neuralgia on quality-of-life. BMC Med. 2010;8:37. doi: 10.1186/1741-7015-8-37. [DOI] [PMC free article] [PubMed] [Google Scholar]
- 5.Hempenstall K, Nurmikko TJ, Johnson RW, A'Hern RP, Rice AS. Analgesic therapy in postherpetic neuralgia: a quantitative systematic review. PLoS Med. 2005;2:e164. doi: 10.1371/journal.pmed.0020164. [DOI] [PMC free article] [PubMed] [Google Scholar]
- 6.Hope-Simpson RE. The nature of herpes zoster: A long-term study and a new hypothesis. Proc R Soc Med. 1965;58:9–20. doi: 10.1177/003591576505800106. [DOI] [PMC free article] [PubMed] [Google Scholar]
- 7.Mullooly JP, Riedlinger K, Chun C, Weinmann S, Houston H. Incidence of herpes zoster, 1997–2002. Epidemiol Infect. 2005;133:245–53. doi: 10.1017/s095026880400281x. [DOI] [PMC free article] [PubMed] [Google Scholar]
- 8.Yawn BP, Saddier P, Wollan PC, St Sauver JL, Kurland MJ, Sy LS. A population-based study of the incidence and complication rates of herpes zoster before zoster vaccine introduction. Mayo Clin Proc. 2007;82:1341–9. doi: 10.4065/82.11.1341. [DOI] [PubMed] [Google Scholar]
- 9.Kost RG, Straus SE. Postherpetic neuralgia--pathogenesis, treatment, and prevention. N Engl J Med. 1996;335:32–42. doi: 10.1056/NEJM199607043350107. [DOI] [PubMed] [Google Scholar]
- 10.Dworkin RH, Johnson RW, Breuer J, et al. Recommendations for the management of herpes zoster. Clin Infect Dis. 2007;44(suppl 1):S1–26. doi: 10.1086/510206. [DOI] [PubMed] [Google Scholar]
- 11.Oxman MN, Levin MJ, Johnson GR, et al. A vaccine to prevent herpes zoster and postherpetic neuralgia in older adults. N Engl J Med. 2005;352:2271–84. doi: 10.1056/NEJMoa051016. [DOI] [PubMed] [Google Scholar]
- 12.Schmader KE, Levin MJ, Gnann JW, Jr, et al. Efficacy, safety, and tolerability of herpes zoster vaccine in persons aged 50–59 years. Clin Infect Dis. 2012;54:922–8. doi: 10.1093/cid/cir970. [DOI] [PMC free article] [PubMed] [Google Scholar]
- 13.Hammond O, Wang Y, Green T, et al. The optimization and validation of the glycoprotein ELISA assay for quantitative varicella-zoster virus (VZV) antibody detection. J Med Virol. 2006;78:1679–87. doi: 10.1002/jmv.20754. [DOI] [PubMed] [Google Scholar]
- 14.Levin MJ, Oxman MN, Zhang JH, et al. Varicella-zoster virus-specific immune responses in elderly recipients of a herpes zoster vaccine. J Infect Dis. 2008;197:825–35. doi: 10.1086/528696. [DOI] [PMC free article] [PubMed] [Google Scholar]
- 15.Levin MJ, Schmader KE, Gnann JW, et al. Varicella-zoster virus-specific antibody responses in 50–59-year-old recipients of zoster vaccine. J Infect Dis. 2013;208:1386–90. doi: 10.1093/infdis/jit342. [DOI] [PMC free article] [PubMed] [Google Scholar]
- 16.Qin L, Gilbert PB, Corey L, McElrath MJ, Self SG. A framework for assessing immunological correlates of protection in vaccine trials. J Infect Dis. 2007;196:1304–12. doi: 10.1086/522428. [DOI] [PubMed] [Google Scholar]
- 17.Plotkin SA. Immunologic correlates of protection induced by vaccination. Pediatr Infect Dis J. 2001;20:63–75. doi: 10.1097/00006454-200101000-00013. [DOI] [PubMed] [Google Scholar]
- 18.Plotkin SA. Vaccines: Correlates of vaccine-induced immunity. Clin Infect Dis. 2008;47:401–9. doi: 10.1086/589862. [DOI] [PubMed] [Google Scholar]
- 19.Plotkin SA. Correlates of protection induced by vaccination. Clin Vaccine Immunol. 2010;17:1055–65. doi: 10.1128/CVI.00131-10. [DOI] [PMC free article] [PubMed] [Google Scholar]
- 20.Clements-Mann ML. Lessons for AIDS vaccine development from non-AIDS vaccines. AIDS Res Hum Retroviruses. 1998;14(suppl 3):S197–203. [PubMed] [Google Scholar]
- 21.Plotkin SA, Gilbert PB. Nomenclature for immune correlates of protection after vaccination. Clin Infect Dis. 2012;54:1615–7. doi: 10.1093/cid/cis238. [DOI] [PMC free article] [PubMed] [Google Scholar]
- 22.Chan ISF, Wang WWB, Heyse J. Vaccine clinical trials. encyclopedia of biopharmaceutical statistics. 3rd ed. New York: Dekker; 2010. [Google Scholar]
- 23.Prentice RL. Surrogate endpoints in clinical trials: definition and operational criteria. Stat Med. 1989;8:431–40. doi: 10.1002/sim.4780080407. [DOI] [PubMed] [Google Scholar]
- 24.Kohberger RC, Jemiolo D, Noriega F. Prediction of pertussis vaccine efficacy using a correlates of protection model. Vaccine. 2008;26:3516–21. doi: 10.1016/j.vaccine.2008.04.016. [DOI] [PubMed] [Google Scholar]
- 25.Gilbert PB, Qin L, Self SG. Evaluating a surrogate endpoint at three levels, with application to vaccine development. Stat Med. 2008;27:4758–78. doi: 10.1002/sim.3122. [DOI] [PMC free article] [PubMed] [Google Scholar]
- 26.Frangakis CE, Rubin DB. Principal stratification in causal inference. Biometrics. 2002;58:21–9. doi: 10.1111/j.0006-341x.2002.00021.x. [DOI] [PMC free article] [PubMed] [Google Scholar]
- 27.Gilbert PB, Hudgens MG. Evaluating candidate principal surrogate endpoints. Biometrics. 2008;64:1146–54. doi: 10.1111/j.1541-0420.2008.01014.x. [DOI] [PMC free article] [PubMed] [Google Scholar]
- 28.Follmann D. Augmented designs to assess immune response in vaccine trials. Biometrics. 2006;62:1161–9. doi: 10.1111/j.1541-0420.2006.00569.x. [DOI] [PMC free article] [PubMed] [Google Scholar]
- 29.Huang Y, Gilbert PB, Wolfson J. Design and estimation for evaluating principal surrogate markers in vaccine trials. Biometrics. 2013;69:301–9. doi: 10.1111/biom.12014. [DOI] [PMC free article] [PubMed] [Google Scholar]
- 30.Qin L, Gilbert PB, Follmann D, Li D. Assessing surrogate endpoints in vaccine trials with case-cohort sampling and the Cox model. Ann Appl Stat. 2008;2:386–407. doi: 10.1214/07-AOAS132. [DOI] [PMC free article] [PubMed] [Google Scholar]
- 31.Wolfson J, Gilbert PB. Statistical identifiability and the surrogate endpoint problem, with application to vaccine trials. Biometrics. 2010;66:1153–61. doi: 10.1111/j.1541-0420.2009.01380.x. [DOI] [PMC free article] [PubMed] [Google Scholar]
- 32.Miao X, Li X, Gilbert PB, Chan ISF. A multiple imputation approach for surrogate marker evaluation in the principal stratification causal inference framework. In: Lee M-L, Mitchell G, Satten G, Cai T, Pfeiffer R, Gandy A, editors. Risk assessment and evaluation of predictions. London: Springer; 2013. [Google Scholar]
- 33.Prentice RL. On the design of synthetic case-control studies. Biometrics. 1986;42:301–10. [PubMed] [Google Scholar]
- 34.Gilbert PB, Hudgens MG, Wolfson J. Commentary on “Principal stratification - a goal or a tool?” by Judea Pearl. Int J Biostat. 2011;7(1) doi: 10.2202/1557-4679.1341. Article 36. [DOI] [PMC free article] [PubMed] [Google Scholar]
- 35.Gabriel EE, Gilbert PB. Evaluating principal surrogate endpoints with time-to-event data accounting for time-varying treatment efficacy. Biostatistics. 2014;15:251–65. doi: 10.1093/biostatistics/kxt055. [DOI] [PMC free article] [PubMed] [Google Scholar]
- 36.Rubin DB. Multiple imputation for nonresponse in surveys. New York: John Wiley; 1987. [Google Scholar]
- 37.Huang Y, Gilbert PB. Comparing biomarkers as principal surrogate endpoints. Biometrics. 2011;67:1442–51. doi: 10.1111/j.1541-0420.2011.01603.x. [DOI] [PMC free article] [PubMed] [Google Scholar]
- 38.Levin MJ, Murray M, Rotbart HA, Zerbe GO, White CJ, Hayward AR. Immune response of elderly individuals to a live attenuated varicella vaccine. J Infect Dis. 1992;166:253–9. doi: 10.1093/infdis/166.2.253. [DOI] [PubMed] [Google Scholar]
- 39.Levin MJ, Smith JG, Kaufhold RM, et al. Decline in varicella-zoster virus (VZV)-specific cell-mediated immunity with increasing age and boosting with a high-dose VZV vaccine. J Infect Dis. 2003;188:1336–44. doi: 10.1086/379048. [DOI] [PubMed] [Google Scholar]
- 40.Weinberg A, Zhang JH, Oxman MN, et al. Varicella-zoster virus-specific immune responses to herpes zoster in elderly participants in a trial of a clinically effective zoster vaccine. J Infect Dis. 2009;200:1068–77. doi: 10.1086/605611. [DOI] [PMC free article] [PubMed] [Google Scholar]
- 41.Borrow R, Balmer P, Miller E. Meningococcal surrogates of protection--serum bactericidal antibody activity. Vaccine. 2005;23:2222–7. doi: 10.1016/j.vaccine.2005.01.051. [DOI] [PubMed] [Google Scholar]
Associated Data
This section collects any data citations, data availability statements, or supplementary materials included in this article.