

Background: The molecular and cellular changes of astrocytes in epileptic cerebral cortex are poorly understood.
Results: In the epileptic cortex, β-dystroglycan is down-regulated in a sustained manner with a concomitant impairment in the integrity of the astrocyte endfeet.
Conclusion: Astrocyte endfeet undergo long lasting changes in the epileptic cortex.
Significance: The pathological changes of astrocyte endfeet could be a new therapeutic target for epilepsy.
Keywords: Astrocyte, Epilepsy, Molecular Cell Biology, Pathogenesis, Protein Degradation, AQP4, Brain Slice, Cerebral Cortex, Endfeet, Dystroglycan
Abstract
Epilepsy is characterized by the abnormal activation of neurons in the cerebral cortex, but the molecular and cellular mechanisms contributing to the development of recurrent seizures are largely unknown. Recently, the critical involvement of astrocytes in the pathophysiology of epilepsy has been proposed. However, the nature of plastic modulations of astrocytic proteins in the epileptic cortex remains poorly understood. In this study, we utilized the zero magnesium in vitro model of epilepsy and examined the potential molecular changes of cortical astrocytes, focusing specifically on endfeet, where specialized biochemical compartments exist. We find that the continuous epileptic activation of neurons for 1 h decreases the expression level of β-dystroglycan (βDG) in acute cortical brain slices prepared from mice. This change is completely abolished by the pharmacological blockade of NMDA-type glutamate receptors as well as by matrix metalloproteinase inhibitors. Consistent with the highly specialized localization of βDG at astrocytic endfeet, where it plays a pivotal role in anchoring endfeet-enriched proteins in astrocytes, the down-regulation of βDG is accompanied by a decrease in the expression of AQP4 but not laminin. Importantly, this down-regulation of βDG persists for at least 1 h, even after the apparent recovery of neuronal activation. Finally, we show that the down-regulation of βDG is associated with the dysfunction of the endfeet at the blood-brain interface as a diffusion barrier. These results suggest that the sustained down-regulation of βDG leads to dysfunctions of astrocytic endfeet in the epileptic cerebral cortex and may contribute to the pathogenesis of epilepsy.
Introduction
Epilepsy is a common disease, affecting nearly 1% of the population. Although currently available pharmaceuticals targeting neuronal excitabilities are effective for suppressing symptoms, other approaches aimed at preventing or restoring molecular and cellular changes in the epileptic tissue are desirable for curing the disease. Recently, astrocytes have been suggested to play important roles in the pathophysiological responses under epileptic conditions (1–3). Therefore, once pathological neuronal activations have been initiated, the interplay between neurons and astrocytes may exacerbate the pathophysiological properties of the brain tissue. As such, astrocytes are promising new targets for the treatment of epilepsy. Meanwhile, our molecular and cellular understanding of the biochemical changes in astrocytes under epileptic conditions lags far behind that of neurons.
Astrocytic endfeet are specialized subcellular structures that tightly and completely cover the blood vessels in the brain (4). Previously, we showed that astrocytic endfeet play critical roles in regulating the diffusion of molecules in the extracellular spaces, thereby contributing to the diffusion barrier functions at the blood-brain interface (5). Importantly, these diffusion barrier functions collapse under the in vitro model of ischemia, in which astrocytes play critical roles in the progression of the pathophysiology (6). Furthermore, recent studies have shown that the diffusion of molecules, especially water, from the perivascular space to the brain parenchyma is regulated by astrocytes under both physiological and pathological conditions (7, 8). What appears to be critical to these functions is the specialized biochemical organization of endfeet, which is characterized by the highly enriched localization of AQP4 (9–11), which is, in turn, critically dependent on the associations of endfeet with the extracellular matrices through βDG3 and other transmembrane molecules (12). Consistently, we found that the diffusion of molecules is restricted in endfeet, compared with other parts, making them a biochemically distinct subcellular compartment (13). In this respect, endfeet may be regarded as the astrocytic counterparts of dendritic spines, which function as biochemical compartments in neurons. Previous studies have revealed that dendritic spines are dynamic in both their morphology and biochemical composition, and these dynamic properties play central roles in the regulations of synapses and, therefore, neuronal network structures under a wide variety of physiological and pathophysiological conditions (14). In sharp contrast, the dynamics of the biochemical components in endfeet under (patho)physiological conditions are poorly understood.
In this study, we utilized the well characterized zero magnesium (0 Mg2+) brain slice model of epilepsy, which induces epileptiform discharges in wide areas of the neocortex (15–17), as a model system to examine the effect of (patho)physiological neuronal activities on the biochemical organizations of endfeet in cortical astrocytes. Here, we report that upon the epileptic activation of neurons, βDG is down-regulated with distinct kinetics from the pathological activation of neurons and with a concurrent dysfunction of the astrocytic endfeet.
EXPERIMENTAL PROCEDURES
Materials
The following primary and secondary antibodies were used: anti-βDG antibody (Abcam, catalog no. ab49515), anti-S100β antibody (Abcam, catalog no. ab52642), anti-phospho-ERK1/2 antibody (Cell Signaling Technology, catalog no. 9106S), anti-NeuN antibody (Abcam, catalog no. ab177487), anti-AQP4 antibody (Sigma-Aldrich, catalog no. A5971), anti-laminin antibody (Sigma-Aldrich, catalog no. L9393), anti-β-actin antibody (Sigma-Aldrich, catalog no. A5316), unconjugated goat anti-mouse IgG (H + L) antibody (Jackson ImmunoResearch, catalog no. 115-007-003), HRP-conjugated anti-rabbit IgG antibody (Jackson ImmunoResearch, catalog no. 111-035-003), HRP-conjugated anti-mouse IgG antibody (GE Healthcare, catalog no. NA931V), Alexa Fluor 488-conjugated anti-mouse IgG antibody (Invitrogen, catalog no. A11001), and Alexa Fluor 555-conjugated anti-rabbit IgG antibody (Invitrogen, catalog no. A21428). All the chemicals used in this study were purchased from Sigma-Aldrich unless stated otherwise.
Brain Slice Preparation
All of the animal experiments were performed according to the Guidelines for the Care and Use of Laboratory Animals of Keio University.
C57BL/6J mice of either sex (postnatal day 14–23, Japan SLC) were anesthetized using isoflurane. After decapitation, the brains were immediately removed and placed in ice-cold cutting solution containing 222 mm sucrose, 27 mm NaHCO3, 2.6 mm KCl, 1.5 mm NaH2PO4, 0.5 mm CaCl2, and 7 mm MgCl2 bubbled with 95% O2, 5% CO2 at pH 7.4. Acute coronal brain slices (300 μm thick) were prepared from the caudal part of the cerebral cortex using the Leica VT1200S Microtome (Leica Microsystems), and the cerebral cortices were further dissected from other areas, including the hippocampus (Fig. 1B). The resulting brain slice samples mainly included the visual, entorhinal, and auditory cortices with some contributions from additional surrounding cortical areas. The slices were then transferred to artificial cerebrospinal fluid (ACSF) containing 126 mm NaCl, 3 mm KCl, 1.14 mm NaH2PO4, 26 mm NaHCO3, 3 mm CaCl2, 1 mm MgCl2, and 10 mm dextrose prewarmed to 37 °C and bubbled with 95% O2, 5% CO2 at pH 7.4; the slices were incubated for 30 min before use.
FIGURE 1.

Characterization of the 0 Mg2+ epilepsy model in cortical brain slices. A, two-photon imaging of neuronal activities. Cortical brain slices were loaded with OGB-1 (green) and the astrocyte marker SR101 (magenta), and the intracellular calcium dynamics of the neurons were observed using two-photon microscopy (top left). Note that astrocytes appear white as they take up both OGB-1 and SR101. The OGB-1 fluorescence intensity profiles of individual neurons in the field of view showed the induction of robust and synchronized neuronal activations under the 0 Mg2+ condition and the apparent recovery of neuronal activities at 10 min after the reperfusion of Mg2+-containing solution (top right). The combination of whole cell electrophysiological recordings with calcium imaging showed that these calcium events (the gray lines and the black line represent the traces of individual neurons in the field of view and their mean values, respectively) reflect the epileptiform neuronal activities (red line) (lower left). A summary plot of the mean spike frequency of all of the neurons in each slice shows the successful induction of the epileptiform activities under the 0 Mg2+ condition (bottom right). The red bars show the mean values in each group, and the asterisks show the significant differences between the groups (*, p < 0.05; n.s., not significant). B, schematic illustration of cortical brain slice preparations. Pure cortical brain slice samples were prepared from 300-μm-thick coronal brain slices and were used for the analyses. C, Western blotting analyses of neuronal activation. Lysates from brain slices under the control and 0 Mg2+ conditions were prepared and analyzed by Western blotting with an antibody against phospho-ERK1/2 (P-ERK1/2). A significant increase in the phospho-ERK1/2 signals was observed in the 0 Mg2+ samples (*, p < 0.002); this increase was completely abolished when the slices were pretreated with the NMDA-type glutamate receptor antagonist AP5 (p = 0.77). D, immunohistochemical characterizations of neuronal activation. The immunoreactivities of the phospho-ERK1/2 signals were compared between control and 0 Mg2+ brain slices (top panels), and the localizations of phospho-ERK1/2 were further analyzed by double staining with the neuronal marker NeuN and the astrocyte marker S100β (bottom panels). The results confirmed that the increase in phospho-ERK1/2 was restricted to neurons but does not occur in astrocytes. Scale bars, 200 μm (top) and 50 μm (bottom). Error bars, S.E.
0 Mg2+ Stimulation and Pharmacology
To induce epileptic activity, the brain slices were transferred to the “0 Mg2+ ACSF,” in which magnesium had been omitted from the normal ACSF. The slices were then incubated at 37 °C for 1 h. In the experiments investigating the reversibility of the 0 Mg2+-induced changes, magnesium was added to the incubation chamber at a final concentration of 1 mm after 1 h of incubation in 0 Mg2+ ACSF. In the experiments using inhibitors, the brain slices were pretreated with inhibitors for 10 min in normal ACSF prior to exposure to the 0 Mg2+ condition. The inhibitors were also present during the stimulation period. SB-3CT was purchased from Abcam, and FN-439 and AP5 were purchased from Sigma-Aldrich. All of the control samples were handled in the same manner as those for the stimulation group in a side-by-side manner.
Biochemistry
After the pharmacological treatments, the brain slices were rinsed in ice-cold HEPES ACSF (125 mm NaCl, 5 mm KCl, 10 mm dextrose, 10 mm HEPES, 1 mm MgCl2, 2 mm CaCl2, pH 7.3) and homogenized in radioimmune precipitation assay buffer (1% Triton X-100, 0.1% SDS, 0.5% deoxycholic acid, 50 mm Tris-HCl, 100 mm NaCl, 1 mm EDTA, 2 mm EGTA, 50 mm NaF, 10 mm sodium pyrophosphate, pH 7.4) supplemented with protease inhibitor mixture (Roche Applied Science) and phosphatase inhibitor mixture (Nacalai Tesque). After incubation at 4 °C for 30 min with gentle rotation, the lysates were centrifuged at 16,000 × g at 4 °C for 15 min, and the supernatants were collected. Following protein concentration measurements using the BCA protein assay (Thermo Scientific), equal amounts of proteins were loaded and analyzed by Western blotting. The signals were visualized using Super Signal substrate (Thermo Scientific) and were detected using an LAS 4000 mini imager (GE Healthcare), followed by analyses using ImageJ software (National Institutes of Health). For quantification, the membranes probed for the target proteins were reprobed for β-actin after stripping using a stripping buffer (Nacalai Tesque), and the band intensities were normalized to those of β-actin. In the case of laminin, because of the large molecular weight differences, laminin and β-actin were quantified in different membranes and were used for the quantifications. All of the quantified band intensities were normalized to the mean values of control groups.
Immunohistochemistry
After pharmacological manipulations, the brain slices were transferred to the fixation solution (4% paraformaldehyde in PBS, Wako Pure Chemical Industries, 4 °C) and were incubated at room temperature for 2 h. After washing with PBS, the slices were incubated with blocking/permeabilization solution containing 10% normal goat serum, 0.5% Triton X-100, and 0.05% NaN3 in PBS at 4 °C overnight. The slices were then incubated with 20 μg/ml unconjugated goat anti-mouse IgG in antibody dilution solution (2% normal goat serum, 0.1% Triton X-100, 0.05% NaN3 in PBS) at room temperature overnight to mask endogenous IgG. After washing with PBS, the slices were sequentially incubated with primary antibodies and secondary antibodies diluted in the antibody dilution solution. After immunostaining, the distributions of the proteins were analyzed using FV1000MPE operating in the single-photon confocal mode.
Calcium Imaging
Slices were incubated with 20 μm Oregon Green 1,2-bis(2-aminophenoxy)ethane-N,N,N′,N′-tetraacetic acid-1 acetoxymethyl ester (OGB-1 AM), 0.04% pluronic F-127, and 200 nm sulforhodamine 101 (SR101) for 45 min at 35 °C and then allowed to recover in regular ACSF for at least 30 min at room temperature before imaging. For imaging, the brain slices were transferred to a recording chamber perfused with 0 Mg2+ ACSF supplemented with 1 mm MgCl2; bubbled with 95% O2, 5% CO2 gas at a speed of 2.5 ml/min at 34 ± 0.5 °C; and incubated for 15 min before each recording. Imaging was performed using FV1000MPE two-photon microscopy (Olympus) equipped with a MaiTai HP femtosecond laser (Newport) tuned to 840 nm (<20 milliwatts under the objective lens) and a LUMPlanFL60 × WIR2 objective lens (numerical aperture 0.9, working distance 2 mm; Olympus). The fluorescence signals of OGB-1 and SR101 were simultaneously recorded using two-channel external photomultiplier tube detectors after the FV10MP-MG/R filter set (BA495–540HQ and BA570–625HQ; Olympus) at 512 × 512 pixels (0.28 μm/pixel). Time lapse imaging was performed at 1 Hz for 300 frames under the control and the 0 Mg2+ conditions using FV10-ASW software (Olympus). To analyze the calcium dynamics, the regions of interest were selected at 20 × 20 pixels at the soma, based on the transmission and the SR101 signals for distinguishing neurons and astrocytes. In each region of interest, the fluorescence change was defined as ΔF/F = (Ft − F0)/(F0 − B0), where Ft, F0, and B0 indicate the fluorescence intensities at each time point, the baseline signals defined by the mean values of the first five frames, and the background signals taken from non-loaded areas, respectively. Spiking events with peak fluorescence intensities exceeding the threshold of 3-fold the S.D. values calculated from the baseline recording period were considered as “calcium spikes” and were used for the statistical analysis. These calcium spikes were confirmed to represent the epileptiform neuronal activities by performing simultaneous electrophysiological recordings and calcium imaging, as described previously (6).
Diffusion Analysis
Diffusion analyses were performed as described previously (5). Briefly, brain slices prepared from postnatal day 19–23 mice were loaded with 200 nm SR101 to label the astrocytes and were treated with the control solution or the 0 Mg2+ solution, as described above. The imaging experiments were performed using an FV1000MPE system with an 800-nm laser illumination at room temperature. Alexa Fluor 488 (1 mm) was ejected from a glass pipette placed on top of the slice and was allowed to diffuse into the parenchyma. The diffusion properties of Alexa Fluor 488 around the endfeet were then recorded at 50–100 μm below the surface. The resulting data were processed and analyzed as described previously, in a blinded manner (5). The slopes of the Alexa Fluor 488 signal intensities at the luminal and parenchymal sides were obtained using a linear fit of the Alexa Fluor 488 signal intensities in proximity (0.49 μm on each side) of the center of the endfeet, as defined by the peak of the sulforhodamine 101 signal (Fig. 7A). Data sets with negative values for both the parenchymal and luminal side slopes (Fig. 7C, bottom left) were excluded from the statistical analysis (Fig. 7D) because of the insufficient spatial resolution for judging the diffusion patterns in these data sets (5).
FIGURE 7.

Changes in diffusion barrier function of endfeet under the 0 Mg2+ condition. A, schematic diagram of the experiment. Brain slices that had been loaded with sulforhodamine 101 to visualize the endfeet around the blood vessels were placed in the recording chamber, and the diffusion of Alexa Fluor 488 from the brain parenchyma toward the lumen of the blood vessels was monitored using two-photon microscopy. The fluorescence intensity profiles of Alexa Fluor 488 around the endfeet were then analyzed to calculate their slopes at both the parenchymal and luminal sides. The two examples illustrate the diffusion patterns and resulting intensity profiles of Alexa Fluor 488 when the diffusion is blocked by the endfeet (left) and when the dye diffuses through the endfeet until it reaches the diffusion barrier by the endothelial cells (right), respectively. B, representative data showing the blockade of molecular diffusion at the endfeet. Representative images showing the distribution of Alexa Fluor 488 around the endfeet stained by sulforhodamine 101 and the intensity profiles of fluorescent signals in a randomly selected region of interest under the normal condition. C, summary plot of the data. Each data point obtained from the control (left) and 0 Mg2+ (middle) brain slices was plotted based on the luminal and parenchymal side slopes of the Alexa Fluor 488 intensity, with the error bars showing the S.E. of the curve fittings used for the calculations. In the merged plot (right), data from the control and 0 Mg2+ slices are colored in black and red, respectively. D, statistical analysis of the parenchymal side slope. A box chart indicates the 25th, 50th, and 75th percentile, and the filled squares show the means of the parenchymal side slopes that reflect the diffusion blockade function of the endfeet. The parenchymal side slopes were significantly smaller in the 0 Mg2+-treated endfeet, compared with those in the control condition (*, p < 0.01).
Real-time Reverse Transcription Quantitative PCR (RT-qPCR) Analysis
Brain slices were prepared and stimulated as described above. To obtain enough RNA to be analyzed, 4–5 brain slices from each group were collected in a single tube and were lysed in Isogen RNA extraction buffer (Nippon Gene); the RNA samples were then prepared according to the manufacturer's instructions. First-strand cDNAs were synthesized from total RNA (0.5 μg) using ReverTra Ace qPCR RT Master Mix with gDNA Remover (Toyobo). The quantitative PCR (qPCR) analysis was performed using KOD SYBR qPCR mix (Toyobo) and the Applied Biosystems StepOne Real Time PCR system (Invitrogen), according to the manufacturer's instructions, in a reaction volume of 25 μl.
The following primers were used: GAPDH, 5′-ACTGGTGTCTTCACCACCATGGAGAAGGC-3′ and 5′-CATGAGGTCCACCACCCTGTTGCTGTAGC-3′; dystroglycan-1, 5′-TGCCTCCAGTGGGGAGATCATCAAGGTGTCTGC-3′ and 5′-GCATTTCCTGGGCCAGCCATGAAGGCCGACATG-3′; and AQP4, 5′-AACCTCACCGCTGGCCATGGGCTCCTG-3′ and 5′-TACGGAAGACAATACCTCTCCCGAAGAGTC-3′.
To evaluate the copy numbers of the dystroglycan-1 (the gene encoding βDG) and GAPDH transcripts, cDNA fragments corresponding to the PCR products to be amplified by the primers listed above were cloned from the total RNA extracted from primary cultured mouse astrocytes using reverse transcription followed by PCR with the SuperScript VILO Master Mix (Invitrogen) and GoTaq Hot Start Master Mix (Promega) and ligated into a pGEM-T vector. After sequencing, the plasmids were used as standards. For AQP4, mouse AQP4 M23 cDNA that had been subcloned into a pIRES2-EGFP vector was used as a standard. The copy numbers of βDG and AQP4 were divided by those of GAPDH in each sample and normalized to the mean values of control groups.
Statistical Analysis
All of the statistical analyses were performed using Origin Pro (OriginLab, Northampton, MA). The asterisks in the figures indicate statistically significant differences among the groups based on the Mann-Whitney U test for two groups and a one-way analysis of variance followed by the Bonferroni test for three groups (p < 0.05). All of the Western blotting and RT-qPCR data are presented as the mean ± S.E. with representative band patterns.
RESULTS
Characterization of the 0 Mg2+ Epilepsy Model in the Cerebral Cortex
First, we characterized the pathophysiological properties of the tissue in the 0 Mg2+ epilepsy model (Fig. 1). Two-photon calcium imaging revealed that the removal of extracellular Mg2+ induced large synchronized neuronal activities that were not observed under the control condition (Fig. 1A). These calcium spikes returned to the control level immediately after the reperfusion of Mg2+-containing ACSF, showing that these neuronal activations were reversible phenomena. Furthermore, simultaneous electrophysiological recordings showed that the robust and synchronous calcium spikes indeed represented epileptiform neuronal activities (Fig. 1A), as reported previously (18–20).
To characterize the molecular and cellular changes in the cerebral cortex without the contaminations of non-cortical areas, cortical areas were isolated from coronal slices and used for biochemical analyses (Fig. 1B). As a marker of pathological neuronal activations in epileptic cortex, the changes in the phosphorylation of ERK1/2 were examined by Western blotting and immunohistochemistry (21). As expected from the overactivation of neurons (Fig. 1A), a significant increase in the phospho-ERK1/2 signal was observed (p < 0.002; Fig. 1C). Importantly, the preincubation of the brain slices with an inhibitor of the NMDA-type glutamate receptor, AP5 (50 μm), completely abolished this increase (p = 0.72; Fig. 1C). This finding is consistent with the idea that the removal of extracellular magnesium ions unblocks NMDA receptors expressed in neurons, with the resulting overactivation of NMDA receptors triggering the pathological epileptic activity in the brain tissues, thereby confirming the validity of this 0 Mg2+ epilepsy model. This was further supported by immunohistochemical analyses of phospho-ERK1/2, which showed a dramatic increase in staining under the 0 Mg2+ condition in neurons but not in astrocytes (Fig. 1D), similar to observations of cortical specimens obtained from epilepsy patients (21).
MMP-dependent Down-regulation of βDG in the 0 Mg2+ Epilepsy Model
We then searched for potential biochemical changes at astrocyte endfeet using antibodies against candidate proteins known to be expressed at astrocytic endfeet. This analysis identified βDG as a prominent molecule that was regulated under the 0 Mg2+ condition. The expression level of βDG was significantly reduced in brain slices compared with that in the control (p < 0.02; Fig. 2A). Importantly, this reduction was dependent on the activation of NMDA-type glutamate receptors because this change was abolished in the presence of AP5 (p = 0.53; Fig. 2A). This result confirmed that the reduction in βDG under the 0 Mg2+ condition resulted from the pathological activation of the neurons and was not caused by unrelated effects resulting from the reduction in extracellular magnesium ions. In contrast, other proteins expressed in astrocytes, including S100β, showed no changes in their expression levels (p = 0.81; Fig. 2B), excluding the possibility that the reduction in the expression level of βDG merely reflected the gross changes in astrocyte numbers and/or health in the whole tissue.
FIGURE 2.

Down-regulation of βDG under the 0 Mg2+ condition. A, expression level of βDG under the 0 Mg2+ condition. Compared with the control, the expression level of βDG was significantly decreased under the 0 Mg2+ conditions (*, p < 0.02), and this down-regulation was abolished in the presence of AP5 (p = 0.53). B, expression level of S100β under the 0 Mg2+ conditions. In contrast to the results for βDG, the total protein expression level of S100β in the slices was not altered under the 0 Mg2+ conditions (p = 0.81). Error bars, S.E.
The decrease in the expression level of βDG in epileptic cortices may arise from a reduction in new protein synthesis, an increase in protein degradation, or both mechanisms. Favoring the degradation scenario, previous studies have shown that βDG can become a target of matrix metalloproteinase (MMP) in the brain (22, 23). Therefore, we examined the involvement of MMP in the down-regulation of βDG under the epileptic condition in the cerebral cortex. The activities of MMPs were blocked by two pharmacologically distinct MMP inhibitors, SB-3CT (10 μm) and FN439 (100 μm), which preferentially inhibit MMP-2 and -9 and MMP-1, -8, and -9, respectively. The preincubation of brain slices with neither of these inhibitors blocked the increase in phospho-ERK1/2 signals (p < 0.005; Fig. 3, A and B), suggesting that MMP activity is not required for the overactivation of neurons under this condition. In contrast, the reduction in βDG under the 0 Mg2+ stimulation was completely abolished (SB-3CT, p = 0.90 (Fig. 3A) and FN-439, p = 0.64 (Fig. 3B)), suggesting that MMP (most likely MMP-9, which is inhibited by both of the inhibitors that were used) is responsible for the down-regulation of βDG at the endfeet. To examine the potential changes in the synthetic pathway, RT-qPCR was performed using RNA samples prepared from brain slices. This analysis revealed no change in the copy number of the dystroglycan-1 gene transcript (i.e. the βDG mRNA level) after a 1-h exposure to the 0 Mg2+ condition (p = 0.39; Fig. 3C), further supporting the hypothesis that the down-regulation of βDG in this time period was due to MMP-dependent protein degradation.
FIGURE 3.

Requirement of MMP for the down-regulation of βDG under the 0 Mg2+ condition. A, effect of preincubation with SB-3CT. The requirement of MMP for the down-regulation of βDG was examined by preincubating brain slices with a selective inhibitor of MMPs, SB-3CT. Although having no effects on neuronal activation as probed by phospho-ERK1/2 (*, p < 0.005), SB-3CT abolished the down-regulation of βDG in the 0 Mg2+ samples (p = 0.90). B, effect of FN-439. The specificity of the pharmacological inhibition of MMPs was further tested using another MMP inhibitor, FN-439. Similar to SB-3CT, FN-439 blocked the down-regulation of βDG (p = 0.64), despite the activation of neurons probed by phospho-ERK1/2 (p < 0.005). C, mRNA level of βDG under the 0 Mg2+ condition. The copy number of the dystroglycan-1 gene transcripts was measured using total RNA samples prepared from brain slices under the control and 0 Mg2+ conditions using RT-qPCR and normalized to that of GAPDH. No significant differences in the mRNA levels of βDG (p = 0.39) were observed. Error bars, S.E.
βDG Down-regulation at Astrocytic Endfeet Is Accompanied by a Decrease in AQP4 Expression
To identify the site of βDG regulation described above, we analyzed the localization of βDG in the cerebral cortex using double immunolabeling followed by confocal microscopy analyses. We found that the βDG immunoreactivity in the brain parenchyma almost completely matched that of AQP4, which is known to be enriched at astrocyte endfeet, as well as that of laminin expressed at the basement membrane around blood vessels (Fig. 4, A and B). Notably, higher magnification images revealed that the immunostaining patterns overlapped extensively between βDG and AQP4 but to a lesser extent between βDG and laminin. These data are consistent with previous reports suggesting the specific localization of βDG at astrocytic endfeet at gliovascular interfaces (12, 23). Thus, the biochemical changes in βDG under the 0 Mg2+ condition observed above may affect the physiological properties of astrocytic endfeet most prominently.
FIGURE 4.
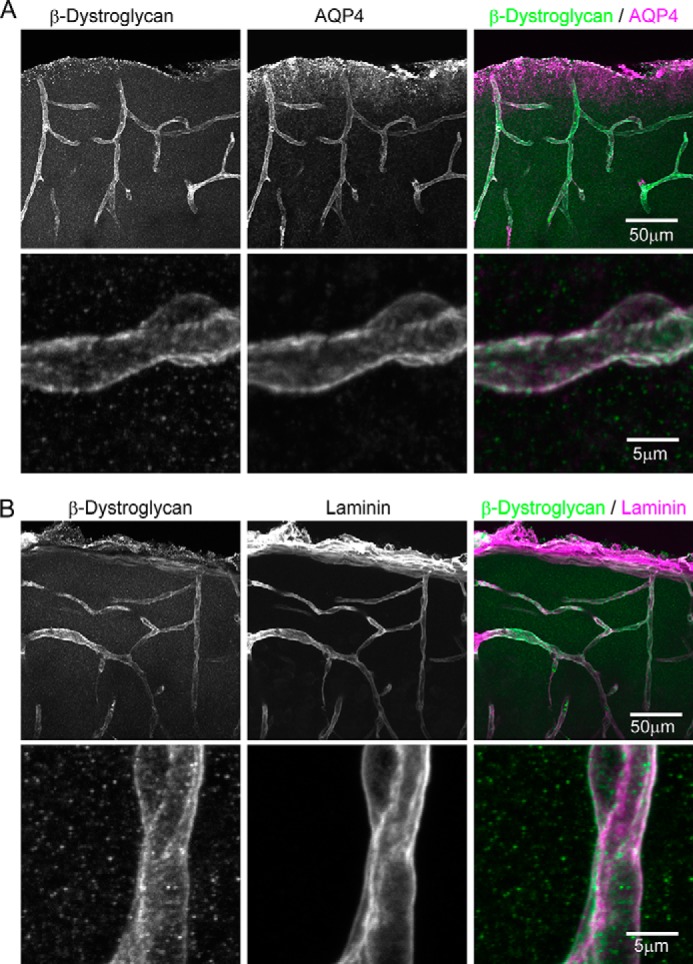
Localization of βDG at astrocytic endfeet at gliovascular interfaces in the cerebral cortex. A, double immunostaining of βDG and AQP4. Z-Stack confocal imaging showed that βDG immunoreactivity colocalized extensively with that of AQP4 at the astrocytic endfeet. Scale bars, 50 μm (top) and 5 μm (bottom), respectively. B, double immunostaining of βDG and laminin. βDG also colocalized with laminin expressed at the basement membrane around the blood vessels. Note that at the higher magnification, the localizations of these proteins appear side-by-side instead of completely overlapping.
At the endfeet, βDG plays critical roles in astrocytic physiology in association with other functional molecules, such as AQP4 (9, 11, 24–27). This raises the possibility that a decrease in βDG affects the components of the associated macromolecular complex at the endfeet, as was observed in βDG knock-out animals (12). Therefore, we examined the expression level of AQP4 under the 0 Mg2+ condition. Indeed, this analysis revealed that AQP4 was significantly down-regulated, albeit to a lesser extent than βDG, under the 0 Mg2+ condition (p < 0.05; Fig. 5A). This result is consistent with previous studies showing a decreased level of AQP4 at astrocyte endfeet in epilepsy (28–30). This change appears to occur at the protein level because no change in the mRNA level was observed, similar to the case for βDG (p = 0.39; Fig. 5B). Importantly, in contrast to AQP4, the expression level of laminin was unchanged (p = 0.37; Fig. 5C), suggesting that the basement membrane structures that lie on the other side of the gliovascular interface remain intact under this condition. Taken together, these observations suggest that a macromolecular reorganization of βDG-associated proteins occurs inside the endfeet under epileptic conditions.
FIGURE 5.
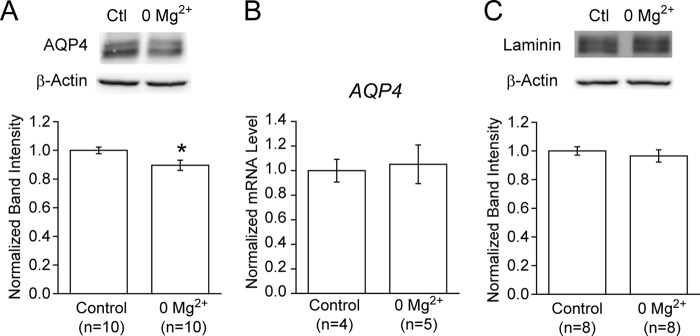
Coordinated down-regulation of AQP4, but not laminin, under the 0 Mg2+ condition. A, protein expression level of AQP4 at the endfeet. The protein expression level of AQP4 was significantly reduced under the 0 Mg2+ conditions, compared with the control (*, p < 0.05). B, mRNA level of AQP4. The copy number of the AQP4 gene transcript was measured using total RNA samples prepared from brain slices by RT-qPCR and normalized to that of GAPDH. No significant differences were observed between the control and 0 Mg2+ groups (p = 0.39). C, protein expression level of laminin at the basement membrane. In contrast to AQP4, the expression level of laminin was unchanged under the 0 Mg2+ conditions (p = 0.37). Error bars, S.E.
Sustained Down-regulation of βDG after Transient Exposure to 0 Mg2+
Recurring seizure events are one of the most problematic features of epilepsy. Therefore, to examine the potential consequences of one-time seizure events on tissue physiology, the changes in βDG expression were monitored during the recovery phase (Fig. 6A). When the brain slices were allowed to recover in normal ACSF containing 1 mm magnesium for 60 min following a 60-min exposure to 0 Mg2+ solution, the phospho-ERK1/2 signal completely returned to its original level, suggesting the recovery of neuronal activities (Fig. 6B). These results were consistent with the calcium imaging results (Fig. 1A). In sharp contrast, when the βDG expression level was examined under this condition, no sign of recovery was observed (p < 0.05; Fig. 6C). These results suggest that abnormal neuronal activations affect the βDG at astrocytic endfeet in a sustained manner, indicating that such pathological changes in astrocytes may contribute to the development of tissue damage despite the apparent recovery of the neuronal physiology in the epileptic cerebral cortex.
FIGURE 6.

Reversibility of βDG down-regulation. A, schematic diagram of the recovery experiment. Brain slices were incubated in normal ACSF containing 1 mm Mg2+ for 120 min (control), 60 min followed by incubation in 0 mm Mg2+ ACSF for 60 min (0 Mg2+), or 60 min in 0 Mg2+ ACSF followed by recovery for 60 min in normal ACSF (Recovery) before sample preparation. B, reversibility of neuronal activation. When the slices were allowed to recover in normal solution after exposure to 0 Mg2+ solution, the phospho-ERK1/2 level returned back to normal, indicating the recovery of the neuronal activities. C, reversibility of βDG down-regulation. Under the same conditions, the expression level of βDG remained low in the recovery samples, compared with the control (*, p < 0.05; n.s., not significant), without any signs of recovery when compared with the 0 Mg2+ samples. Error bars, S.E.
Impairment of Astrocytic Diffusion Barrier Functions under the 0 Mg2+ Condition
Finally, the functional consequences of the biochemical changes observed so far were examined. Because βDG is considered to be the key molecule in the formation and maintenance of the tight interactions between the endfeet and vasculature, which is critical in making the endfeet work as a diffusion barrier at the blood-brain interface (5), the potential changes in these diffusion barrier functions were investigated. To test this possibility, a probe molecule (Alexa Fluor 488 hydrazide) was applied to the brain parenchyma, and the diffusion patterns at the blood-brain interface were assessed using two-photon microscopy in brain slices in the normal solution and in those exposed to 0 Mg2+ stimulation (Fig. 7, A and B). Quantitative data analyses revealed that the distribution of the data points was somewhat altered in the 0 Mg2+ slices, compared with the controls (Fig. 7C). Most notably, the data points falling to the upper left side of the panel because of the strong diffusion blockade functions that are abundant under control conditions could hardly be observed under the 0 Mg2+ conditions (Fig. 7, A and C). For comparison, the “parenchymal side slope” of the fluorescence intensity profile around the endfeet, which dramatically decreases under ischemic conditions and thus indicates the diffusion blockade function of endfeet (5), was utilized. This analysis revealed that the diffusion blockade functions of endfeet were significantly reduced in brain slices exposed to 0 Mg2+, compared with the control slices (p < 0.01; Fig. 7D), suggesting that the biochemical changes in endfeet are associated with a reduced integrity of the gliovascular interactions that then lead to dysfunctions at the blood-brain interface.
DISCUSSION
In this study, we examined the biochemical changes in astrocytic endfeet upon epileptic neuronal activation and found that βDG is down-regulated by MMP, with a concomitant down-regulation of AQP4 as well as the malfunction of the astrocytic endfeet as a diffusion barrier.
The involvement of dystroglycan in epilepsy has been suggested based on studies of genetic disorders, including Fukuyama-type congenital muscular dystrophy (31). Similarly, changes in MMP-9 as well as AQP4 have been suggested to occur in human epilepsy patients (28, 30, 32). Our findings are consistent with these studies and suggest a comprehensive model in which a single episode of epileptiform activities induces MMP-9 activation that then down-regulates βDG and associated AQP4 at the astrocytic endfeet. Although this down-regulation of βDG may not directly contribute to pathological neuronal activations, it alters the physiological properties of astrocytes, especially at the endfeet, including their function as a diffusion barrier, as shown in the present study. Importantly, we found that this down-regulation of βDG persists for at least 1 h after the cessation of abnormal neuronal activities, suggesting that the astrocytic changes that occur upon seizure events are long lasting and have different kinetics from those of neuronal physiology. Thus, our results indicate that the apparent recovery of neuronal activities does not represent the recovery of the brain tissue but that the occurrence of epileptic events alters the tissue in a sustained manner in the form of molecular and cellular changes in astrocytes. Combined with accumulating evidence suggesting the roles of astrocytes in both the physiology and pathophysiology of the brain, our results strongly indicate that astrocytic changes upon seizure events may contribute to the development of long term pathological changes in the cortical tissue in epilepsy.
When considering the pathophysiology of epilepsy, however, it should be noted that the present study describes the “averaged responses” of all of the cortical areas used in the biochemical analyses, including the visual, auditory, and entorhinal cortices. Although we did not find clear systematic differences in neuronal calcium responses that could be attributed to distinct cortical areas in our analyses, we did notice variable responses among the samples under the 0 Mg2+ stimulation. In this respect, we should also mention a limitation of our calcium imaging analysis. We optimized the calcium imaging analysis to characterize global changes in the intracellular calcium concentrations by imaging a large field of view for a long time at a low frame rate and detecting only robust signal changes. Inevitably, such experimental design comes at a cost of missing high frequency and/or small amplitude calcium dynamics in individual neurons, which evidently can be seen by the fact that our analysis yielded a very low frequency of calcium spikes under the control condition. As such, further differences may exist among the brain slices in their responses to 0 Mg2+ stimulation. Although detailed characterizations of these responses are beyond the scope of this study, such variations may in part reflect differences in pathological responses among different subregions in the cerebral cortex. In this scenario, some cortical areas may experience even larger changes in βDG as well as the functions of the endfeet compared with the averaged responses that we report in this study. This, in turn, may contribute to the different pathophysiological responses among cortical areas in epilepsy.
Molecularly, the specific association of βDG with other proteins of functional importance has been suggested in astrocytes (24–27). Here, βDG is considered to be the key molecule linking laminin-enriched specific extracellular environments at the basement membrane and specialized membrane domains within astrocytic endfeet with a high concentration of associated proteins, including AQP4. Indeed, the genetic deletion of βDG in the brain severely affects the membrane architectures of astrocytes and brain development (12, 33). Consistently, we found that the degradation of βDG is accompanied by a decrease in the AQP4 expression level. Therefore, we speculate that the degradation of βDG in specialized biochemical compartments in astrocytic endfeet imposes deleterious effects on the physiological functions of endfeet under the conditions of epilepsy. Regarding the function of astrocytic endfeet, their pivotal roles in the recently proposed “glymphatic system” are of great interest (8, 34). The combination of the down-regulation of AQP4 and βDG that we observed would synergistically decrease functional AQP4 at paravascular endfeet. This action would, in turn, increase the resistance for the flux of water from the paraventricular space to the brain parenchyma, thereby reducing the convective flux of water that is critical for the clearance of interstitial solutes, including toxic metabolites. Furthermore, because no directional convective flux of water was present in the brain slice preparations used in this study, it is highly unlikely that what we observed was the result of compensatory changes in astrocytes, as suggested in some pathological models in vivo (35). Taken together, we speculate that the decreases in AQP4 and βDG in astrocytic endfeet during the initial phase of epilepsy exacerbate the pathophysiological properties of the focal area by inhibiting astrocytic functions, especially their pivotal roles in the maintenance of the regulated flow of molecules in the brain, thereby leading to more chronic changes in the tissue in epilepsy.
Finally, although this study focused on a pathological condition, it is tempting to speculate that βDG and other biochemical components at astrocyte endfeet are regulated by physiological neuronal activity in a highly dynamic manner. Although little is known regarding astrocytes, the activity-dependent reorganization of proteins in biochemically isolated dendritic spines has been well documented in neurons (36). With their capacities to sense the ensembles of neuronal activities within territories, astrocytes may respond to the dynamics of neuronal activities via their own kinetics in a highly plastic manner.
Acknowledgments
We thank K. Hiratsuka (Yokohama National University) and Y. Kanno (Tokyo Medical University) for great help in establishing the project, M. Matsubara (Keio University) for technical assistance, and laboratory members for comments.
This work was supported by the Takeda Science Foundation (to M. N.), the Kowa Life Science Foundation (to M. N.), the SUNBOR Grant (to M. N.), and KAKENHI Grants 23657106 and 26650052 (to M. N.).
We dedicate this work to our beloved colleague and friend, the late Ayaka Morita.
- βDG
- β-dystroglycan
- SR101
- sulforhodamine 101
- OGB-1 AM
- Oregon Green 1,2-bis(2-aminophenoxy)ethane-N,N,N′,N′-tetraacetic acid-1 acetoxymethyl ester
- ACSF
- artificial cerebrospinal fluid
- qPCR
- quantitative PCR
- MMP
- matrix metalloproteinase.
REFERENCES
- 1. Crunelli V., Carmignoto G. (2013) New vistas on astroglia in convulsive and non-convulsive epilepsy highlight novel astrocytic targets for treatment. J. Physiol. 591, 775–785 [DOI] [PMC free article] [PubMed] [Google Scholar]
- 2. Devinsky O., Vezzani A., Najjar S., De Lanerolle N. C., Rogawski M. A. (2013) Glia and epilepsy: excitability and inflammation. Trends Neurosci. 36, 174–184 [DOI] [PubMed] [Google Scholar]
- 3. Tian G. F., Azmi H., Takano T., Xu Q., Peng W., Lin J., Oberheim N., Lou N., Wang X., Zielke H. R., Kang J., Nedergaard M. (2005) An astrocytic basis of epilepsy. Nat. Med. 11, 973–981 [DOI] [PMC free article] [PubMed] [Google Scholar]
- 4. Mathiisen T. M., Lehre K. P., Danbolt N. C., Ottersen O. P. (2010) The perivascular astroglial sheath provides a complete covering of the brain microvessels: an electron microscopic 3D reconstruction. Glia 58, 1094–1103 [DOI] [PubMed] [Google Scholar]
- 5. Nuriya M., Shinotsuka T., Yasui M. (2013) Diffusion properties of molecules at the blood-brain interface: potential contributions of astrocyte endfeet to diffusion barrier functions. Cereb. Cortex 23, 2118–2126 [DOI] [PubMed] [Google Scholar]
- 6. Shinotsuka T., Yasui M., Nuriya M. (2014) Astrocytic gap junctional networks suppress cellular damage in an in vitro model of ischemia. Biochem. Biophys. Res. Commun. 444, 171–176 [DOI] [PubMed] [Google Scholar]
- 7. Xie L., Kang H., Xu Q., Chen M. J., Liao Y., Thiyagarajan M., O'Donnell J., Christensen D. J., Nicholson C., Iliff J. J., Takano T., Deane R., Nedergaard M. (2013) Sleep drives metabolite clearance from the adult brain. Science 342, 373–377 [DOI] [PMC free article] [PubMed] [Google Scholar]
- 8. Iliff J. J., Wang M., Liao Y., Plogg B. A., Peng W., Gundersen G. A., Benveniste H., Vates G. E., Deane R., Goldman S. A., Nagelhus E. A., Nedergaard M. (2012) A paravascular pathway facilitates CSF flow through the brain parenchyma and the clearance of interstitial solutes, including amyloid β. Sci. Transl. Med. 4, 147ra111. [DOI] [PMC free article] [PubMed] [Google Scholar]
- 9. Neely J. D., Amiry-Moghaddam M., Ottersen O. P., Froehner S. C., Agre P., Adams M. E. (2001) Syntrophin-dependent expression and localization of Aquaporin-4 water channel protein. Proc. Natl. Acad. Sci. U.S.A. 98, 14108–14113 [DOI] [PMC free article] [PubMed] [Google Scholar]
- 10. Furman C. S., Gorelick-Feldman D. A., Davidson K. G., Yasumura T., Neely J. D., Agre P., Rash J. E. (2003) Aquaporin-4 square array assembly: opposing actions of M1 and M23 isoforms. Proc. Natl. Acad. Sci. U.S.A. 100, 13609–13614 [DOI] [PMC free article] [PubMed] [Google Scholar]
- 11. Nagelhus E. A., Mathiisen T. M., Ottersen O. P. (2004) Aquaporin-4 in the central nervous system: cellular and subcellular distribution and coexpression with KIR4.1. Neuroscience 129, 905–913 [DOI] [PubMed] [Google Scholar]
- 12. Noell S., Wolburg-Buchholz K., Mack A. F., Beedle A. M., Satz J. S., Campbell K. P., Wolburg H., Fallier-Becker P. (2011) Evidence for a role of dystroglycan regulating the membrane architecture of astroglial endfeet. Eur. J. Neurosci. 33, 2179–2186 [DOI] [PMC free article] [PubMed] [Google Scholar]
- 13. Nuriya M., Yasui M. (2013) Endfeet serve as diffusion-limited subcellular compartments in astrocytes. J. Neurosci. 33, 3692–3698 [DOI] [PMC free article] [PubMed] [Google Scholar]
- 14. Yuste R. (2010) Dendritic Spines, MIT Press, Cambridge, MA [Google Scholar]
- 15. Aram J. A., Lodge D. (1988) Validation of a neocortical slice preparation for the study of epileptiform activity. J. Neurosci. Methods 23, 211–224 [DOI] [PubMed] [Google Scholar]
- 16. Világi I., Tarnawa I., Banczerowski-Pelyhe I. (1991) Changes in seizure activity of the neocortex during the early postnatal development of the rat: an electrophysiological study on slices in Mg2+-free medium. Epilepsy Res. 8, 102–106 [DOI] [PubMed] [Google Scholar]
- 17. Dreier J. P., Heinemann U. (1990) Late low magnesium-induced epileptiform activity in rat entorhinal cortex slices becomes insensitive to the anticonvulsant valproic acid. Neurosci. Lett. 119, 68–70 [DOI] [PubMed] [Google Scholar]
- 18. Pisani A., Bonsi P., Martella G., De Persis C., Costa C., Pisani F., Bernardi G., Calabresi P. (2004) Intracellular calcium increase in epileptiform activity: modulation by levetiracetam and lamotrigine. Epilepsia 45, 719–728 [DOI] [PubMed] [Google Scholar]
- 19. Badea T., Goldberg J., Mao B., Yuste R. (2001) Calcium imaging of epileptiform events with single-cell resolution. J. Neurobiol. 48, 215–227 [DOI] [PubMed] [Google Scholar]
- 20. Gómez-Gonzalo M., Losi G., Chiavegato A., Zonta M., Cammarota M., Brondi M., Vetri F., Uva L., Pozzan T., de Curtis M., Ratto G. M., Carmignoto G. (2010) An excitatory loop with astrocytes contributes to drive neurons to seizure threshold. PLoS Biol. 8, e1000352. [DOI] [PMC free article] [PubMed] [Google Scholar]
- 21. Beaumont T. L., Yao B., Shah A., Kapatos G., Loeb J. A. (2012) Layer-specific CREB target gene induction in human neocortical epilepsy. J. Neurosci. 32, 14389–14401 [DOI] [PMC free article] [PubMed] [Google Scholar]
- 22. Michaluk P., Kolodziej L., Mioduszewska B., Wilczynski G. M., Dzwonek J., Jaworski J., Gorecki D. C., Ottersen O. P., Kaczmarek L. (2007) β-Dystroglycan as a target for MMP-9, in response to enhanced neuronal activity. J. Biol. Chem. 282, 16036–16041 [DOI] [PubMed] [Google Scholar]
- 23. Agrawal S., Anderson P., Durbeej M., van Rooijen N., Ivars F., Opdenakker G., Sorokin L. M. (2006) Dystroglycan is selectively cleaved at the parenchymal basement membrane at sites of leukocyte extravasation in experimental autoimmune encephalomyelitis. J. Exp. Med. 203, 1007–1019 [DOI] [PMC free article] [PubMed] [Google Scholar]
- 24. Hibino H., Kurachi Y. (2007) Distinct detergent-resistant membrane microdomains (lipid rafts) respectively harvest K+ and water transport systems in brain astroglia. Eur. J. Neurosci. 26, 2539–2555 [DOI] [PubMed] [Google Scholar]
- 25. Noël G., Tham D. K., Moukhles H. (2009) Interdependence of laminin-mediated clustering of lipid rafts and the dystrophin complex in astrocytes. J. Biol. Chem. 284, 19694–19704 [DOI] [PMC free article] [PubMed] [Google Scholar]
- 26. Fort P. E., Sene A., Pannicke T., Roux M. J., Forster V., Mornet D., Nudel U., Yaffe D., Reichenbach A., Sahel J. A., Rendon A. (2008) Kir4.1 and AQP4 associate with Dp71- and utrophin-DAPs complexes in specific and defined microdomains of Müller retinal glial cell membrane. Glia 56, 597–610 [DOI] [PubMed] [Google Scholar]
- 27. Ambrosini E., Serafini B., Lanciotti A., Tosini F., Scialpi F., Psaila R., Raggi C., Di Girolamo F., Petrucci T. C., Aloisi F. (2008) Biochemical characterization of MLC1 protein in astrocytes and its association with the dystrophin-glycoprotein complex. Mol. Cell Neurosci. 37, 480–493 [DOI] [PubMed] [Google Scholar]
- 28. Eid T., Lee T. S., Thomas M. J., Amiry-Moghaddam M., Bjørnsen L. P., Spencer D. D., Agre P., Ottersen O. P., de Lanerolle N. C. (2005) Loss of perivascular aquaporin 4 may underlie deficient water and K+ homeostasis in the human epileptogenic hippocampus. Proc. Natl. Acad. Sci. U.S.A. 102, 1193–1198 [DOI] [PMC free article] [PubMed] [Google Scholar]
- 29. Lee D. J., Hsu M. S., Seldin M. M., Arellano J. L., Binder D. K. (2012) Decreased expression of the glial water channel aquaporin-4 in the intrahippocampal kainic acid model of epileptogenesis. Exp. Neurol. 235, 246–255 [DOI] [PMC free article] [PubMed] [Google Scholar]
- 30. Alvestad S., Hammer J., Hoddevik E. H., Skare Ø., Sonnewald U., Amiry-Moghaddam M., Ottersen O. P. (2013) Mislocalization of AQP4 precedes chronic seizures in the kainate model of temporal lobe epilepsy. Epilepsy Res. 105, 30–41 [DOI] [PubMed] [Google Scholar]
- 31. Yoshioka M., Higuchi Y. (2005) Long-term prognosis of epilepsies and related seizure disorders in Fukuyama-type congenital muscular dystrophy. J. Child Neurol. 20, 385–391 [DOI] [PubMed] [Google Scholar]
- 32. Li Y. J., Wang Z. H., Zhang B., Zhe X., Wang M. J., Shi S. T., Bai J., Lin T., Guo C. J., Zhang S. J., Kong X. L., Zuo X., Zhao H. (2013) Disruption of the blood-brain barrier after generalized tonic-clonic seizures correlates with cerebrospinal fluid MMP-9 levels. J. Neuroinflammation 10, 80. [DOI] [PMC free article] [PubMed] [Google Scholar]
- 33. Moore S. A., Saito F., Chen J., Michele D. E., Henry M. D., Messing A., Cohn R. D., Ross-Barta S. E., Westra S., Williamson R. A., Hoshi T., Campbell K. P. (2002) Deletion of brain dystroglycan recapitulates aspects of congenital muscular dystrophy. Nature 418, 422–425 [DOI] [PubMed] [Google Scholar]
- 34. Iliff J. J., Nedergaard M. (2013) Is there a cerebral lymphatic system? Stroke 44, S93–S95 [DOI] [PMC free article] [PubMed] [Google Scholar]
- 35. Ren Z., Iliff J. J., Yang L., Yang J., Chen X., Chen M. J., Giese R. N., Wang B., Shi X., Nedergaard M. (2013) “Hit & Run” model of closed-skull traumatic brain injury (TBI) reveals complex patterns of post-traumatic AQP4 dysregulation. J. Cereb. Blood Flow Metab. 33, 834–845 [DOI] [PMC free article] [PubMed] [Google Scholar]
- 36. Ehlers M. D. (2003) Activity level controls postsynaptic composition and signaling via the ubiquitin-proteasome system. Nat. Neurosci. 6, 231–242 [DOI] [PubMed] [Google Scholar]