Background: The oligomerization mechanism of a prion protein is not fully understood.
Results: We found an acid-induced molten globule state (A-state) as a pre-oligomer state, in which the Strand 1-Helix 1-Strand 2 segment was unfolded.
Conclusion: The A-state formation is the initial step of the oligomerization.
Significance: This work may offer a clue for understanding the prion's pathogenic conversion mechanism.
Keywords: Aggregation, Prion, Protein Dynamic, Protein Folding, Protein Misfolding, beta-rich Oligomer, A-state, Molten Globule State
Abstract
The conversion of a cellular prion protein (PrPC) to its pathogenic isoform (PrPSc) is a critical event in the pathogenesis of prion diseases. Pathogenic conversion is usually associated with the oligomerization process; therefore, the conformational characteristics of the pre-oligomer state may provide insights into the conversion process. Previous studies indicate that PrPC is prone to oligomer formation at low pH, but the conformation of the pre-oligomer state remains unknown. In this study, we systematically analyzed the acid-induced conformational changes of PrPC and discovered a unique acid-induced molten globule state at pH 2.0 termed the “A-state.” We characterized the structure of the A-state using far/near-UV CD, 1-anilino-8-naphthalene sulfonate fluorescence, size exclusion chromatography, and NMR. Deuterium exchange experiments with NMR detection revealed its first unique structure ever reported thus far; i.e. the Strand 1-Helix 1-Strand 2 segment at the N terminus was preferentially unfolded, whereas the Helix 2-Helix 3 segment at the C terminus remained marginally stable. This conformational change could be triggered by the protonation of Asp144, Asp147, and Glu196, followed by disruption of key salt bridges in PrPC. Moreover, the initial population of the A-state at low pH (pH 2.0–5.0) was well correlated with the rate of the β-rich oligomer formation, suggesting that the A-state is the pre-oligomer state. Thus, the specific conformation of the A-state would provide crucial insights into the mechanisms of oligomerization and further pathogenic conversion as well as facilitating the design of novel medical chaperones for treating prion diseases.
Introduction
Prion diseases (1, 2) are a group of fatal neurodegenerative diseases that includes Creutzfeldt-Jakob disease and kuru in humans, as well as scrapie and bovine spongiform encephalopathy in animals. The conversion of the cellular prion protein (PrPC)2 to its pathogenic conformational isoform (PrPSc) is a crucial event in the pathogenesis of prion diseases (1, 2). PrPC contains three α-helices (Helix 1 (H1), Helix 2 (H2), and Helix 3 (H3)), where H2 and H3 are connected by a disulfide bridge between Cys179 and Cys214, and a small β-sheet (Strand 1 (S1) and Strand 2 (S2)) (3). In contrast, PrPSc is mainly composed of a β-strand structure, as revealed by Fourier transform infrared spectroscopy (4), and it was reported that the infectious particles in prion diseases (PrPSc) include oligomers (5, 6). Thus, the β-sheet formation and oligomerization process may be a crucial step during the formation and/or stabilization of PrPSc. To understand and further regulate these complex processes, it would be beneficial to clarify the conformational characteristics of the pre-oligomer state that may exist immediately before the β-sheet and oligomer formation.
Initially, β-rich oligomers were reported to be formed at a mildly acidic pH (pH 2.5–5.0) in the presence of denaturant (7–10) or at a higher temperature (11), and recently it was also reported that they were generated at a highly acidic pH (pH 2.0) without denaturant (12, 13). Unfortunately, the detailed physicochemical studies at pH 2.0 were mainly on the salt-induced aggregates (13–16), and the monomer state was only observed at the pH range from 5.2 to 3.0, in which a large chemical shift perturbation was observed in the C-terminal region of H2 and the H2-H3 loop (residues 185–195) (17). Thus, overall conformational characteristics of PrPC at a highly acidic pH within the monomer ensemble essentially remain unknown, especially at the residue level resolution.
In the present study, we systematically analyzed the acid-induced conformational change in mouse prion protein fragment 90–231 (mPrP(90–231)) by reducing the pH down to 2.0 within the monomeric state and detected a previously unreported thermodynamically stable state of the PrPC. Far-UV CD, near-UV CD, size exclusion chromatography, 1-anilino-8-naphthalene sulfonate (ANS) fluorescence, and NMR revealed that the conformational properties of this state were similar to those of the acid-induced molten globule state (“A-state”) (18). We subsequently performed a conformational analysis of the A-state using deuterium exchange coupled with NMR and found that the S1-H1-S2 segments were almost completely unfolded, whereas the H2-H3 segment was still weakly protected. The A-state in this report is the only monomeric intermediate ever reported thus far, which is characterized by its markedly high tendency to β-rich formation. The A-state is easily aggregated into β-rich oligomer at pH 2.0 by increasing the ionic strength. Moreover, the initial population of the A-state at low pH (2.0–5.0) was well correlated with the rate of the β-rich oligomer formation, suggesting that the A-state is the pre-oligomer state. We further discuss the detailed conformational properties of the A-state based on pH titration analysis, which provides insights into the detailed mechanism of the oligomerization process.
EXPERIMENTAL PROCEDURES
Acid Titration
A recombinant mPrP(90–231) with an N-terminal linker containing His6 was prepared according to a protocol described previously (19, 20).
In the acid titration experiments, the pH was adjusted by slowly adding drops of 0.1–12 m HCl to the native mPrP(90–231) solution, which contained 20 mm sodium acetate at pH 4.6 at 20 or 37 °C. 10 and 70 μm of mPrP(90–231) were used for the far- and near-UV CD measurements, respectively. 10 μm mPrP(90–231) solution and 100 μm ANS were used for ANS fluorescence analysis. Far-/near-UV CD was monitored by a quartz cell with a light path of 1 or 10 mm using an AVIV model 215s spectropolarimeter (AVIV Biomedical, Lakewood, NJ) and by ANS fluorescence using a Hitachi F-7000 fluorescence spectrophotometer (Hitachi High-Tech, Tokyo, Japan) with excitation at 385 nm and emission at 400–600 nm.
The acid titration data obtained from the far-/near-UV CD observation were fitted globally using the theoretical curve generated by assuming a two-state model (Equations 1 and 2) (21) with the nonlinear least squares methods using the software Igor Pro (Wave Metrics Inc., Lake Oswego, OR),
 |
 |
where αN, mN, αA, and mA are the intercepts and the slopes of the native state and A-state baselines, respectively; pHmid and ΔνH+ represent the midpoint of the transition and the steepness of the transition (or the number of bound or released H+), respectively; and KNA represents the equilibrium constant of the N-to-U transition.
The secondary structure contents of PrPC were estimated from far-UV CD spectra using SELCON3 (22). The pKa values for charged residues were predicted theoretically from the three-dimensional structure of native PrPC (Protein Data Bank entry 1AG2) based on the continuum electrostatics model using H++ (23).
Urea Titration at Variable pH Values Monitored by Far-UV CD
A solution of mPrP(90–231) with a protein concentration of 10 μm was titrated with 10 m urea solution containing the same protein and buffer at 20 °C and monitored by far-UV CD. The buffers utilized were 20 mm glycine (pH 2.0–3.1), 20 mm sodium citrate (pH 3.2–3.9), or 20 mm sodium acetate (pH 4.0–4.6). The urea concentration was measured using the refractive index values. The far-UV CD spectra were measured according to the same protocol described above. The mean residue ellipticities [θ] obtained as a function of the urea concentrations were fitted using the theoretical curve generated by the following two-state model (Equations 3 and 4),
 |
 |
where [θ]N and [θ]U represent the mean residue ellipticity of the native (N) and unfolded state (U) at 0 m urea, respectively; KNU represents the equilibrium constant of the N-to-U transition; mNU represents the m value (or cooperativity) of the transition; and ΔGNU represents the Gibbs free energy difference between the N and U states in the absence of urea.
Size Exclusion Chromatography
The hydrostatic properties of mPrP(90–231) were studied using a gel filtration column, TSKgel G3000SW, which was connected to an ÄKTA chromatography system (GE Healthcare). Further, pH 4.6 buffer (pH 4.6, 20 mm sodium acetate buffer, and variable NaCl concentrations) and pH 2.0 buffer (pH 2.0, 20 mm glycine, and variable NaCl concentrations) were used for the native and A-state conditions, respectively. The column was equilibrated using the buffer with 4 column volumes before the experiment. To protect the column, the injected solutions were passed through 0.2-μm filters before their application. All of the experiments were performed at a flow rate of 0.5–1.0 ml/min at 25 °C. The molecular weight was estimated from a standard curve obtained using standard proteins.
NMR Measurements and Analysis
To acquire both the 1H one-dimensional NMR and 15N-1H HSQC data, an 15N-uniformly labeled mPrP(90–231) solution was prepared at a concentration of 0.5 mm at pH 4.6 or 2.0 in 5 mm acetate-d4 buffer with 95% H2O, 5% D2O. The NMR spectra were recorded at 20 °C using an Avance 600 spectrometer at Gifu University.
For the line shape analysis, the peaks in HSQC spectra were assigned based on the chemical shifts for mPrP(23–231) and mPrP(121–231) (3, 24). An exponential window function with 8-Hz line broadening was used for this analysis. The 1H one-dimensional slices were extracted at the maximum of each peak from the 15N-1H HSQC spectrum, and the intensity as a function of the proton frequency was fitted to a Lorentzian function (Equation 5),
 |
where T2*, w0, and C0 represent the apparent T2 relaxation time, the frequency of resonance, and the normalization constant, respectively.
Deuterium Exchange Coupled with NMR
We performed a deuterium exchange experiment according to a procedure described previously (25, 26). Briefly, for the hydrogen exchange study of the native state, lyophilized mPrP(90–231) was dissolved in 20 mm sodium acetate at pD 4.6 with 100% D2O (27) at a final protein concentration of 5.0 × 1.0−1 mm. This solution was incubated at 20 °C for up to 4 weeks, and the HSQC spectra were acquired at the desired incubation times. For the hydrogen exchange study of the A-state, lyophilized mPrP(90–231) was prepared in 20 mm glycine at pD 2.0 with 100% D2O solution at a concentration of 50 μm and stored at 20 °C. Samples were collected after incubation periods (0 min, 7.5 min, 15 min, 1 h, 2 h, 4 h, 8 h, and 16 h) and washed three times with 20 mm sodium acetate at pD 4.6 and with 100% D2O buffer prepared using Millipore Ultra 3K concentrators at 5 °C. Further, the samples were concentrated until the final concentrations of mPrP(90–231) and pD were 5.0 ± 1.0 × 1.0−1 mm and 4.6 ± 0.2, respectively, for acquiring the HSQC spectra.
We assigned 51 peaks on the HSQC spectra at pD 4.6 (i.e. 3 of 3 for S1 (residues 129–131), 6 of 7 for H1 (residues 147–153), 3 of 3 for S2 (residues 161–163), 7 of 20 for H2 (residues 174–193), 20 of 24 for H3 (residues 203–226), and 12 of 36 for the hydrophobic core (residues 132–146, 154–160, 194–202, and 227–231)). The volume of the assigned peaks was obtained using the software TOPSPIN3 (Bruker), and values were normalized as per the protein concentration. The volumes of the normalized peaks as a function of time were fitted to a single exponential curve using the nonlinear least squares methods to obtain the rate constants of deuterium exchange (kex). The protection factors were obtained based on the ratio of the intrinsic rate constants of random coil (kint) to those observed experimentally (kex). The kint value was predicted using SPHERE, which was developed by Prof. Heinrich Roder's laboratory at Fox Chase Cancer Center.
Kinetics of β-Rich Oligomer Formation
The mPrP(90–231) was incubated with a protein concentration of 70 μm, 10 mm glycine, 10 mm sodium acetate at various pH values (2.0–5.0) in an ionic strength of 160 mm (∼150 mm NaCl) at 37 °C, and the β-rich oligomer formation was monitored using size exclusion chromatography. The fraction of monomer was calculated by dividing the area of the monomeric peak (9.5–11.5 ml) by the total area in the elution profile. The fraction of the monomer as a function of time was fitted using the theoretical curve generated by assuming a second-order reaction (Equation 6),
 |
where [M]0 and [M]∞ represent the fraction of monomer at time zero and infinity, respectively, and kapp represents the apparent rate constant.
RESULTS
Molten Globule-like Partially Unfolded State at pH 2.0
We performed acid titrations to examine the conformational changes of PrPC when the pH ranged from 4.6 to 1.2 at 20 °C. The mean residue ellipticities as a function of the pH in both the far-UV (Fig. 1A) and near-UV CD region (Fig. 1B) were fitted well by the theoretically generated curves according to Equations 1 and 2, which assumed a two-state transition with a pKmid of 2.44 ± 0.06 and a ΔνH+ of 2.28 ± 0.47. All of the curves shown in Fig. 1, A and B, were fitted simultaneously using the common variables, pKmid and ΔνH+ in Equations 1 and 2 except for αN, mN, αA, and mA. Overall, the transition of PrPC obtained by reducing the pH from 4.6 to 1.2 can be described by a two-state model, which indicated the formation of a non-native state at pH 2.0. The far-UV CD spectrum indicated that the secondary structure content (α-helix (%), β-sheet (%), and turn (%)) estimated using SELCON3 for the non-native state at pH 2.0 is 26, 19, and 20%, whereas that of the native state at pH 4.6 is 39, 13, and 15% (Fig. 1C). Thus, the non-native state largely retains α-helical native-like secondary structure. In addition, the near-UV CD spectrum of the non-native state was distinct from that of both the native and unfolded state (Fig. 1D). For example, the peak at 288 nm in the non-native state was relatively close to that of the unfolded state, whereas the peak at 275 nm was relatively close to the native state (Fig. 1D), suggesting that the tertiary structures of the non-native state retained the characteristics of both the native and unfolded states.
FIGURE 1.
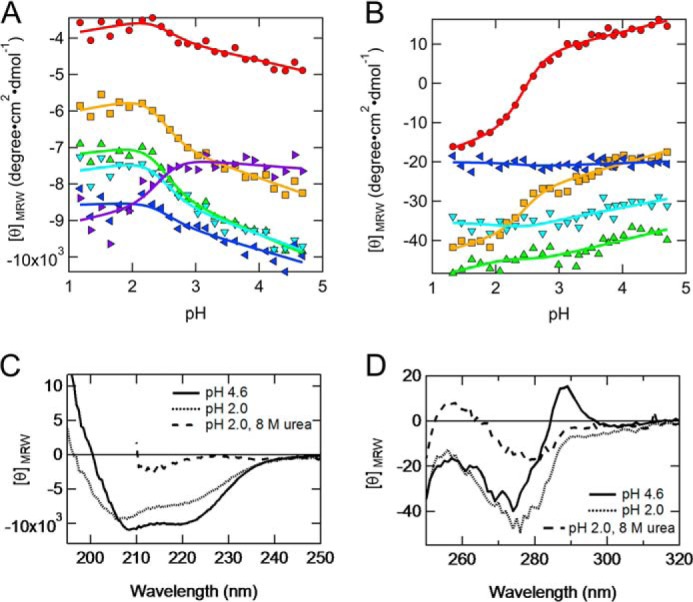
Acid titration monitored using far-/near-UV CD. A, acid titration monitored as the mean residue ellipticity at 230 (red circles), 225 (orange squares), 220 (green triangles), 215 (light blue inverted triangles), 210 (blue left-pointing triangles), and 205 nm (purple right-pointing triangles). B, acid titration monitored as the mean residue ellipticity at 288 (red circles), 281 (orange squares), 274 (green triangles), 267 (light blue inverted triangles), and 260 nm (blue left-pointing triangles). The solid curves represent the global fits to the two-state unfolding model (Equations 1 and 2). The pHmid and ΔνH values obtained were 2.44 ± 0.06 and 2.28 ± 0.47, respectively. C, far-UV CD spectra of the native state at pH 4.6 (solid curve), non-native state at pH 2.0 (dotted curve), and unfolded state at pH 2.0 with 8 m urea (dashed curve). D, near-UV CD spectra of the native state at pH 4.6 (solid curve), non-native state at pH 2.0 (dotted curve), and unfolded state at pH 2.0 with 8 m urea (dashed curve).
The acid titrations were also monitored with ANS fluorescence (Fig. 2A). In contrast to the far-/near-UV CD, ANS fluorescence as a function of pH did not exhibit a two-state transition, partially because of the acid quenching of the fluorescence below pH 2.0 (Fig. 2A). Even above pH 2.0, it was poorly fitted to the two-state transition equation (data not shown), but it was clear that the ANS fluorescence at pH 2.0 was much higher than that of both the native and unfolded states (Fig. 2B), indicating the increased hydrophobic surface area after the formation of the non-native state at pH 2.0.
FIGURE 2.
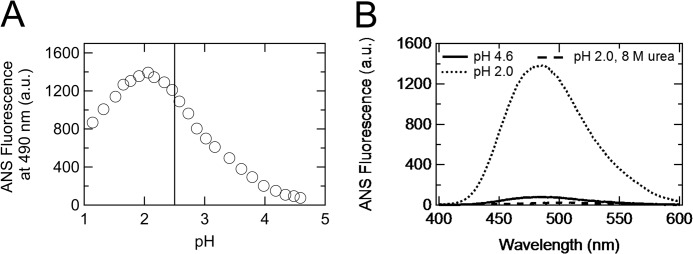
Acid titration monitored with ANS fluorescence. A, acid titration monitored with ANS fluorescence at 490 nm. The perpendicular solid line represents the midpoint of the two-state transition observed during the near- or far-UV CD monitoring. B, ANS fluorescence spectra of the native state at pH 4.6 (solid curve), non-native state at pH 2.0 (dotted curve), and unfolded state at pH 2.0, with 8 m urea (dashed curve). a.u., arbitrary units.
Overall, the non-native state at pH 2.0 was characterized by its “molten globule-like” properties (i.e. a native-like secondary structure (Fig. 1C) and increased hydrophobic surface area (Fig. 2B)) (18). In addition, the native-like tertiary structure was found to be retained relatively well, even in the non-native state at pH 2.0 (Fig. 1D), which was similar to the molten globule state of equine lysozyme (28). Thus, we conclude that the non-native state at pH 2.0 can be considered as an acid-induced molten globule state (A-state).
Furthermore, the NMR data supported the molten globule characteristics of the non-native state at pH 2.0. The 1H one-dimensional NMR spectra at pH 2.0 indicated the loss of peaks in both the methyl and aromatic regions (Fig. 3, A and B), which are characteristic for the molten globule state (18). In 15N-1H HSQC spectra of the prion protein at pH 2.0 (Fig. 3D), peaks at ∼7.5 and ∼9.0 ppm were almost absent but number of peaks at ∼8.5 ppm were increased compared with the HSQC spectra at pH 4.6 (Fig. 3C). The varied peak intensities and shapes in HSQC at pH 2.0 indicate that the non-native state is not fully unfolded (Fig. 3D). Intriguingly, the apparent T2 relaxation times of peaks in the N-terminal unfolded domain (residues 90–119) at pH 2.0 were approximately the same as those at pH 4.6 (Fig. 3E), suggesting that the flexibility in this domain is conserved in the A-state. Thus, the A-state probably maintains a monomer conformation, satisfying one of the prerequisites for molten globule states.
FIGURE 3.
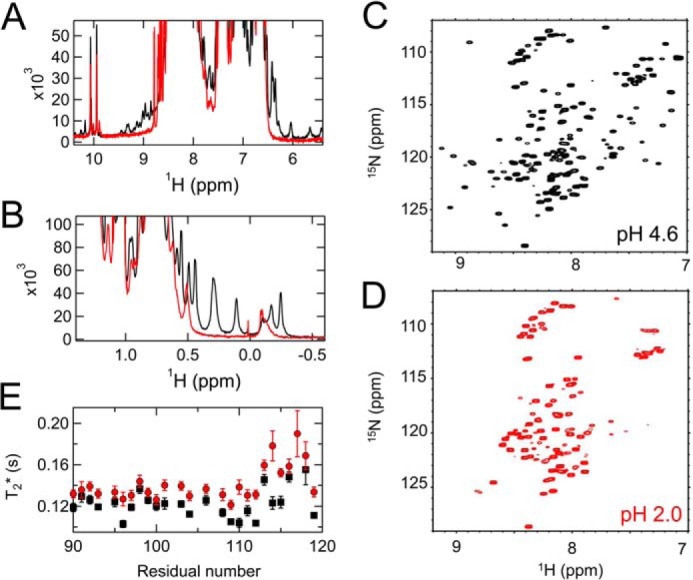
A and B, 1H one-dimensional NMR spectra of the native state at pH 4.6 (black) and the A-state at pH 2.0 (red) in the methyl (A) and aromatic regions (B). C and D, 15N-1H HSQC spectra of the native state (C) and the A-state (D). Most peaks from the C-terminal domain (7.0–7.8 or 8.6–9.0 ppm of 1H) were lost in the A-state. E, apparent T2 relaxation time of the amide protons in the N-terminal unfolded region (amino acids 90–119) in the native state (black) and A-state (red).
Low m Value and Stability of PrPC in Highly Acidic pH Conditions
To investigate the stability of the PrPC in acidic pH conditions, we next performed urea titration at various pH values by monitoring mean residue ellipticity at 220 nm ([θ]220). At the pH values tested, [θ]220 as a function of urea was well described by the two-state model (Fig. 4A). At mildly acidic pH levels (3.5–4.5), the m values were relatively independent of pH, and they almost corresponded to the theoretical m values or 0.96 ± 0.15, which were calculated based on the ΔSASA (where ΔSASA indicates changes in solvent-accessible surface area) between the native and unfolded states of PrPC (29), implying that PrPC forms a native structure under these conditions. However, at highly acidic pH (2.0–3.0), the m values were substantially low, indicating a significant decrease in cooperativity of unfolding. ΔG also decreased significantly in highly acidic pH conditions (Fig. 4B) and reached ∼0.3 kcal/mol at pH 2.0. This change in m values and ΔG under highly acidic pH is well explained by the formation of the A-state (Fig. 1, A and B), which is generally characterized by low cooperativity of unfolding as well as low stability (18).
FIGURE 4.
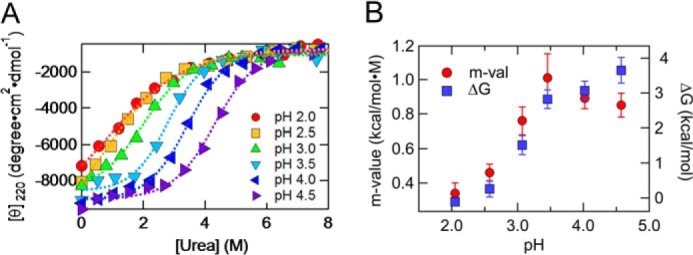
Urea titration monitored as the mean residue ellipticity at 220 nm. A, urea titrations at pH 4.6 (purple right-pointing triangles), 4.0 (blue left-pointing triangles), 3.5 (light blue inverted triangles), 3.1 (green triangles), 2.5 (orange squares), and 2.0 (red circles) were monitored as the mean residue ellipticity at 220 nm. The dotted lines represent the mean least squares fits to the two-state unfolding model (Equations 3 and 4). B, m value (red circles, left axis) and ΔG (blue squares, right axis) at various pH values obtained from Fig. 4A. Error bars, S.D.
Measurement of the Molecular Size of the A-state by Size Exclusion Chromatography
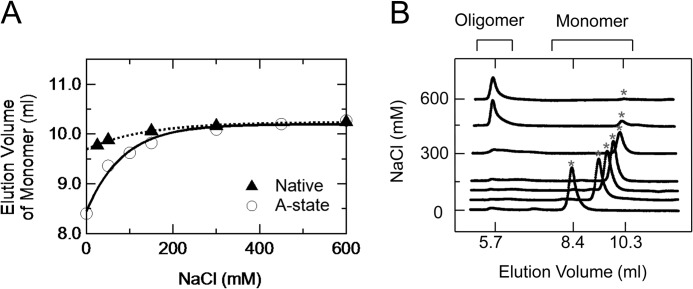
Next, We performed size exclusion chromatography to investigate the molecular size of the A-state. We initially measured the elution volumes of native state at pH 4.6 in the presence of various concentrations of NaCl (Fig. 5A). The elution volume of the native state were increased gradually by increasing the NaCl concentration. We estimated the elution volume of native state without NaCl as 9.7 ml (Fig. 5A), which corresponded to a molecular mass of 28 kDa. This mass is much larger than that predicted from the amide acid sequence in the folded domain (residues 90–231) (19 kDa), assuming a spherical shape because of the N-terminal unfolded domain of PrPC (residues 90–120). Actually, after the NaCl concentration was increased to >300 mm, the elution volume almost reached a constant value of 10.3 ml, corresponding to a molecular mass of 19 kDa. The decrease in the apparent molecular mass can be explained by the decrease of electrostatic repulsions within the unfolded domain caused by the shielding effect of NaCl.
FIGURE 5.
Size exclusion chromatography of native state and A-state with varying NaCl concentrations. A, elution volumes of native state at pH 4.6 (filled triangles) and the A-state at pH 2.0 (empty circles) as functions of the NaCl concentration. The elution volume as a function of NaCl was fitted to an exponential function, y0 + A × exp(invTau × [NaCl], where y0, A, and invTau are 1.0 ± 0.1 × 101, −5.4 ± 1.4 × 10⁻¹, and 7.4 ± 0.6 × 10⁻³, respectively, for the native state and 1.0 ± 0.2 × 101, −1.8 ± 0.3 × 100, and 1.2 ± 0.5 × 10⁻³ for the A-state. B, elution profiles of the A-state at pH 2.0 with different NaCl concentrations. The gray asterisks represent the elution peaks of the A-state. The peak around ∼5.7 ml represents the elution of the β-rich oligomer irreversibly transformed from the A-state (see also Fig. 7B).
The elution volume of the A-state at pH 2.0 also increased gradually with increasing NaCl concentration (Fig. 5, A and B). We estimated the elution volume of the A-state without NaCl as 8.4 ml (Fig. 5A), which corresponded to a molecular mass of 65 kDa. This value is larger than that of the native state or 28 kDa; therefore, the A-state of PrPC is significantly expanded rather than the native state just like a typical molten globule state (18). In contrast, the elution volume of the A-state at high NaCl concentrations was comparable with that of the native state (Fig. 5A), suggesting that the expansion in the A-state is caused by intramolecular electrostatic repulsions. Note that the secondary structural content was not affected by increasing NaCl concentration (data not shown); therefore, the change in the apparent molecular weight is not attributed to a conformational alternation of the A-state.
Structural Characterization of the A-state Based on Deuterium Exchange
To characterize the conformational properties of the A-state at amino acid resolution, we performed a deuterium exchange coupled with NMR detection at pD 2.0. 15N-uniformly labeled PrPC was initially dissolved with pD 2.0 buffer and incubated with variable times and then returned into a native condition (pD 4.6) to assign the NMR peaks. Overall protection factor of the A-state was much less than those of the native state, by 4 orders of magnitude (Fig. 6, A and B, and Table 1). The protection factor profile (Fig. 6A and Table 1) showed that the amide protons of H2 (residues 176–185) and H3 (residues 203–226) were strongly protected as compared with those of S1 (residues 129–131), H1 (residues 147–153), and S2 (residues 161–163). We also observed weak protection factors of the protons even in the hydrophobic core regions (residues 139, 154–160, 164, 166, 173, and 199–202), suggesting the loose packing characteristics of the A-state. Therefore, it is considered that the A-state forms a molten globule-like structure, where the H2-H3 region is marginally stable while the S1-H1-S2 region is largely unstable. Notably, even in PrPC at pH 4.6 (Fig. 6B and Table 1), the protection factors of the S1-H1-S2 region and hydrophobic core were 1 or 2 orders of magnitude less than those of the H2-H3 region. Fig. 6, C and D, depicts a model of conformational exchange between the A-state and native state structures.
FIGURE 6.
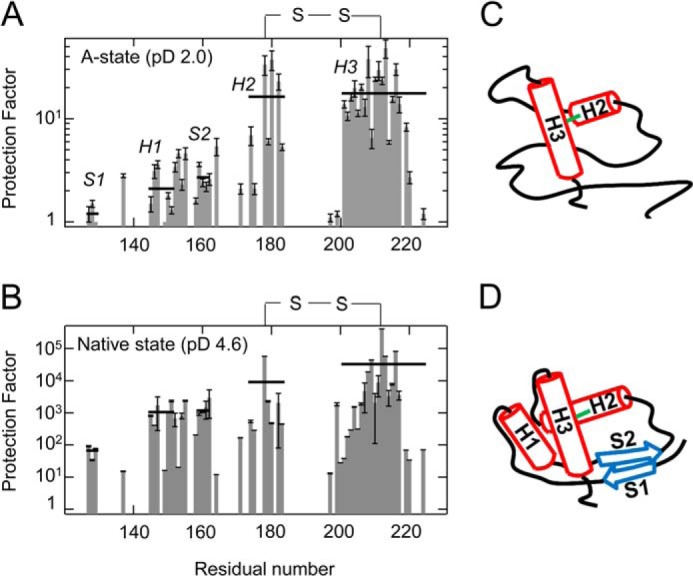
A and B, protection factors of the A-state at pD 2.0 (A) and native state at pD 4.6 (B). The solid horizontal lines represent the average protection factor within each secondary structure (S1, H1, S2, N-terminal H2, and H3). See also Table 1. C, schematic structure of the A-state, where the H2-H3 region forms a relatively stable folded structure (red solid rods), whereas the S1-H1-S2 region is highly unstable (black line). D, schematic structure of the native state based on the three-dimensional structure of PrPC (Protein Data Bank entry 1AG2). H1, H2, and H3 are shown as red solid rods, and the antiparallel β-strands are shown as blue arrows. Error bars, S.D.
TABLE 1.
Protection factors of each structure in the A-state and the native state
| A-state (pD 2.0) | Native state (pD 4.6) | |
|---|---|---|
| Strand 1 | 1.2 | 66 |
| Helix 1 | 2.1 | 1058 |
| Strand 2 | 2.7 | 1171 |
| Helix 2a | 16.3 | >9056 |
| Helix 3 | 17.6 | >32,650 |
| Tertiary hydrogen bond | 2.7 | 561 |
| Overall | 10.2 | >14,422 |
a N-terminal H2 (amino acids 174–185).
The β-Rich Oligomer Formation at pH 2.0
The β-rich oligomer formation was observed at pH 2.0 with a high salt concentration (150 mm NaCl) at 20 °C. Immediately after the start of incubation, the secondary structure of the A-state was almost the same as that in pH 2.0 solution without salt (Fig. 7A), and most of the PrPC formed the monomer (Fig. 7B). With a few h of incubation at 20 °C, the oligomerization and α-to-β transition occurred (Fig. 7, A and B). The secondary structure content of the oligomer after 4 days of incubation, which was estimated using SELCON3 (α-helix (%), β-sheet (%), and turn(%)), was 16, 34, and 21% (Fig. 7A) in contrast to the α-rich A-state (26, 19, and 20%) (Fig. 1C). Thus, the A-state is stable and monomeric without added salt but is easily aggregated into the β-rich oligomer by increasing the NaCl concentration to 150 mm.
FIGURE 7.
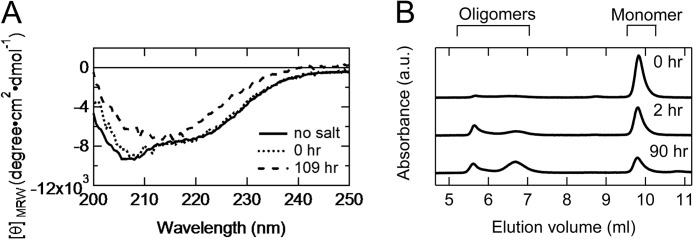
β-Rich oligomer formation at pH 2.0. A, far-UV CD spectra at pH 2.0 in the absence of 150 mm NaCl (solid curve) in the presence of 150 mm without incubation (dotted line) and in the presence of 150 mm after 4 days of incubation (dashed line). B, elution profiles after variable times of incubation at pH 2.0, 150 mm NaCl. The pH 2.0 buffer (pH 2.0, 20 mm glycine, 150 mm NaCl) was utilized for the elution buffer. This experiment was performed at 20 °C with a protein concentration of 10 μm. a.u., absorbance units.
The Rate of β-Rich Oligomer Formation Was Strongly Correlated with the Initial Fraction of A-state
The oligomerization kinetics at various pH values (pH 2.0–5.0) was monitored with the change of the monomer fraction using size exclusion chromatography. This experiment was performed at 37 °C in the presence of ∼150 mm NaCl, which mimics the physiological acidic conditions. The oligomerization kinetics at every pH value was approximately described by a second-order reaction (Equation 6) (Fig. 8A). It was clear that the oligomerization was gradually accelerated by lowing the pH from 5.0 to 2.0. This acceleration may be explained by the increase of the initial fraction of the A-state at low pH (Fig. 1, A and B) because the A-state has a tendency to form the β-rich oligomer (Fig. 7, A and B). In fact, the logarithm of the apparent rate constant (kapp) was lineally correlated with the logarithm of the initial fraction of the A-state (R2 = 0.98) (Fig. 8B). Although the detailed mechanism underlying the oligomerization process is under investigation, this linear correlation strongly suggests that the A-state is a pre-oligomer state just prior to the oligomerization reaction. Thus, the A-state is considered to be a pre-oligomer state and to play a physiologically important role in the oligomerization process occurring under physiological acidic conditions, such as in the endosome.
FIGURE 8.
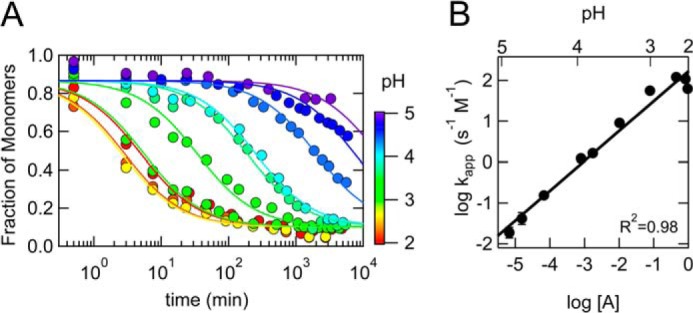
pH dependence of the oligomerization process. A, oligomerization process at various pH values (pH 2.0–5.0) monitored by the change of the monomer fraction using the size exclusion chromatography. The pH 4.6 buffer (pH 4.6, 20 mm sodium acetate, 150 mm NaCl) was utilized for the elution. The solid lines represent the least squares fits to a second-order reaction (Equation 6). [M]0 and [M]∞ values (0.87 ± 0.01 and 0.10 ± 0.01, respectively) were commonly used for the fitting. This experiment was performed at 37 °C with a protein concentration of 70 μm in the presence of ∼150 mm NaCl. B, the logarithms of the apparent rate constant (kapp) plotted against pH (top axis) and the logarithm of the initial fraction of the A-state (bottom axis), which was calculated using Equations 1 and 2 based on an acid-titration experiment at 37 °C (2.58 and 2.28 of pHmid and ΔνH, respectively). The solid line represents the least squares fit to a linear function (0.73 ± 0.04 and 2.22 ± 0.11 of the slope and the intercept, respectively).
DISCUSSION
Characterizations of the A-state Structure
In the present study, we identified the A-state of PrPC at pH 2.0 and clarified its structure using far-/near-UV CD, ANS fluorescence, and deuterium exchange. The deuterium exchange analysis revealed that the S1-H1-S2 region of the A-state was significantly fragile (Fig. 6A). Previously, a synthetic H1 peptide was shown to retain its native-like structure even at pH 2.0, although its α-helicity was decreased by 41% compared with that at pH 4.5 (30). Thus, the S1-H1-S2 region may undergo rapid exchange between the folded and unfolded structures. In contrast, the H2-H3 region should retain a relatively stable folded structure because its backbone protection factors are significantly high (Fig. 6A). The large difference in stability between the two regions may be attributed partly to the disulfide bond that connects H2 and H3 (Cys179-Cys214). Although the protection factors at the fully unfolded state have not been obtained for PrPC, those for an unfolded β-lactoglobulin (31) around the disulfide bond region (Cys106–Cys119) were shown in Fig. 5C in Ref. 31. Although the orders of magnitude of the protection factors in the unfolded β-lactoglobulin were similar to those of the A-state, residues with relatively high protection factors span only several residues from the Cys106 or Cys119. On the other hand, in the A-state, residues with the high protection factors span more than 10 residues from Cys214, as shown in Fig. 6A, suggesting that H3 regions are stabilized by interactions other than the disulfide bond, which may also stabilize the overall secondary structure of the A-state.
The A-state of PrPC was also characterized based on its native-like tertiary structure (Fig. 1D) similar to the molten globule state of equine lysozyme (28). In the molten globule state of equine lysozyme, the native-like tertiary structure was located in the region where the backbone protection factors are relatively high. Thus, the native-like tertiary structure of the A-state may be localized mainly at the H2-H3 region. Moreover, the synthetic H2-H3 peptide retained its native-like tertiary structure (32), implying that this region can maintain its native structure almost independently of the structure of the S1-H1-S2 region.
Effects of the Protonation of Charged Residue(s) on A-state Formation
The acid titration experiments (Fig. 1, A and B) showed that the pHmid and ΔνH+ values of the N-to-A transition were 2.44 ± 0.06 and 2.28 ± 0.47 at 20 °C, respectively, indicating that this transition is triggered by the protonation of two or three charged residues with pKa values of ∼2.5. We identified 4 carboxyl residues where the pKa value corresponded to the pKmid value of the N-to-A transition within an error of 1.0 using H++ (23) (Asp144, Asp147, Glu152, and Glu196) (Table 2). These residues are located on the interface between the S1-H1-S2 and H2-H3 region (Glu196) or within the S1-H1-S2 region (Asp144, Asp147, and Glu152) (Fig. 9). Thus, protonation of these residues can destabilize the S1-H1-S2 region and initiate the N-to-A transition. Moreover, three of these residues probably form a salt bridge with the neighboring residues (Asp144–Arg148, Asp147–Arg151, and Arg156–Glu196) (Fig. 9) (33), which is expected to contribute significantly to the stability of native PrPC. Thus, the protonation of charged residue(s), especially Asp144, Asp147, and Glu196, may trigger the N-to-A transition.
TABLE 2.
Predicted pKa values of the side chain carboxyl groups
| Residue | pKa |
|---|---|
| Asp144 | 2.37 |
| Glu146 | 3.93 |
| Asp147 | 2.45 |
| Glu152 | 3.30 |
| Asp167 | 3.61 |
| Asp178 | 0.65 |
| Glu196 | 2.09 |
| Glu200 | 4.07 |
| Asp202 | 0.64 |
| Glu207 | 3.66 |
| Glu211 | 3.63 |
| Glu221 | 4.17 |
FIGURE 9.
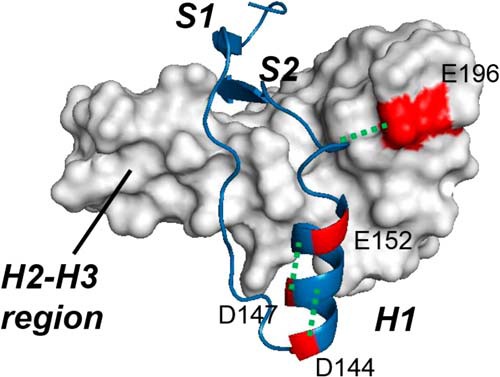
Charged residues whose protonations may trigger A-state formation. The charged residues with pKa values of 2.5 ± 1.0 are shown in red in the three-dimensional structure of native PrPC (Protein Data Bank entry 1AG2) (Asp144, Asp147, Glu152, and Glu196). The salt bridges between these residues and neighboring residues are represented as green dotted lines (Asp144–Arg148, Asp147–Arg151, and Arg158–Glu196). The S1-H1-S2 region is shown as a blue ribbon diagram, whereas the H2-H3 region is shown as a white surface diagram.
Biological Role of the A-state
The A-state is characterized by a high tendency to β-conversion (Fig. 7A) and oligomerization (Fig. 7B). Early studies suggested that PrPC transformed into a β-rich partially unfolded state at acidic pH values in the presence of salt (9). However, subsequent extensive studies revealed that this state is not monomer but oligomer (8, 10, 13) and found that high ionic strength is required to convert an α-rich monomeric PrPC into the β-rich oligomer (10, 13, 14). These studies coincide well with our current results, in which PrPC forms the A-state or a stable α-rich monomer with low ionic strength (Fig. 7B), whereas it is rapidly converted into the β-rich oligomer by adding 150 mm NaCl (Fig. 7, A and B). In addition, we showed that the rate of oligomerization at low pH (pH 2.0–5.0) in the presence of salt was strongly correlated with the initial fraction of the A-state (Fig. 8, A and B). Thus, our current study suggests that the A-state is a pre-oligomer state at low pH and that the destabilization of the S1-H1-S2 region (Fig. 6, A and C), which may be triggered by the disruption of key salt bridges (Fig. 9), is crucial to understand the oligomerization process of PrPC.
Interestingly, it has been suggested that critical interactions in H1 are involved in the pathogenic conversion mechanism (34), which has been further verified experimentally (35). An R148H mutation that disrupts the Asp144–Arg148 hydrogen bond causes symptoms similar to the sporadic Creutzfeldt-Jakob disease MV2 subtype (36). In addition, a E196K mutation is a phenotype of inherited prion disease, which typically presents a rapidly progressive dementia and ataxia (37). Thus, it is possible that the A-state, where these salt bridges are lost, is actively involved in the conversion mechanism. Actually, it has been suggested that the pathogenic conversion occurs at low pH in the endosome pathway (38). It might also be interesting to pursue whether or not the A-state corresponds to an intermediate state toward PrPSc, such as PrP* (39).
Although conformational change of the A-state into the β-rich oligomer was not clarified in the present study, the following two models were suggested as the initial process based on the A-state conformation (Fig. 6, A and C): (a) refolding of the highly unstable S1-H1-S2 region into a β-sheet structure and their subsequent intermolecular interactions (40) and (b) intermolecular interaction between the H2 and H3 regions, where the hydrophobic core is probably exposed to the solvent in the A-state because of the unstable S1-H1-S2 region (32, 41, 42). Recently, β-sheet conversion of residues 118–122 in the crystal structure of the human prion protein has been observed (43). Thus, mechanism a might be also plausible.
Drug Design
This information about the A-state structure could also facilitate drug design by stabilizing the PrPC conformation and further regulation of the conversion process (44). The A-state of the PrPC described in the present study shows that the salt bridge between Arg156 and Glu196 is crucial for maintaining the PrPC conformation and for preventing further oligomerization. It should be noted that Glu196 undergoes a slow fluctuation of the time scale between submilliseconds and milliseconds (45), which suggests that Glu196 might be actively involved in a kinetic intermediate formation. In addition, Glu196 is one of the major binding sites of GN8 (19). The interaction between Glu196 and GN8 prevents the major structural breakdown of the PrPC into the A-state. A medical chaperone (44) that stabilizes the PrPC conformation should include Glu196 in the binding region. The involvement of Asp144 and Asp147 in the binding site would further strengthen the anti-prion efficiency of the medical chaperone in terms of the structural stabilization of PrPC.
Acknowledgments
We thank the Life Science Research Center, Gifu University, for assistance with NMR measurements and Dr. Masatomo So and Prof. Yuji Goto for help with CD measurements.
This work was supported by grants from the Ministry of Health, Labor, and Welfare of Japan (Research on Measures for Intractable Diseases (Prion Disease and Slow Virus Infections and Development of Low Molecular Weight Medical Chaperone Therapeutics for Prion Diseases)) and from the Ministry of Education, Culture, Sports, Science, and Technology of Japan (grants-in-aid for scientific research and the X-ray Free Electron Laser (XFEL) Program).
- PrPC
- cellular prion protein
- PrPSc
- prion protein pathogenic isoform
- mPrP
- mouse prion protein
- H1–H3
- Helix 1–3, respectively
- S1 and S2
- Strand 1 and 2, respectively
- ANS
- 1-anilino-8-naphthalene sulfonate
- HSQC
- heteronuclear single quantum coherence.
REFERENCES
- 1. Prusiner S. B. (1998) Prions. Proc. Natl. Acad. Sci. U.S.A. 95, 13363–13383 [DOI] [PMC free article] [PubMed] [Google Scholar]
- 2. Prusiner S. B. (1982) Novel proteinaceous infectious particles cause scrapie. Science 216, 136–144 [DOI] [PubMed] [Google Scholar]
- 3. Riek R., Hornemann S., Wider G., Billeter M., Glockshuber R., Wüthrich K. (1996) NMR structure of the mouse prion protein domain PrP(121–231). Nature 382, 180–182 [DOI] [PubMed] [Google Scholar]
- 4. Pan K. M., Baldwin M., Nguyen J., Gasset M., Serban A., Groth D., Mehlhorn I., Huang Z. W., Fletterick R. J., Cohen F. E., Prusiner S. B. (1993) Conversion of α-helices into β-sheets features in the formation of the scrapie prion proteins. Proc. Natl. Acad. Sci. U.S.A. 90, 10962–10966 [DOI] [PMC free article] [PubMed] [Google Scholar]
- 5. Silveira J. R., Raymond G. J., Hughson A. G., Race R. E., Sim V. L., Hayes S. F., Caughey B. (2005) The most infectious prion protein particles. Nature 437, 257–261 [DOI] [PMC free article] [PubMed] [Google Scholar]
- 6. Masel J., Genoud N., Aguzzi A. (2005) Efficient inhibition of prion replication by PrP-Fc(2) suggests that the prion is a PrP(Sc) oligomer. J. Mol. Biol. 345, 1243–1251 [DOI] [PubMed] [Google Scholar]
- 7. Swietnicki W., Petersen R., Gambetti P., Surewicz W. K. (1997) pH-dependent stability and conformation of the recombinant human prion protein PrP(90–231). J. Biol. Chem. 272, 27517–27520 [DOI] [PubMed] [Google Scholar]
- 8. Swietnicki W., Morillas M., Chen S. G., Gambetti P., Surewicz W. K. (2000) Aggregation and fibrillization of the recombinant human prion protein huPrP90–231. Biochemistry 39, 424–431 [DOI] [PubMed] [Google Scholar]
- 9. Hornemann S., Glockshuber R. (1998) A scrapie-like unfolding intermediate of the prion protein domain PrP(121–231) induced by acidic pH. Proc. Natl. Acad. Sci. U.S.A. 95, 6010–6014 [DOI] [PMC free article] [PubMed] [Google Scholar]
- 10. Morillas M., Vanik D. L., Surewicz W. K. (2001) On the mechanism of α-helix to β-sheet transition in the recombinant prion protein. Biochemistry 40, 6982–6987 [DOI] [PubMed] [Google Scholar]
- 11. Rezaei H., Choiset Y., Eghiaian F., Treguer E., Mentre P., Debey P., Grosclaude J., Haertle T. (2002) Amyloidogenic unfolding intermediates differentiate sheep prion protein variants. J. Mol. Biol. 322, 799–814 [DOI] [PubMed] [Google Scholar]
- 12. Bjorndahl T. C., Zhou G. P., Liu X., Perez-Pineiro R., Semenchenko V., Saleem F., Acharya S., Bujold A., Sobsey C. A., Wishart D. S. (2011) Detailed biophysical characterization of the acid-induced PrPc to PrP β conversion process. Biochemistry 50, 1162–1173 [DOI] [PubMed] [Google Scholar]
- 13. Jain S., Udgaonkar J. B. (2008) Evidence for stepwise formation of amyloid fibrils by the mouse prion protein. J. Mol. Biol. 382, 1228–1241 [DOI] [PubMed] [Google Scholar]
- 14. Jain S., Udgaonkar J. B. (2010) Salt-induced modulation of the pathway of amyloid fibril formation by the mouse prion protein. Biochemistry 49, 7615–7624 [DOI] [PubMed] [Google Scholar]
- 15. Jain S., Udgaonkar J. B. (2011) Defining the pathway of worm-like amyloid fibril formation by the mouse prion protein by delineation of the productive and unproductive oligomerization reactions. Biochemistry 50, 1153–1161 [DOI] [PubMed] [Google Scholar]
- 16. Singh J., Sabareesan A. T., Mathew M. K., Udgaonkar J. B. (2012) Development of the structural core and of conformational heterogeneity during the conversion of oligomers of the mouse prion protein to worm-like amyloid fibrils. J. Mol. Biol. 423, 217–231 [DOI] [PubMed] [Google Scholar]
- 17. Bae S. H., Legname G., Serban A., Prusiner S. B., Wright P. E., Dyson H. J. (2009) Prion proteins with pathogenic and protective mutations show similar structure and dynamics. Biochemistry 48, 8120–8128 [DOI] [PMC free article] [PubMed] [Google Scholar]
- 18. Arai M., Kuwajima K. (2000) Role of the molten globule state in protein folding. Adv. Protein Chem. 53, 209–282 [DOI] [PubMed] [Google Scholar]
- 19. Kuwata K., Nishida N., Matsumoto T., Kamatari Y. O., Hosokawa-Muto J., Kodama K., Nakamura H. K., Kimura K., Kawasaki M., Takakura Y., Shirabe S., Takata J., Kataoka Y., Katamine S. (2007) Hot spots in prion protein for pathogenic conversion. Proc. Natl. Acad. Sci. U.S.A. 104, 11921–11926 [DOI] [PMC free article] [PubMed] [Google Scholar]
- 20. Julien O., Chatterjee S., Bjorndahl T. C., Sweeting B., Acharya S., Semenchenko V., Chakrabartty A., Pai E. F., Wishart D. S., Sykes B. D., Cashman N. R. (2011) Relative and regional stabilities of the hamster, mouse, rabbit, and bovine prion proteins toward urea unfolding assessed by nuclear magnetic resonance and circular dichroism spectroscopies. Biochemistry 50, 7536–7545 [DOI] [PubMed] [Google Scholar]
- 21. Karp D. A., Gittis A. G., Stahley M. R., Fitch C. A., Stites W. E., García-Moreno E. B. (2007) High apparent dielectric constant inside a protein reflects structural reorganization coupled to the ionization of an internal Asp. Biophys. J. 92, 2041–2053 [DOI] [PMC free article] [PubMed] [Google Scholar]
- 22. Sreerama N., Venyaminov S. Y., Woody R. W. (1999) Estimation of the number of α-helical and β-strand segments in proteins using CD spectroscopy. Protein Sci. 8, 370–380 [DOI] [PMC free article] [PubMed] [Google Scholar]
- 23. Gordon J. C., Myers J. B., Folta T., Shoja V., Heath L. S., Onufriev A. (2005) H++: a server for estimating pKas and adding missing hydrogens to macromolecules. Nucleic Acids Res. 33, W368–W371 [DOI] [PMC free article] [PubMed] [Google Scholar]
- 24. Riek R., Hornemann S., Wider G., Glockshuber R., Wüthrich K. (1997) NMR characterization of the full-length recombinant murine prion protein, mPrP(23–231). FEBS Lett. 413, 282–288 [DOI] [PubMed] [Google Scholar]
- 25. Jeng M. F., Englander S. W., Elöve G. A., Wand A. J., Roder H. (1990) Structural description of acid-denatured cytochrome c by hydrogen exchange and 2D NMR. Biochemistry 29, 10433–10437 [DOI] [PubMed] [Google Scholar]
- 26. Redfield C. (2004) Using nuclear magnetic resonance spectroscopy to study molten globule states of proteins. Methods 34, 121–132 [DOI] [PubMed] [Google Scholar]
- 27. Covington A. K., Paabo M., Robinson R. A., Bates R. G. (1968) Use of the glass electrode in deuterium oxide and the relation between the standardized pD (paD) scale and the operational pH in heavy water. Anal. Chem. 40, 700–706 [Google Scholar]
- 28. Morozova-Roche L. A., Arico-Muendel C. C., Haynie D. T., Emelyanenko V. I., Van Dael H., Dobson C. M. (1997) Structural characterisation and comparison of the native and A-states of equine lysozyme. J. Mol. Biol. 268, 903–921 [DOI] [PubMed] [Google Scholar]
- 29. Myers J. K., Pace C. N., Scholtz J. M. (1995) Denaturant m values and heat capacity changes: relation to changes in accessible surface areas of protein unfolding. Protein Sci. 4, 2138–2148 [DOI] [PMC free article] [PubMed] [Google Scholar]
- 30. Ziegler J., Sticht H., Marx U. C., Müller W., Rösch P., Schwarzinger S. (2003) CD and NMR studies of prion protein (PrP) helix 1: novel implications for its role in the PrPC → PrPSc conversion process. J. Biol. Chem. 278, 50175–50181 [DOI] [PubMed] [Google Scholar]
- 31. Katou H., Hoshino M., Kamikubo H., Batt C. A., Goto Y. (2001) Native-like β-hairpin retained in the cold-denatured state of bovine β-lactoglobulin. J. Mol. Biol. 310, 471–484 [DOI] [PubMed] [Google Scholar]
- 32. Adrover M., Pauwels K., Prigent S., de Chiara C., Xu Z., Chapuis C., Pastore A., Rezaei H. (2010) Prion fibrillization is mediated by a native structural element that comprises helices H2 and H3. J. Biol. Chem. 285, 21004–21012 [DOI] [PMC free article] [PubMed] [Google Scholar]
- 33. Ishikawa T., Kuwata K. (2009) Interaction analysis of the native structure of prion protein with quantum chemical calculations. J. Chem. Theory Comput. 6, 538–547 [DOI] [PubMed] [Google Scholar]
- 34. Morrissey M. P., Shakhnovich E. I. (1999) Evidence for the role of PrP(C) helix 1 in the hydrophilic seeding of prion aggregates. Proc. Natl. Acad. Sci. U.S.A. 96, 11293–11298 [DOI] [PMC free article] [PubMed] [Google Scholar]
- 35. Speare J. O., Rush T. S., 3rd, Bloom M. E., Caughey B. (2003) The role of helix 1 aspartates and salt bridges in the stability and conversion of prion protein. J. Biol. Chem. 278, 12522–12529 [DOI] [PubMed] [Google Scholar]
- 36. Pastore M., Chin S. S., Bell K. L., Dong Z., Yang Q., Yang L., Yuan J., Chen S. G., Gambetti P., Zou W. Q. (2005) Creutzfeldt-Jakob disease (CJD) with a mutation at codon 148 of prion protein gene: relationship with sporadic CJD. Am. J. Pathol. 167, 1729–1738 [DOI] [PMC free article] [PubMed] [Google Scholar]
- 37. Peoc'h K., Manivet P., Beaudry P., Attane F., Besson G., Hannequin D., Delasnerie-Laupretre N., Laplanche J. L. (2000) Identification of three novel mutations (E196K, V203I, E211Q) in the prion protein gene (PRNP) in inherited prion diseases with Creutzfeldt-Jakob disease phenotype. Hum. Mutat. 15, 482. [DOI] [PubMed] [Google Scholar]
- 38. Borchelt D. R., Taraboulos A., Prusiner S. B. (1992) Evidence for synthesis of scrapie prion proteins in the endocytic pathway. J. Biol. Chem. 267, 16188–16199 [PubMed] [Google Scholar]
- 39. Cohen F. E., Pan K. M., Huang Z., Baldwin M., Fletterick R. J., Prusiner S. B. (1994) Structural clues to prion replication. Science 264, 530–531 [DOI] [PubMed] [Google Scholar]
- 40. Wille H., Michelitsch M. D., Guenebaut V., Supattapone S., Serban A., Cohen F. E., Agard D. A., Prusiner S. B. (2002) Structural studies of the scrapie prion protein by electron crystallography. Proc. Natl. Acad. Sci. U.S.A. 99, 3563–3568 [DOI] [PMC free article] [PubMed] [Google Scholar]
- 41. Eghiaian F., Daubenfeld T., Quenet Y., van Audenhaege M., Bouin A. P., van der Rest G., Grosclaude J., Rezaei H. (2007) Diversity in prion protein oligomerization pathways results from domain expansion as revealed by hydrogen/deuterium exchange and disulfide linkage. Proc. Natl. Acad. Sci. U.S.A. 104, 7414–7419 [DOI] [PMC free article] [PubMed] [Google Scholar]
- 42. Chakroun N., Prigent S., Dreiss C. A., Noinville S., Chapuis C., Fraternali F., Rezaei H. (2010) The oligomerization properties of prion protein are restricted to the H2H3 domain. FASEB J. 24, 3222–3231 [DOI] [PubMed] [Google Scholar]
- 43. Abskharon R. N., Giachin G., Wohlkonig A., Soror S. H., Pardon E., Legname G., Steyaert J. (2014) Probing the N-terminal β-sheet conversion in the crystal structure of the human prion protein bound to a nanobody. J. Am. Chem. Soc. 136, 937–944 [DOI] [PubMed] [Google Scholar]
- 44. Kuwata K. (2013) Logical design of medical chaperone for prion diseases. Curr. Top. Med. Chem. 13, 2432–2440 [DOI] [PubMed] [Google Scholar]
- 45. Kuwata K., Kamatari Y. O., Akasaka K., James T. L. (2004) Slow conformational dynamics in the hamster prion protein. Biochemistry 43, 4439–4446 [DOI] [PubMed] [Google Scholar]


