

Background: Fatty acids affect cancer growth.
Results: Melanoma in co-cultivation with subcutaneous adipocytes has an elevated level of palmitic acid that promotes melanoma growth by activating Akt signaling in a PTEN-independent manner.
Conclusion: Subcutaneous adipocytes may be an exogenous source of palmitic acid for melanoma growth.
Significance: Targeting an exogenous supply of palmitic acid suggests a novel therapeutic in melanoma treatment.
Keywords: Adipocyte, Akt PKB, Cancer, Fatty acid, Obesity
Abstract
Tumorigenesis involves constant communication between tumor cells and neighboring normal cells such as adipocytes. The canonical function of adipocytes is to store triglyceride and release fatty acids for other tissues. This study was aimed to find out if adipocytes promoted melanoma cell growth and to investigate the underlying mechanism. Here we isolated adipocytes from inguinal adipose tissue in mice and co-cultured with melanoma cells. We found that the co-cultured melanoma had higher lipid accumulation compared with mono-cultured melanoma. In addition, fluorescently labeled fatty acid BODIPY® FLC16 signal was detected in melanoma co-cultured with the adipocytes that had been loaded with the fluorescent dye, suggesting that the adipocytes provide fatty acids to melanoma cells. Compared with mono-cultured melanoma, co-cultured melanoma cells had a higher proliferation and phospho-Akt (Ser-473 and Thr-450) expression. Overexpression of Akt mutants in melanoma cells reduced the co-culture-enhanced proliferation. A lipidomic study showed that the co-cultured melanoma had an elevated palmitic acid level. Interestingly, we found that palmitic acid stimulated melanoma cell proliferation, changed the cell cycle distribution, and increased phospho-Akt (Ser-473 and Thr-450) and PI3K but not phospho-PTEN (phosphophosphatase and tensin homolog) expressions. More importantly, the palmitic acid-stimulated proliferation was further enhanced in the Akt-overexpressed melanoma cells and was reduced by LY294002 or knockdown of endogenous Akt or overexpression of Akt mutants. We also found that palmitic acid-pretreated B16F10 cells were grown to a significantly larger tumor in mice compared with control cells. Taken together, we suggest that adipocytes may serve as an exogenous source of palmitic acid that promotes melanoma cell growth by activating Akt.
Introduction
Recent studies showing the transfer of lipids from adipocytes to cancer cells (1, 2) not only suggest the importance of lipids to tumor growth but also suggest that tumorigenesis involves constant communication between tumor cells and neighboring normal cells such as adipocytes. Indeed, adipocytes constitute a major component of the tumor microenvironment for cancer growth by secreting adipokines, cytokines, or growth hormones (3, 4). For example, adipocytes secrete leptin, which enhances colon cancer cell proliferation (5) and secret insulin-like growth factor-1 that promotes breast cancer cell growth (6). Adipocytes can also trans-differentiate into macrophages (7) and produce inflammatory cytokines such as tumor necrosis factor-α, interleukin-6 (IL-6) and IL-1β and monocyte chemoattractant protein, which lead to inflammation in the tumor microenvironment (8). More importantly, the cytokines that are secreted by the adipocytes further recruit macrophages to the site and hence further increase the levels of the inflammatory mediators (8) and promote cancers grow (9). Adipose tissue is considered as an endocrine organ that can regulate systemic energy and metabolic homeostasis (3). Nevertheless, the unique and canonical function of adipocytes is to store energy as triglyceride and release fatty acids for other tissues and organs. Interestingly, the fatty acids released from adipocytes can also provide energy for rapid tumor growth (1) and serve as building blocks for the synthesis of structural and signaling lipids to support the high proliferation of the cancer cells.
Many tumor types grow in the anatomical vicinity of adipose tissue (3). For example, in malignant melanoma patients, melanoma cells are found in subcutaneous adipose tissue (10). Interestingly, these melanoma cells are found to have higher palmitic acid levels compared with the matched skin control in the human biopsied samples (11). However, the roles of palmitic acid in melanoma are not known. The high level of palmitic acid in melanoma cells may due to a high rate of de novo lipogenesis (12). Recently, an isotopic fatty acid tracing-based metabolomics study revealed that cancer cells including melanoma incorporated exogenous palmitic acid into structural and signaling lipids (13), suggesting that exogenous fatty acids, such as palmitic acid, also play an important role in melanoma pathogenesis.
The incidence of melanoma has been rising at an alarming rate (14). Malignant melanoma is an invasive type of cancer that accounts for 75% of skin cancer-related death. On average metastatic melanoma patients can only survive for 6–9 months after diagnosis (15). It is worth noting that epidemiological studies showed a positive correlation between obesity and melanoma incidence (16, 17). Mouse melanoma models also showed that obesity promoted melanoma development and progression (18, 19). Many factors may contribute to the effects of obesity on melanoma growth. Studies showed that adipocytes released IL-6 (15) and leptin (20) to promote melanoma growth and invasion. Understanding the roles of adipocytes in promoting melanoma growth may suggest an alternate and a direct therapeutic strategy to combat malignant melanoma. In the current study we investigated if adipocytes promoted melanoma cell growth and the underlying mechanism.
EXPERIMENTAL PROCEDURES
Reagents and Cell Cultures
Antibodies for Akt, phospho-Akt (Ser-473 or Thr-308 or Thr-450), acetyl-CoA carboxylase (ACC)3, fatty acid synthase, adipocyte triglyceride lipase, hormone-sensitive lipase (HSL), the phosphorylated active form of HSL (Ser-563), phosphatidylinositide 3-kinases (PI3K), phospho-phosphatase and tensin homolog (PTEN) (Ser-370), phospho-glycogen synthase kinase3-α/β, and GAPDH were purchased from Santa Cruz Biotechnology Inc. Palmitic acid, fatty acid-free BSA, LY294002, U0126, PD98509, Oil Red O, and dimethyl sulfoxide were purchased from Sigma. All organic solvents were HPLC grade from Sigma. Melanoma B16F10, A375, G361 cell lines, and immortal human keratinocytes HaCaT cell line were purchased from ATCC (Manassas, VA). Dulbecco's modified essential medium (DMEM), fetal calf serum, penicillin, and streptomycin were purchased from Invitrogen. Cells were cultured in DMEM containing 25 mm glucose and supplemented with 10% fetal calf serum, 100 IU/ml penicillin G, and 0.1 mg/ml streptomycin at 37 °C in a 5% CO2 humidified incubator.
Animal Handling
All animal experimentation was approved and conducted in accordance with the guidelines from Hong Kong Baptist University and was endorsed by the University Human and Animal Subject Committee. Male mice C57BL/6 (C57) of age 5 weeks and body weights of 20–21 g were used for the experiments. We randomly selected mice to the control group that was fed with control diet (D12450J Research Diets), and the other mice were fed with a high fat diet (D12762 Research Diets) to induce obesity. Both diet and water were supplied ad libitum. The body weight of each mouse was recorded every week. After 3 months of dietary intervention, the diet-induced obesity (DIO) mice were used for experiments, and fat pads were excised from these mice.
Tumor Induction
C57BL/6 mice of age 5 weeks were used in this experiment. B16F10 (5 × 10⁵) cells were first treated (21) with palmitic acid (6 μm) in 1% fatty acid-free BSA for 24 h. B16F10 cells treated with 1% fatty acid-free BSA were used as a control. Tumors were then induced by subcutaneous injection of the 5 × 10⁵ palmitic acid-treated B16F10 or control B16F10 cells into the left flanks of C57 mice (21, 22). Body weight was measured every day. Tumor weights were measured after the mice were sacrificed.
Isolation of Adipocytes
Isolation of adipocytes from inguinal adipose tissues was performed as described elsewhere (23, 24). Briefly, the bilateral superficial subcutaneous white adipose deposits between the skin and muscle fascia just anterior to the lower segment of the hind limbs were dissected from mice and were digested for 1 h at 37 °C with collagenase in Krebs-Ringer Buffer (12 mm HEPES, 121 mm NaCl, 4.9 mm KCl, 1.2 mm MgSO4, and 0.33 mm CaCl2) supplemented with 3 mm glucose and 1% fatty acid-free BSA, filtered through nylon mesh. Adipocytes were collected from the upper phase after centrifugation. The isolated adipocytes were counted using a hemocytometer (1).
Adipocytes and Melanoma Cells Co-culture
We used a transwell culture system (3 μm pore size, Corning, NY) for the co-culture study (6). B16F10 or A375 or G361 or HaCaT cells (1 × 10⁵ cells) were seeded in the upper chamber, adipocytes (1 × 10⁵ or 2 × 10⁵ adipocytes) were placed in the bottom with 1.5 ml of culture medium that was DMEM medium containing 0.1% fatty acid-free BSA (1). Melanoma cells grown in mono-cultures (in the absence of adipocytes) in the culture medium were the controls.
Oil Red O Staining
Melanoma cells were stained with freshly prepared Oil Red O working solution for 20 min at room temperature as previously described (25).
Lipid Transfer Experiment
To stain the isolated adipocytes with BODIPY® FLC16 (4,4-difluoro-5,7-dimethyl-4-bora-3a,4a-diaza-s-indacene-3-hexadecanoic acid) (Molecular Probes), we incubated the isolated adipocytes with the BODIPY dye for 4 h and then washed these adipocytes with DMEM containing 0.1% fatty acid-free BSA to remove any extracellular fatty acid. Melanoma cells were incubated with these labeled adipocytes in the co-culture system. After 24 h we washed the melanoma cells with DMEM containing 0.1% fatty acid-free BSA. Images were visualized under a fluorescent microscope (1).
Cell Proliferation Assay
We measured the cell proliferation with CyQUANT® Direct Cell Proliferation Assay kit (Molecular Probe). Briefly, B16F10 or A375 or G361 or HaCaT cells (13 × 104 cells) were placed in each well of a 96-well plate. Palmitic acid at the indicated concentrations with 1% fatty acid-free BSA was added to the cells, which had been starved for 24 h in medium without serum (25). Alternatively, the 24-h starved B16F10 or A375 or G361 or HaCaT cells (1 × 10⁵ cells) were seeded in the upper chamber, and adipocytes (1 × 10⁵ adipocytes) were placed in the bottom with 1.5 ml of culture medium that was DMEM medium containing 0.1% fatty acid-free BSA (1). At the indicated time points, we incubated the cells with the detection reagent from the kit following the company's instructions. Fluorescent signals were detected by fluorescence excitation/emission maxima 480/535 nm.
Flow Cytometric Analyses of Cell Cycle Distribution
Cells were seeded at a density of 6 × 10⁴ per 60-mm dish and grown overnight. Palmitic acid (6 μm) was incubated with the cells for 24 h. Both detached and adherent cells were collected and centrifuged at 1000 × g for 5 min at 4 °C. Pellets were rinsed with ice-cold phosphate-buffered saline (PBS) and fixed with 70% ethanol for 2 h. Cells were then stained with staining buffer (PBS containing 20 μg/ml PI, 100 μg/ml RNase A, and 0.1% Triton X-100) for 15 min at 37 °C in the dark. Samples were analyzed by a flow cytometer (BD Bioscience). Cell cycle distribution was determined using Modfit software Version 3.1.
Cloning of Akt and Construction of Mutants
Homo sapiens AKT gene was cloned by a RT-PCR product that was amplified from total RNA extracted from SW480 human colon cancer cells. PCR primers were designed based on a published nucleotide sequence of human AKT1 (GenBankTM accession number AB451242.1). The primer sequences were 5′-TAGGATCCAGCGACGTGGCTATTGTGAAG-3′ (forward) and 5′-TGAATTCTCAGGCCGTGCCGCTGGCCGAG-3′ (reverse). The PCR products were then cloned into mammalian expression vector pcDNA3.1 (Invitrogen) at BamHI and EcoRI sites. AKT mutants were constructed with MutanBEST Kit(Takara, Dalian, China) following the company's instructions. Mutagenic primers were 5′-GCCTACTCGGCCAGCGGCACG-3′ (forward) and 5′-GAACTGGGGAAGTGGGGCCTGC-3′ (reverse) for the mutant S473A, 5′-GCCTTTTGCGGCACACCTGAGTACCT-3′ (forward) and 5′-GGATCAAGGACGGTGCCACCATGAAG-3′ (reverse) for the mutant T308A, and 5′-GCACCACCTGACCAAGATGACA-3′ (forward) and 5′-CGGCCCAGATGATCACCATC-3′ (reverse) for the mutant T450A. All clones were sequenced to verify the authenticity of the gene or the mutations. Transfections of the construct to melanoma cells were performed with Lipofectamine2000 (Invitrogen) following the company's instructions.
siRNA Transfections
Negative control siRNA and siRNAs targeting AKT were designed and synthesized (Shanghai GenePharma, Shanghai, China). The sequence for the control-siRNA was 5′-UUCUCCGAACGUGUCACGUTT-3′. The sequences for AKT-siRNAs were 5′-GCACCUUCAUUGGCUACAATT-3′ and 5′-UUGUAGCCAAUGAAGGUGCTT-3′. Transfections of siRNA to melanoma cells were performed with Lipofectamine2000 (Invitrogen) following the company's instructions. After siRNA transfection, expressions of Akt in the cells were examined using immunoblotting with specific antibodies. For experiments involving siRNA transfection and overexpression of construct, the cells overexpressed the construct 24 h post-siRNA transfection.
Western Blotting Analysis
Western blotting analysis was performed as described (26). Briefly, the nitrocellulose membrane (Amersham Biosciences) carrying transferred proteins were incubated at 4 °C overnight with corresponding antibody. Immunodetection was accomplished using horseradish peroxidase-conjugated secondary antibody followed by the ECL detection system (Amersham Biosciences).
Statistical Analysis
The results are expressed as the means ± S.E. Statistically significant differences were assessed by analysis of variance or 2-tailed Student's t test. A p value less than 0.05 was considered statistically significant.
Sample Preparation for LC/MS
Lipids from co-cultured and mono-cultured melanoma cells were extracted for the lipidomics study. To each sample we added 0.3 ml of 0.5 m KH2PO4, 1.5 ml of chloroform, and 0.5 ml of methanol. After vortex and centrifugation at 2000 × g, the lower phase was collected and evaporated under a nitrogen stream. The residue was reconstituted in 100 μl of isopropyl alcohol:acetonitrile (1:9, v/v) for LC/MS analysis (27).
LC/MS Analysis, Data Processing, and Statistical Analysis
An Agilent 6540 UHD Accurate-Mass Q-TOF LC/MS mass spectrometer (Agilent Technologies) was connected to an Agilent 1290 Infinity UHPLC via an electrospray ionization source for the analysis of total lipids. An Agilent 6450 Triple Quadrupole LC/MS system accompanied with a MassHunter Work station software (Version B.04.00 Qualitative Analysis, Agilent Technologies) was connected to an Agilent 1290 Infinity UHPLC for specific quantification of targeted bioactive lipids and lipid metabolites (27). Briefly, we set up a gradient mobile phase comprising solvent TL-A (40% acetonitrile with 10 mm ammonium acetate) and solvent TL-B (acetonitrile:isopropyl alcohol, 1:9) with 10 mm ammonium acetate. The raw data were first processed by a MassHunter Work station software (Version B.04.00 Qualitative Analysis, Agilent Technologies). The chromatographic and mass spectrometric parameters for the LC/MS lipidomics study were shown in supplemental Table 1. Ions were extracted by molecular features characterized by retention time, intensity in apex of chromatographic peak, and accurate mass. These results were then analyzed by Mass Profiler Professional (MPP) software (Version 2.2, Agilent Technologies). We also set up a filtration platform to further filter the initial entities before doing Principle Component Analysis (PCA). Only entities with abundances above 3000 cps were selected. These entities that then passed a tolerance window of 0.15 min and 2 mDa were chosen for alignment of retention time and m/z values, respectively. We also performed filtration with -fold change (FC) analysis to find entities with high abundance ratios between the two groups, and only entities with FC > 2.0 were selected. We employed one-way analysis of variance to do the statistical analysis. The p value of analysis of variance was set to 0.05 (corresponding with the significance level of 95%) (27). Authentic commercially available standards (Sigma) were used to confirm the identification of these target lipid species. The information of the identified lipid species was then sent for database searching using online ChemSpider data. Hexadecanoic-15,15,16,16,16-d5 acid was used as internal standard in the targeted lipidomics (27).
RESULTS
Co-cultivation with Isolated Adipocytes Increases Lipid Accumulation in Melanoma Cells
Studies have demonstrated that obesity promotes melanoma tumor growth (19, 20); therefore, we established a DIO mouse model for the study. We fed 5-week old male mice (C57BL/6) a high fat diet (Research Diets) and fed control mice a comparable control diet (Research Diets). After a 3-month dietary intervention, the percentage increase in body weight (62.06 ± 5.55% for high fat diet-fed mice; 33.49 ± 3.41% for control mice) (Fig. 1A) and the increase in white adipose tissues mass, but not the brown adipose tissue mass (Fig. 1B), were significantly higher in high fat diet-fed mice compared with control diet (CD)-fed mice, suggesting that we have established a DIO mouse model.
FIGURE 1.

Lipids and fatty acids in isolated adipocytes transferred to melanoma cells. Body weight (A) and adipose tissue mass (B) of the mice are shown. EAT, epididymal adipose tissue; SAT, subcutaneous adipose tissue; RAT, perirenal adipose tissue; BAT, brown adipose tissue; CTL, control diet-fed mice; HFD, high fat diet-fed mice. Shown is the mean ± S.E. (n = 10 mice on each diet). *, p < 0.05 compared with control. Co-cultivation with the isolated adipocytes increased Oil red O staining of lipid in B16F10 (C) and G361 and A375 (E) melanoma cells. D, transfer of fluorescently labeled fatty acid BODIPY® FLC16 from the isolated adipocyte to B16F10 melanoma cells.
Because malignant melanoma grows in the anatomical vicinity of subcutaneous adipose tissue (10), next we examined if lipids in these adipocytes transferred to melanoma cells. We dissected the inguinal adipose tissues from the DIO mice and isolated the mature adipocytes from the inguinal adipose tissues. We then co-cultured these isolated adipocytes with mouse skin melanoma cells B16F10 in the transwell culture system for 24 h as described under “Experimental Procedures.” B16F10 cells grown in mono-cultures (in the absence of adipocytes) were the controls. After 24 h we found that the co-cultured B16F10 cells had an obvious increase in cytoplasmic lipid droplet accumulation compared with the mono-cultured control cells as demonstrated by Oil Red O staining (Fig. 1C). Because Oil Red O stains neutral lipids, the staining may also recapitulate any transferred fatty acids such as palmitic acid, which can be incorporated into different lipid species including the neutral lipids in melanoma (13). To examine if the lipid accumulation in B16F10 cells was derived from the adipocytes in the co-culture system, we co-cultured B16F10 cells with the isolated adipocytes that had been loaded with fluorescently labeled fatty acid BODIPY® FLC16. We found that there was fluorescent BODIPY fatty acid FLC16 signal in these co-cultured B16F10 cells, whereas mono-cultured B16F10 cells had no fluorescent signal (Fig. 1D). The BODIPY fatty acid mimics the properties of natural fatty acid and undergoes native-like transport in cells (28). These data suggest the notion that these adipocytes provide fatty acids to B16F10 melanoma cells. We also co-cultured the isolated adipocytes with G361 and A375 cells that were derived from human malignant melanoma. As shown in Fig. 1E, co-cultured G361 and A375 human melanoma cells had an obvious increase in cytoplasmic lipid droplet accumulation compared with the mono-cultured control cells. These results further suggest that lipids from the isolated adipocytes can be transferred to melanoma cells in the co-culture system.
Co-cultivation with Isolated Adipocytes Increases Phospho-Akt Expressions in Melanoma Cells
Akt is a serine/threonine kinase, also known as protein kinase B. Akt is a positive regulator for melanoma cell proliferation and survival (29). It is known that the carboxyl-terminal regulatory domain, also referred as hydrophobic motif, contains a phosphorylation site serine (Ser-473), whose phosphorylation is required for complete activation of the kinase. Interestingly, we found that co-cultivation with adipocytes (1 × 10⁵ adipocytes) isolated from DIO mice significantly increased Akt phosphorylation at Ser-473 and Thr-450 but not at Thr-308, in A375, G361, and B16F10 melanoma cells (Fig. 2A, lane 3). Co-cultivation with more adipocytes (2 × 10⁵ adipocytes) did not decrease or further increase the phospho-Akt expressions in these cells (Fig. 2A, lane 4). Subcutaneous adipocytes isolated from CD-fed mice also significantly increased the phospho-Akt (Ser-473) expressions in these cells (Fig. 2A, lane 2), suggesting the up-regulation of phospho-Akt in the co-cultured melanoma is not specific to the adipocytes isolated from DIO mice. Moreover, co-cultivation with adipocytes also reduced phospho-glycogen synthase kinase 3 expressions in the melanoma cells (Fig. 2B).
FIGURE 2.
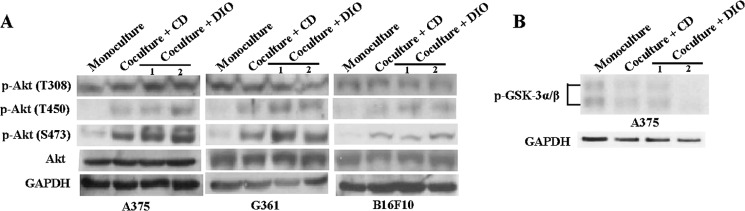
Co-cultivation with the isolated adipocytes increases phospho-Akt expressions in melanoma cells. Representative Western blot from three individual experiments showing the expressions of phospho-Akt (Thr-308, Thr-450 and Ser-473) (A) and phospho-glycogen synthase kinase-3α/β (GSK-3α/β) (B) in A375, G361, and B16F10 melanoma cells in monoculture or in co-culture. CD, co-cultured with adipocytes isolated from control diet-fed mice; DIO, co-cultured with adipocytes isolated from DIO mice; lane 1, co-cultured with 1 × 10⁵ adipocytes; lane 2, co-cultured with 2 × 10⁵ adipocytes.
Co-cultivation with Isolated Adipocytes Increases Melanoma Cell Proliferation via Activation of Akt
Because co-cultivation with adipocytes increased phospho-Akt (Ser-473 and Thr-450) expressions (Fig. 2A), we next examined if the phosphorylated Akt affected melanoma proliferation. We overexpressed wild-type Akt construct or mutated-Akt construct (S473A or T450A or T308A) (Fig. 3, A and B) in A375 melanoma cells. As shown in Fig. 3C, both the wild-type Akt-transfected and the mutated Akt-transfected A375 cells had a significant higher proliferation compared with empty vector-transfected control cells. To further confirm the proliferative effects of the overexpressed Akt, we knocked down endogenous Akt with Akt-specific siRNA (Fig. 3D) in the melanoma cells before overexpressing the AKT construct. We found that overexpression of wild-type Akt and T308A significantly increased the proliferation in these cells (Fig. 3C). These results suggest that Akt activation increases melanoma proliferation, and the Akt phosphorylation at Ser-473 and Thr-450 may play a relative important role.
FIGURE 3.

Co-cultivation with the isolated adipocytes increases proliferation in melanoma cells via activation of Akt. A, sequences of mutated Akt construct (T308A, T450A, and S473A). B, non-transfected, empty vector-transfected, wild-type Akt-transfected, and mutated Akt-transfected. D, Akt-siRNA-transfected A375 cells. C, proliferation of A375 cells overexpressed with wild-type Akt or mutated Akt with or without knockdown of endogenous Akt by Akt-specific siRNA (si). Control, empty vector-transfected cells; a, p < 0.05 compared with control; b, p < 0.05 compared with Akt-siRNA-transfected (si). E, proliferation of A375 cells with or without overexpression of wild-type Akt or mutated Akt in monoculture or in co-culture; *, p < 0.05 compared with monoculture. F, proliferation of A375 cells with Akt-siRNA transfected (si) or LY294002 (Ly) (15 μm) treatment in monoculture or in co-culture. DIO, co-cultured with adipocytes isolated from DIO mice; CD, co-cultured with adipocytes isolated from control diet-fed mice. a, p < 0.05 compared with monoculture. Proliferation of B16F10 cells (G) and HaCaT cells (H) in monoculture or in co-culture in the presence or absence of LY294002 (Ly) (15 μm). a, p < 0.05 compared with control; b, p < 0.05 compared with co-culture. Shown are the mean ± S.E. (n = 3 individual experiments; each experiment was done in triplicate.
Next, we examined if co-cultivation with adipocytes increased melanoma proliferation via Akt activation. We found that A375 cells that were overexpressed with Akt mutant (S473A or T450A or T308A) did not significantly increase proliferation after co-cultivation (Fig. 3E). Moreover, the increase in proliferation after co-cultivation was reduced if the cells were treated with Akt inhibitor LY294002 (15 μm) or with endogenous Akt knockdown (Fig. 3F). Our results also suggest that subcutaneous adipocytes isolated from CD-fed mice also increase melanoma proliferation (Fig. 3F). The notion suggesting that co-cultivation with adipocytes increases melanoma proliferation via Akt activation was further demonstrated in B16F10 cells. However, co-cultivation did not significantly increase keratinocytes proliferation (Fig. 3H).
Co-cultivation with Isolated Adipocytes Increases Palmitic Acid Levels in Melanoma Cells
Next, we found out if any lipid species contributed to the enhanced proliferation of the co-cultured melanoma cells by performing non-targeted lipidomics. Interestingly, we found that B16F10 melanoma cells had an altered lipid profile after co-culture with adipocytes isolated from DIO mice. The base peak chromatograms were different between these samples (Fig. 4A). Principle component analysis also clustered these melanoma samples with three principle components (Fig. 4B), suggesting the impact of the co-cultivation on melanoma lipid profiles. Fatty acids in these melanoma cells were differentially modulated (supplemental Table 2). Among all the identified fatty acids, palmitic acid levels was increased and was further confirmed in target lipidomics (Table 1) with hexadecanoic-15,15,16,16,16-d5 acid used as internal standard (27). Adipocytes isolated from DIO mice or CD-fed mice did not have a significant difference in the amount of palmitic acid transferred to melanoma (Table 1). Besides, we found that A375 melanoma cells and HaCaT keratinocytes also had significant elevated palmitic acid levels after co-culture with the isolated adipocytes (Table 1).
FIGURE 4.

Co-cultivation with the isolated adipocytes changes lipid profile in B16F10 melanoma cells. A, base peak chromatogram in negative mode of B16F10 melanoma samples. B, principle component analysis of B16F10 melanoma cells samples. C, expressions of ACC, fatty acid synthase (FAS), adipocyte triglyceride lipase (ATGL), HSL, and the phosphorylated active form of HSL (p-HSL) (Ser-563) in B16F10 melanoma cells. D, proliferation of B16F10 or A375 cells in monoculture or in co-culture with or without orlistat (Orl) (1 μm). *, p < 0.05 compared with monoculture. Shown are the mean ± S.E. (n = 3 individual experiments; each experiment was done in triplicate).
TABLE 1.
LC/MS-based targeted lipidomic analysis of palmitic acid levels in B16F10 and A375 melanoma cells
Shown is the mean ± S.E. (n = 5–7 individual experiments). *, p < 0.05 compared to mono-culture. SA, subcutaneous adipocytes; Orl, orlistat (1 μm).
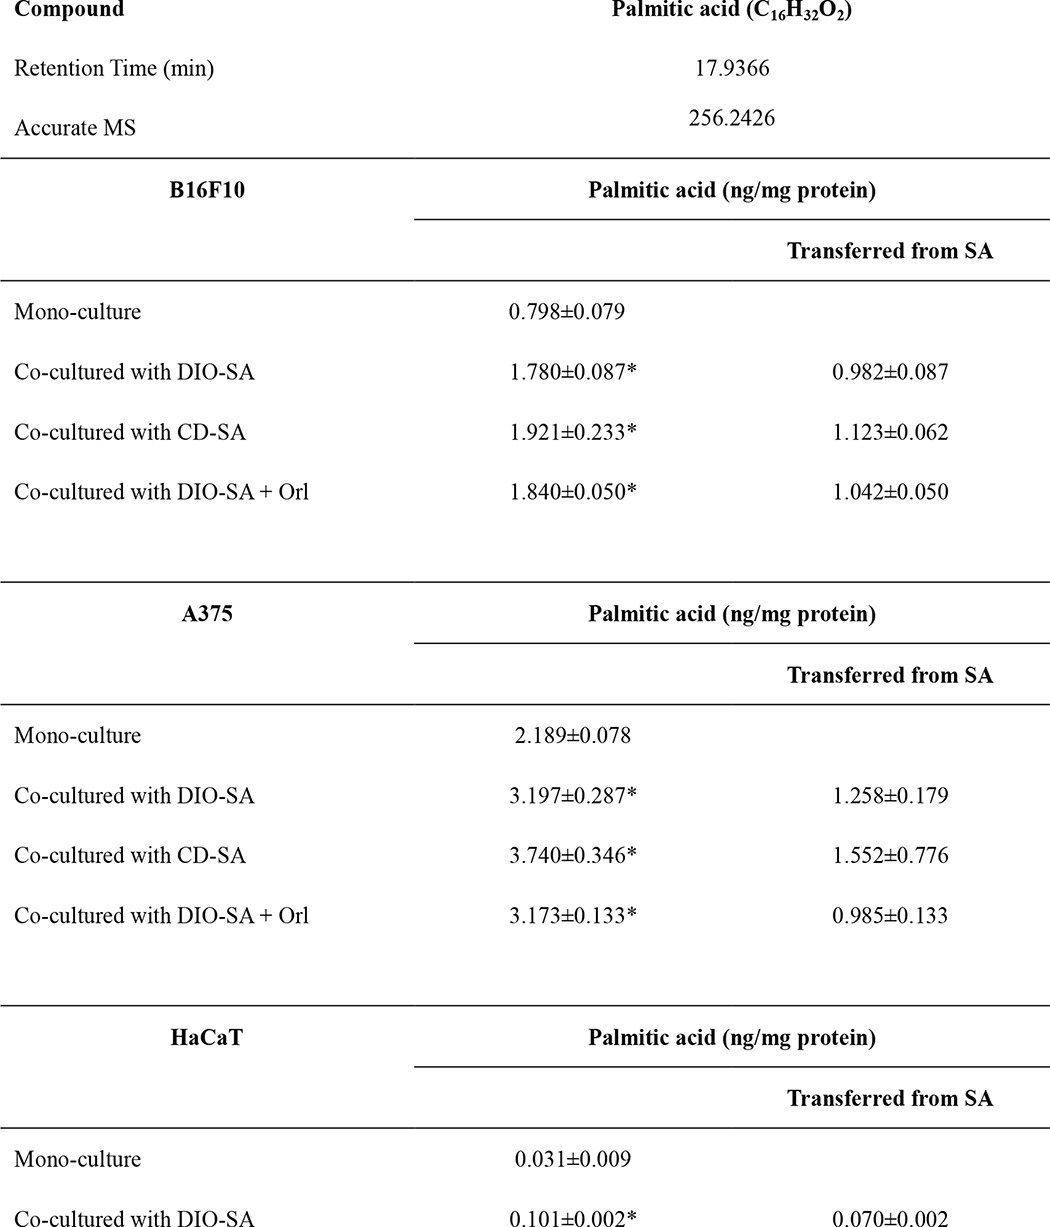
The increase in palmitic acid levels in the co-cultured melanoma was less likely due to an increase in de novo fatty acid synthesis and/or lipolysis in melanoma because expression levels of ACC), fatty acid synthase (FAS), adipocyte triglyceride lipase (ATGL), HSL, and the phosphorylated active form of HSL (p-HSL) in the melanoma cells were not significantly affected after co-culturing with the isolated adipocytes (Fig. 4C). Indeed, we also found that there was a significant increase in palmitic acid level (Table 1) and proliferation (Fig. 4D) in the co-cultured A375 and B16F10 melanoma cells in the presence of fatty acid synthase inhibitor orlistat (1 μm) (30). A study clearly demonstrated the translocation of deuterated palmitic acid from adipocytes to cancer cells (2). Concordant with this study (2), our data also suggest that palmitic acid is translocated from the isolated adipocytes to melanoma cells and hence elevates the palmitic acid level in the co-cultured melanoma. We suggest that the isolated adipocytes may act as an exogenous source of palmitic acid for the melanoma cells.
Palmitic Acid Stimulates Melanoma Cell Proliferation
Because we showed that co-cultivation with adipocytes increased cell proliferation and palmitic acid levels in melanoma, we next examined whether palmitic acid influenced melanoma cell proliferation. We treated B16F10 melanoma cells with different concentrations of palmitic acid, and we found that palmitic acid (3–50 μm) significantly stimulated B16F10 cell proliferation (Fig. 5, A and B) shortly 6 h after palmitic acid incubation (Fig. 5A). We also examined the proliferative effect of palmitic acid on human melanoma cells. Similarly, we found that palmitic acid (3–50 μm) significantly stimulated A375 (Fig. 5, C and D) and G361 (Fig. 5, E and F) but not HaCaT (Fig. 5G) cell proliferations.
FIGURE 5.

Palmitic acid stimulates melanoma cell proliferation. Proliferation of B16F10 (A and B), A375 (C and D), and G361 (E and F) melanoma cells and HaCaT (G) keratinocytes after incubating with palmitic acid at the indicated concentrations for 6 or 24 h. *, p < 0.05 compared with control. Shown are the mean ± S.E. (n = 3 individual experiments; each experiment was done in triplicate). Shown is tumor induction in C57 mice with control B16F10 cells or palmitic acid-treated (6 μm) B16F10 cells (H and J) and weight of tumors in these mice (I). *, p < 0.05 compared with control. Shown are the mean ± S.E. (n = 3–4 mice in each group).
A previous study showed that breast cancer cells that were co-cultured with adipocytes in vitro exhibited a higher invasive activity in vivo (21). To investigate if palmitic acid treatment increased melanoma cell proliferation in vivo, we pretreated A375 cells with palmitic acid (6 μm) before inoculating them into C57 mice. Interestingly, we found that palmitic acid-pretreated A375 cells were grown to a significant larger tumor compared with control A375 cells 5 days after inoculation (Fig. 5, H–J). These results suggest that palmitic acid increases melanoma grow in vivo.
Palmitic Acid Increases Phospho-Akt Expression and Hence Stimulates Proliferation in Melanoma Cells
Interestingly, we also found that palmitic acid treatment increased the expression of phospho-Akt (Ser-473 and Thr-450) in A375, G361, and B16F10 melanoma cells (Fig. 6A). More importantly, inhibition of Akt with LY294002 (15 μm) (Fig. 6B) or knockdown of endogenous Akt (Fig. 6C) significantly reduced the palmitic acid-enhanced proliferation in the melanoma. Treatment of Akt-overexpressed melanoma with LY294002 (15 μm) also significantly reduced the palmitic acid-enhanced proliferation (Fig. 6D). However, inhibition of extracellular signal-regulated kinase (ERK) by U0126 (30 μm) did not reduce the palmitic acid-stimulated proliferation in A375 (Fig. 6E) and B16F10 (Fig. 6F) melanoma cells. Inhibition of mitogen-activated protein kinase kinase (MAPKK) by PD98509 (20 μm) reduced palmitic acid-stimulated proliferation in A375 (Fig. 6E) and B16F10 (Fig. 6F) melanoma cells, although the reduction did not reach statistical significance. Further study is needed to investigate if MAPK kinase is involved in the palmitic acid-stimulated proliferation in melanoma cells.
FIGURE 6.

Palmitic acid activates Akt and hence stimulates melanoma cell proliferation. A, representative Western blot from three individual experiments showing the expressions of phospho-Akt (Thr-308, Thr-450, and Ser-473) in A375, G361, and B16F10 cells incubated with palmitic acid at the indicated concentrations. Proliferation of A375 cells with LY294002 (Ly) (15 μm) (B) treatment or with endogenous Akt knockdown (C) by Akt-siRNA transfection, incubated with palmitic acid at the indicated concentration. D, proliferation of Akt-overexpressed A375 cells incubated with palmitic acid at the indicated concentrations in the presence of LY294002 (Ly) (15 μm). Control, empty vector-transfected cells. *, p < 0.05 compared with Akt-overexpressed cells without palmitic acid treatment. Shown is proliferation of A375 cells (E) and B16F10 cells (F) incubated with palmitic acid (PA) (6 μm) in the presence or absence of LY294002 (Ly) (15 μm) or PD98509 (PD) (20 μm) or U0126 (U) (30 μm). *, p < 0.05 compared with control. A375 cells were overexpressed with wild-type Akt or Akt mutant, proliferation (G), and percentage of increase in proliferation of these cells (H). Control, empty vector-transfected cells. *, p < 0.05 compared with control; **, p < 0.01 compared with control. Shown are the mean ± S.E. (n = 3–7 individual experiments; each experiment was done in triplicate). Representative Western blot from three individual experiments showing the expressions of PI3K (I) and phospho-PTEN (Ser-370) (J) in melanoma cells incubated with palmitic acid at the indicated concentrations.
To further suggest the involvement of Akt in the palmitic acid proliferative effect, we overexpressed wild-type Akt or Akt mutant (S473A or T450A or T308A) in A375 melanoma cells before the palmitic acid (3–50 μm) challenge (Fig. 6G). We found that the palmitic acid-stimulated proliferation was significantly reduced in A375 cells that were overexpressed with the Akt mutant such as T450A and S473A (Fig. 6, G and H).
We also found that palmitic acid increased PI3K expressions in A375, G361, and B16F10 cells (Fig. 6I). However, phospho-PTEN (Ser-370) expression was not significantly affected by the palmitic acid treatment (Fig. 6J). These results suggest that palmitic acid stimulates Akt phosphorylation by increasing PI3K expression in a PTEN-independent manner. Other studies showed that palmitic acid induced reactive oxygen species generation, which mediated a signaling cascade to simulate proliferation (31) or to suppress cell viability (32) in a cell type-specific manner. Here, we found that palmitic acid (3–50 μm) did not significantly induce reactive oxygen species production in B16F10, A375, and G361 melanoma cells as indicated by 6-carboxy-2′,7′-dichlorofluorescein diacetate fluorescence signal (data not shown), suggesting reactive oxygen species is not involved in the palmitic acid-stimulated melanoma cell proliferation.
We also examined the effects of palmitic acid on B16F10, A375, and HaCaT cell cycle distribution. In control A375 melanoma cells, the percentages of G0/G1, S, and G2/M phase cells were 63.30 ± 3.52, 20.30 ± 0.41, and 12.90 ± 1.06, respectively (Table 2, top). LY294002 (15 μm) induced a G0/G1 cell cycle arrest (Table 2, top). Interestingly, palmitic acid (6 μm) treatment decreased the percentage of G0/G1 cells to 58.73 ± 6.15 and significantly increased the G2/M phase cells to 20.47 ± 4.55 (Table 2, top). The effect of palmitic acid on cell cycle distribution in melanoma cells is further suggested in B16F10 cells (Table 2, middle). Interestingly, when Akt was inhibited by LY294002 (15 μm), cell cycle distributions of the palmitic acid-treated melanoma cells were altered.
TABLE 2.
Cell cycle distributions in melanoma cells
The percentage of G0/G1, S, and G2/M phase cells are shown as indicated and presented as the mean ± S.E. (n = 3–6 individual experiments, each experiment was done in triplicate). Cells were incubated with or without palmitic acid (6 μm) in the presence or absence of LY294002 (Ly) (15 μm) for 24 h. Cell cycle distribution determined using Modfit software Version 3.1.
| Cell Cycle | Control | Control + Ly | Palmitic acid | Palmitic acid + Ly |
|---|---|---|---|---|
| % | % | % | ||
| A375 melanoma cells | ||||
| G0/G1 | 63.30 ± 3.52 | 74.71 ± 7.53 | 58.73 ± 6.15 | 80.07 ± 5.02a |
| S | 20.30 ± 0.41 | 23.04 ± 7.41 | 19.97 ± 3.24 | 9.07 ± 3.51a |
| G2/M | 12.90 ± 1.06 | 2.25 ± 0.20b | 20.47 ± 4.55b | 8.60 ± 1.94a |
| B16F10 melanoma cells | ||||
| G0/G1 | 67.59 ± 2.65 | 74.70 ± 1.92 | 63.35 ± 3.07 | 66.77 ± 4.98 |
| S | 17.15 ± 3.39 | 13.07 ± 0.64 | 16.30 ± 0.16 | 17.23 ± 3.47 |
| G2/M | 14.55 ± 0.69 | 8.80 ± 0.40b | 19.25 ± 2.32 | 13.5 ± 2.33 |
| HaCaT keratinocyte cells | ||||
| G0/G1 | 52.73 ± 4.00 | 78.83 ± 3.12b | 55.53 ± 2.66 | 60.60 ± 8.45 |
| S | 25.57 ± 1.02 | 10.67 ± 0.87 | 20.20 ± 4.77 | 22.43 ± 3.53 |
| G2/M | 20.20 ± 2.42 | 7.27 ± 1.47b | 19.20 ± 0.31 | 12.07 ± 2.98 |
a <0.05 compared to palmitic acid treatment.
b <0.05 compared to control.
In A375 melanoma cells the percentage of G0/G1 phase cells significantly increased to 80.07 ± 5.02, and the percentage of S phase and G2/M phase cells significantly decreased to 9.07 ± 3.51 and 8.60 ± 1.94, respectively (Table 2, top). In the presence of Akt inhibitor LY294002 (15 μm), the G0/G1 phase of the palmitic acid-treated B16F10 cells also increased, whereas the G2/M phase cells decreased (Table 2, middle). LY294002 (15 μm) also induced a G0/G1 cell cycle arrest in HaCaT cells (Table 2, bottom); however, palmitic acid treatment did not significantly affect the cell cycle (Table 2, bottom).These data suggest that palmitic acid via Akt activity affects melanoma cell cycle distribution.
DISCUSSION
Adipocytes are known to release adipokines and cytokines to promote tumorigenesis in a microenvironment (3). Indeed, the unique and canonical function of adipocyte is to store triglyceride and to release fatty acids for other tissues and organs (33). Here, we found that lipids were transferred from the isolated adipocytes to melanoma cells in a co-culture system. The co-cultured melanoma cells had higher phospho-Akt (Ser-473 and Thr-450) expressions and enhanced proliferation compared with mono-cultured cells. These co-cultured melanoma cells also had an elevated palmitic acid level. Interestingly, we found that palmitic acid treatment significantly increased phospho-Akt (Ser-473 and Thr-450) expressions, stimulated proliferation, and altered cell cycle distribution in melanoma cells. More importantly, the proliferative effects of palmitic acid were reduced by Akt inhibitor or knockdown of endogenous Akt or overexpression of Akt mutants. Expression of PI3K, but not phospho-PTEN, was also up-regulated by the palmitic acid treatments. We also found that palmitic acid-pretreated B16F10 cells were grown to a significant larger tumor after inoculation in mice when compared with control cells. Taken together, we suggest that the isolated adipocytes may be an exogenous source of palmitic acid, which promotes melanoma cell growth by activating Akt in a PTEN-independent manner.
PTEN plays an important role in the PI3K-Akt signaling pathway because it opposes the action of PI3K by removing a phosphate group from phosphatidylinositol 3,4,5-triphosphate. Fatty acids have been reported to regulate Akt activity in a PTEN-dependent or -independent manner (34). For example, in vascular endothelial cells, palmitic acid inhibited basal Akt phosphorylation and insulin-stimulated Akt phosphorylation by increasing PTEN transcription (35). In skeletal muscle cells, controversial results were reported. A study showed that palmitic acid reduced insulin-stimulated phosphorylation of Akt (36), and another study showed that palmitic acid stimulated Akt phosphorylation (37). However, how palmitic acid affects Akt activity in skeletal muscle is still unknown (37). Here, we suggest that palmitic acid stimulates Akt activation in melanoma by increasing PI3K expression in a PTEN-independent manner.
In the cancer cells, lipids or fatty acids can be derived from the enhanced de novo fatty acid synthesis pathways, from diet, or from the lipid-transfer from neighboring adipocytes. It has been known that cancers have altered metabolic activity. Among all the altered metabolic pathways in cancers, the enhanced de novo fatty acid synthesis or the development of “lipogenic” phenotype plays an important role in cancers. The fatty acid synthesis pathway is activated in various types of cancers, and inhibition of fatty acid synthase induces apoptosis in the cancers (26, 38), although the underlying mechanism is not well defined. Interestingly, palmitate supplementation was able to rescue the cancer cells from the apoptotic effects of the fatty acid synthase pathway inhibition (39–41). In melanoma, reducing endogenous palmitic acid/fatty acid levels by inactivating lipolytic enzyme monoacylglycerol lipase (42) or by inhibiting fatty acid synthase activity (43) causes tumorigenic impairments. Interestingly, these melanoma cells can uptake, incorporate, and utilize the exogenous palmitic acid to fuel the cancer cells pathogenicity, reduce, or reverse the impairments (13, 42). Besides melanoma, other cancers such as breast cancer cells, prostate cancer cells, and ovarian carcinoma cells can also incorporate and utilize exogenous palmitic acid to fuel the cancer cells pathogenicity (13). We focused on melanoma cells in this study because malignant melanoma grows in the anatomical vicinity of subcutaneous adipose tissue (10), which may serve as an exogenous source of the fatty acids to the cancer cells. Indeed, we showed that co-culture with subcutaneous adipocytes enhanced melanoma proliferation. Interestingly, we found that palmitic acid was also transferred from subcutaneous adipocytes to keratinocyte cells in a co-culture system (Table 1). However, co-cultivation with adipocytes (Fig. 3H) or exogenous addition of palmitic acid (Fig. 5G) did not significantly increase keratinocyte proliferation, suggesting the transferred palmitic acid has other functional roles in keratinocytes, which awaits further investigation. Our study clearly demonstrated that the co-cultured melanoma cells had enhanced levels of palmitic acid, which promotes melanoma cell growth by activating Akt. Our data not only suggest one of the pathological effects of adipocytes on melanoma cell growth in the tumor microenvironment but also suggest that limiting an exogenous supply of palmitic acid to melanoma may be a potential therapeutic strategy because it may help to inhibit melanoma cell proliferation and hence reduce tumor size or increase life expectancy, which can be used as a parameter to calculate the therapeutic index.
Indeed, tumorigenesis involves constant communication between tumor cells and neighboring cells such as macrophages (44) and/or adipocytes. The roles of adipocytes in a tumor microenvironment are receiving attention recently because of the revealed correlations between obesity and cancer growth and cancer risk (45). It is believed that adipocytes participate in a complex interplay with cancer cells and promote the tumor progression as demonstrated in many in vitro co-culture systems (15, 46, 47). For example, co-cultivation with ovarian cancer cells induces lipolysis in adipocytes and further provides fatty acids for rapid cancer growth (1). The study also demonstrates that exogenous fatty acids play an important role in tumor growth.
Palmitic acid is a saturated fatty acid and is known to have detrimental effects in cells. However, we suggest that palmitic acid has dual roles in promoting cell growth and inducing cell death. For example, palmitic acid promoted astrocytogenesis in the differentiated neural stem cells (32) and also stimulated hepatocyte proliferation (31). In our study melanoma co-cultured with adipocytes in the presence or absence of orlistat had increased proliferation and elevated palmitic acid that was found to promote melanoma cell proliferation. In cancer, mitochondria are required to restore the cytoplasmic pools of NAD+ through the malate-aspartate shuttle to support the high glycolytic flux of cancer cells (46), and recent evidence demonstrates that many cancer cells still have intact mitochondria and retain the capacity for normal mitochondrial metabolism (47, 48). Further studies are needed to suggest if the supplemented palmitic acid at 3–50 μm concentrations or at a higher concentration will be transported to mitochondria and help to restore the cytoplasmic pool of NAD+ to support the high glycolytic rate in the melanoma cells.
Increased activation of the PI3K/Akt pathway is found in up to 70% of melanomas (29, 49). Akt signaling has been reported to regulate melanoma cell survival, migration, and metastasis and contribute to melanoma chemoresistance to therapy (29, 49). Recently, it is reported that Akt in human cancer induced the glycolytic phenotype in cancer cells by phosphorylating hexokinase II to increase its association with voltage-dependent anion channel on the mitochondrial outer membrane (50). The actions of Akt render the cancer cell dependent on the availability of glucose for survival (50). Our study suggests palmitic acid is transferred from adipocytes and activates Akt in melanoma cells. However, whether the palmitic acid-activated Akt plays a role to induce glycolytic phenotype in melanoma awaits further investigation.
In conclusion, our study suggests that the isolated adipocytes may be an exogenous supply of palmitic acid that promotes melanoma cell growth via activation of Akt. These findings suggest a pathogenic role of adipocytes in melanoma growth in a microenvironment and also imply that targeting the supply of palmitic acid from adipocytes to melanoma may be an alternate and a direct strategy to combat malignant melanoma.
Supplementary Material
This work was supported in part by the Research Grant Council of SAR of Hong Kong under GRF (HKBU262512) and Hong Kong Baptist University Grants FRG2/13-14/016 and FRG1/13-14/062 and by Shenzhen STIC Grant JCYJ20120829154222473 (to Z.-L. Y.). This work was also supported by Research Grant Council of SAR of Hong Kong under GRF (HKBU260613) and Hong Kong Baptist University Grant FRG2/12-13/039 and FRG2/13-14/030 (to H. Y. K.).

This article contains supplemental Tables 1 and 2.
- ACC
- acetyl-CoA carboxylase
- PTEN
- phospho-phosphatase and tensin homolog
- HSL
- hormone-sensitive lipase
- C57
- C57BL/6
- DIO
- diet-induced obesity
- FLC16
- 4,4-difluoro-5,7-dimethyl-4-bora-3a,4a-diaza-s-indacene-3-hexadecanoic acid
- CD
- control diet.
REFERENCES
- 1. Nieman K. M., Kenny H. A., Penicka C. V., Ladanyi A., Buell-Gutbrod R., Zillhardt M. R., Romero I. L., Carey M. S., Mills G. B., Hotamisligil G. S., Yamada S. D., Peter M. E., Gwin K., Lengyel E. (2011) Adipocytes promote ovarian cancer metastasis and provide energy for rapid tumor growth. Nature Medicine 17, 1498–1503 [DOI] [PMC free article] [PubMed] [Google Scholar]
- 2. Gazi E., Gardner P., Lockyer N. P., Hart C. A., Brown M. D., Clarke N. W. (2007) Direct evidence of lipid translocation between adipocytes and prostate cancer cells with imaging FTIR microspectroscopy. J. Lipid Res. 48, 1846–1856 [DOI] [PubMed] [Google Scholar]
- 3. Nieman K. M., Romero I. L, Van Houten B, Lengyel E. (2013) Adipose tissue and adipocytes support tumorigenesis and metastasis. Biochim. Biophys. Acta 1831, 1533–1541 [DOI] [PMC free article] [PubMed] [Google Scholar]
- 4. Roberts D. L., Dive C., Renehan A. G. (2010) Biological mechanisms linking obesity and cancer risk: new perspectives. Annu. Rev. Med. 61, 301–316 [DOI] [PubMed] [Google Scholar]
- 5. Amemori S., Ootani A., Aoki S., Fujise T., Shimoda R., Kakimoto T., Shiraishi R., Sakata Y., Tsunada S., Iwakiri R., Fujimoto K. (2007) Adipocytes and preadipocytes promote the proliferation of colon cancer cells in vitro. Am. J. Physiol. Gastrointest. Liver Physiol. 292, G923–G929 [DOI] [PubMed] [Google Scholar]
- 6. D'Esposito V., Passaretti F., Hammarstedt A., Liguoro D., Terracciano D., Molea G., Canta L., Miele C., Smith U., Beguinot F., Formisano P. (2012) Adipocyte-released insulin-like growth factor-1 is regulated by glucose and fatty acids and controls breast cancer cell growth in vitro. Diabetologia 55, 2811–2822 [DOI] [PMC free article] [PubMed] [Google Scholar]
- 7. Charrière G., Cousin B., Arnaud E., André M., Bacou F., Penicaud L., Casteilla L. (2003) Preadipocyte conversion to macrophage Evidence of plasticity. J. Biol. Chem. 278, 9850–9855 [DOI] [PubMed] [Google Scholar]
- 8. Harvey A. E., Lashinger L. M., Hursting S. D. (2011) The growing challenge of obesity and cancer: an inflammatory issue. Ann. N.Y. Acad. Sci. 1229, 45–52 [DOI] [PubMed] [Google Scholar]
- 9. Khandekar M. J., Cohen P., Spiegelman B. M. (2011) Molecular mechanisms of cancer development in obesity. Nat. Rev. Cancer 11, 886–895 [DOI] [PubMed] [Google Scholar]
- 10. Proebstle T. M., Huber R., Sterry W. (1996) Detection of early micrometastases in subcutaneous fat of primary malignant melanoma patients by identification of tyrosinase-mRNA. Eur. J. Cancer 32A, 1664–1667 [DOI] [PubMed] [Google Scholar]
- 11. Abaffy T., Möller M. G., Riemer D. D., Milikowski C., DeFazio R. A. (2013) Comparative analysis of volatile metabolomics signals from melanoma and benign skin: a pilot study. Metabolomics 9, 998–1008 [DOI] [PMC free article] [PubMed] [Google Scholar]
- 12. Menendez J. A., Lupu R. (2007) Fatty acid synthase and the lipogenic phenotype in cancer pathogenesis. Nat. Rev. Cancer 7, 763–777 [DOI] [PubMed] [Google Scholar]
- 13. Louie S. M., Roberts L. S., Mulvihill M. M., Luo K., Nomura D. K. (2013) Cancer cells incorporate and remodel exogenous palmitate into structural and oncogenic signaling lipids. Biochim. Biophys. Acta 1831, 1566–1572 [DOI] [PMC free article] [PubMed] [Google Scholar]
- 14. Wangari-Talbot J., Chen S. (2012) Genetics of melanoma. Front. Genet. 3, 330. [DOI] [PMC free article] [PubMed] [Google Scholar]
- 15. Kushiro K., Chu R. A., Verma A., Núñez N. P. (2012) Adipocytes promote B16BL6 melanoma cell invasion and the epithelial-to-mesenchymal transition. Cancer Microenviron 5, 73–82 [DOI] [PMC free article] [PubMed] [Google Scholar]
- 16. Sergentanis T. N., Antoniadis A. G., Gogas H. J., Antonopoulos C. N., Adami H. O., Ekbom A., Petridou E. T. (2013) Obesity and risk of malignant melanoma: a meta-analysis of cohort and case-control studies. Eur. J. Cancer 49, 642–657 [DOI] [PubMed] [Google Scholar]
- 17. Dennis L. K., Lowe J. B., Lynch C. F., Alavanja M. C. (2008) Cutaneous melanoma and obesity in the Agricultural Health Study. Ann. Epidemiol 18, 214–221 [DOI] [PMC free article] [PubMed] [Google Scholar]
- 18. Ellerhorst J. A., Diwan A. H., Dang S. M., Uffort D. G., Johnson M. K., Cooke C. P., Grimm E. A. (2010) Promotion of melanoma growth by the metabolic hormone leptin. Oncol. Rep. 23, 901–907 [DOI] [PMC free article] [PubMed] [Google Scholar]
- 19. Kushiro K., Núñez N. P. (2011) Ob/ob serum promotes a mesenchymal cell phenotype in B16BL6 melanoma cells. Clin. Exp. Metastasis 28, 877–886 [DOI] [PubMed] [Google Scholar]
- 20. Brandon E. L., Gu J. W., Cantwell L., He Z., Wallace G., Hall J. E. (2009) Obesity promotes melanoma tumor growth: role of leptin. Cancer Biol. Ther. 8, 1871–1879 [DOI] [PMC free article] [PubMed] [Google Scholar]
- 21. Dirat B., Bochet L., Dabek M., Daviaud D., Dauvillier S., Majed B., Wang Y. Y., Meulle A., Salles B., Le Gonidec S., Garrido I., Escourrou G., Valet P., Muller C. (2011) Cancer-associated adipocytes exhibit an activated phenotype and contribute to breast cancer invasion. Cancer Res. 71, 2455–2465 [DOI] [PubMed] [Google Scholar]
- 22. Prados J., Melguizo C., Ortiz R., Boulaiz H., Carrillo E., Segura A., Rodríguez-Herva J. J., Ramos J. L., Aránega A. (2010) Regression of established subcutaneous B16-F10 murine melanoma tumors after gef gene therapy associated with the mitochondrial apoptotic pathway. Exp. Dermatol. 19, 363–371 [DOI] [PubMed] [Google Scholar]
- 23. Ahmadian M., Abbott M. J., Tang T., Hudak C. S., Kim Y., Bruss M., Hellerstein M. K., Lee H. Y., Samuel V. T., Shulman G. I., Wang Y., Duncan R. E., Kang C., Sul H. S. (2011) Desnutrin/ATGL is regulated by AMPK and is required for a brown adipose phenotype. Cell Metab. 13, 739–748 [DOI] [PMC free article] [PubMed] [Google Scholar]
- 24. Seale P., Conroe H. M., Estall J., Kajimura S., Frontini A., Ishibashi J., Cohen P., Cinti S., Spiegelman B. M. (2011) Prdm16 determines the thermogenic program of subcutaneous white adipose tissue in mice. J. Clin. Invest. 121, 96–105 [DOI] [PMC free article] [PubMed] [Google Scholar]
- 25. Hardy S., St.-Onge G. G., Joly E., Langelier Y., Prentki M. (2005) Oleate promotes the proliferation of breast cancer cells via the G protein-coupled receptor GPR40. J. Biol. Chem. 280, 13285–13291 [DOI] [PubMed] [Google Scholar]
- 26. Kwan H. Y., Yang Z., Fong W. F., Hu Y. M., Yu Z. L., Hsiao W. L. (2013) The anticancer effect of oridonin is mediated by fatty acid synthase suppression in human colorectal cancer cells. J. Gastroenterol. 48, 182–192 [DOI] [PubMed] [Google Scholar]
- 27. Kwan H. Y., Hu Y. M., Chan C. L., Cao H. H., Cheng C. Y., Pan S. Y., Tse K. W., Wu Y. C., Yu Z. L., Fong W. F. (2013) Lipidomics identification of metabolic biomarkers in chemically induced hypertriglyceridemic mice. J. Proteome Res. 12, 1387–1398 [DOI] [PubMed] [Google Scholar]
- 28. Bai J., Pagano R. E. (1997) Measurement of spontaneous transfer and transbilayer movement of BODIPY-labeled lipids in lipid vesicles. Biochemistry 36, 8840–8848 [DOI] [PubMed] [Google Scholar]
- 29. Madhunapantula S. V., Robertson G. P. (2011) Therapeutic implications of targeting AKT signaling in melanoma. Enzyme Res. 2011, 327923. [DOI] [PMC free article] [PubMed] [Google Scholar]
- 30. Kridel S. J., Axelrod F., Rozenkrantz N., Smith J. W. (2004) Orlistat is a novel inhibitor of fatty acid synthase with antitumor activity. Cancer Res. 64, 2070–2075 [DOI] [PubMed] [Google Scholar]
- 31. Wang X., Liu J. Z., Hu J. X., Wu H., Li Y. L., Chen H. L., Bai H., Hai C. X. (2011) ROS-activated p38 MAPK/ERK-Akt cascade plays a central role in palmitic acid-stimulated hepatocyte proliferation. Free Radic. Biol. Med. 51, 539–551 [DOI] [PubMed] [Google Scholar]
- 32. Wang Z., Liu D., Zhang Q., Wang J., Zhan J., Xian X., Du Z., Wang X., Hao A. (2014) Palmitic acid affects proliferation and differentiation of neural stem cells in vitro. J. Neurosci. Res 92, 574–586 [DOI] [PubMed] [Google Scholar]
- 33. Ahmadian M., Duncan R. E., Jaworski K., Sarkadi-Nagy E., Sul H. S. (2007) Triacylglycerol metabolism in adipose tissue. Future Lipidol. 2, 229–237 [DOI] [PMC free article] [PubMed] [Google Scholar]
- 34. Vinciguerra M., Veyrat-Durebex C., Moukil M. A., Rubbia-Brandt L., Rohner-Jeanrenaud F., Foti M. (2008) PTEN down-regulation by unsaturated fatty acids triggers hepatic steatosis via an NF-κBp65/mTOR-dependent mechanism. Gastroenterology 134, 268–280 [DOI] [PubMed] [Google Scholar]
- 35. Wang X. L., Zhang L., Youker K., Zhang M. X., Wang J., LeMaire S. A., Coselli J. S., Shen Y. H. (2006) Free fatty acids inhibit insulin signaling-stimulated endothelial nitric oxide synthase activation through upregulating PTEN or inhibiting Akt kinase. Diabetes 55, 2301–2310 [DOI] [PubMed] [Google Scholar]
- 36. Peng G., Li L., Liu Y., Pu J., Zhang S., Yu J., Zhao J., Liu P. (2011) Oleate blocks palmitate-induced abnormal lipid distribution, endoplasmic reticulum expansion and stress, and insulin resistance in skeletal muscle. Endocrinology 152, 2206–2218 [DOI] [PubMed] [Google Scholar]
- 37. Pu J., Peng G., Li L., Na H., Liu Y., Liu P. (2011) Palmitic acid acutely stimulates glucose uptake via activation of Akt and ERK1/2 in skeletal muscle cells. J. Lipid Res. 52, 1319–1327 [DOI] [PMC free article] [PubMed] [Google Scholar]
- 38. Furuya Y., Akimoto S., Yasuda K., Ito H. (1997) Apoptosis of androgen-independent prostate cell line induced by inhibition of fatty acid synthesis. Anticancer Res. 17, 4589–4593 [PubMed] [Google Scholar]
- 39. Chajès V., Cambot M., Moreau K., Lenoir G. M., Joulin V. (2006) Acetyl-CoA carboxylase α is essential to breast cancer cell survival. Cancer Res. 66, 5287–5294 [DOI] [PubMed] [Google Scholar]
- 40. Brusselmans K., De Schrijver E., Verhoeven G., Swinnen J. V. (2005) RNA interference-mediated silencing of the acetyl-CoA-carboxylase-α gene induces growth inhibition and apoptosis of prostate cancer cells. Cancer Res. 65, 6719–6725 [DOI] [PubMed] [Google Scholar]
- 41. Pizer E. S., Wood F. D., Pasternack G. R., Kuhajda F. P. (1996) Fatty acid synthase (FAS): a target for cytotoxic antimetabolites in HL60 promyelocytic leukemia cells. Cancer Res. 56, 745–751 [PubMed] [Google Scholar]
- 42. Nomura D. K., Long J. Z., Niessen S., Hoover H. S., Ng S. W., Cravatt B. F. (2010) Monoacylglycerol lipase regulates a fatty acid network that promotes cancer pathogenesis. Cell 140, 49–61 [DOI] [PMC free article] [PubMed] [Google Scholar]
- 43. Seguin F., Carvalho M. A., Bastos D. C., Agostini M., Zecchin K. G., Alvarez-Flores M. P., Chudzinski-Tavassi A. M., Coletta R. D., Graner E. (2012) The fatty acid synthase inhibitor orlistat reduces experimental metastases and angiogenesis in B16-F10 melanomas. Br. J. Cancer 107, 977–987 [DOI] [PMC free article] [PubMed] [Google Scholar]
- 44. Jung J. I., Cho H. J., Jung Y. J., Kwon S. H., Her S., Choi S. S., Shin S. H., Lee K. W., Park J. H. (2014) High-fat diet-induced obesity increases lymphangiogenesis and lymph node metastasis in the B16F10 melanoma allograft model: roles of adipocytes and M2-macrophages. Int. J. Cancer 10.1002/ijc.28983 [DOI] [PubMed] [Google Scholar]
- 45. Santos C. R., Schulze A. (2012) Lipid metabolism in cancer. FEBS J. 279, 2610–2623 [DOI] [PubMed] [Google Scholar]
- 46. Schulze A., Harris A. L. (2012) How cancer metabolism is tuned for proliferation and vulnerable to disruption. Nature 491, 364–373 [DOI] [PubMed] [Google Scholar]
- 47. Furuta E., Okuda H., Kobayashi A., Watabe K. (2010) Metabolic genes in cancer: their roles in tumor progression and clinical implications. Biochim. Biophys. Acta 1805, 141–152 [DOI] [PMC free article] [PubMed] [Google Scholar]
- 48. Moreno-Sánchez R., Rodríguez-Enríquez S., Marín-Hernández A., Saavedra E. (2007) Energy metabolism in tumor cells. FEBS J. 274, 1393–1418 [DOI] [PubMed] [Google Scholar]
- 49. Yajima I., Kumasaka M. Y., Thang N. D., Goto Y., Takeda K., Yamanoshita O., Iida M., Ohgami N., Tamura H., Kawamoto Y., Kato M. (2012) RAS/RAF/MEK/ERK and PI3K/PTEN/AKT signaling in malignant melanoma progression and therapy. Dermatol. Res. Pract. 2012, 354191. [DOI] [PMC free article] [PubMed] [Google Scholar]
- 50. Ralph S. J., Rodríguez-Enríquez S., Neuzil J., Moreno-Sánchez R. (2010) Bioenergetic pathways in tumor mitochondria as targets for cancer therapy and the importance of the ROS-induced apoptotic trigger. Mol. Aspects Med. 31, 29–59 [DOI] [PubMed] [Google Scholar]
Associated Data
This section collects any data citations, data availability statements, or supplementary materials included in this article.