Background: Cytochrome cd1 nitrite reductase contains heme d1 as an essential cofactor.
Results: P. aeruginosa lacking the NirN protein produces the heme d1 precursor dihydro-heme d1, which is converted by NirN to heme d1.
Conclusion: NirN catalyzes the last step of heme d1 biosynthesis.
Significance: The so far unknown function of NirN is revealed.
Keywords: Cytochrome c, Dehydrogenase, Enzyme Catalysis, Enzyme Mechanism, Heme, NirN, Denitrification, Heme d1
Abstract
Heme d1 plays an important role in denitrification as the essential cofactor of the cytochrome cd1 nitrite reductase NirS. At present, the biosynthesis of heme d1 is only partially understood. The last step of heme d1 biosynthesis requires a so far unknown enzyme that catalyzes the introduction of a double bond into one of the propionate side chains of the tetrapyrrole yielding the corresponding acrylate side chain. In this study, we show that a Pseudomonas aeruginosa PAO1 strain lacking the NirN protein does not produce heme d1. Instead, the NirS purified from this strain contains the heme d1 precursor dihydro-heme d1 lacking the acrylic double bond, as indicated by UV-visible absorption spectroscopy and resonance Raman spectroscopy. Furthermore, the dihydro-heme d1 was extracted from purified NirS and characterized by UV-visible absorption spectroscopy and finally identified by high-resolution electrospray ionization mass spectrometry. Moreover, we show that purified NirN from P. aeruginosa binds the dihydro-heme d1 and catalyzes the introduction of the acrylic double bond in vitro. Strikingly, NirN uses an electron bifurcation mechanism for the two-electron oxidation reaction, during which one electron ends up on its heme c cofactor and the second electron reduces the substrate/product from the ferric to the ferrous state. On the basis of our results, we propose novel roles for the proteins NirN and NirF during the biosynthesis of heme d1.
Introduction
The process of denitrification, i.e. the stepwise reduction of nitrate to molecular nitrogen, represents one important branch of the global biogeochemical nitrogen cycle. Moreover, for denitrifying organisms such as the human pathogen Pseudomonas aeruginosa, denitrification serves as a very efficient strategy for energy generation under anaerobic growth conditions (1). In the second step of the denitrification process, nitrite is reduced to nitric oxide. In P. aeruginosa, this reaction is catalyzed by the periplasmic cytochrome cd1 nitrite reductase NirS (2). This enzyme is a homodimer of two 60-kDa subunits, each carrying a heme c and a heme d1 cofactor (3). The non-covalently bound heme d1 represents the catalytic site of the enzyme where the reduction of nitrite to nitric oxide takes place (4).
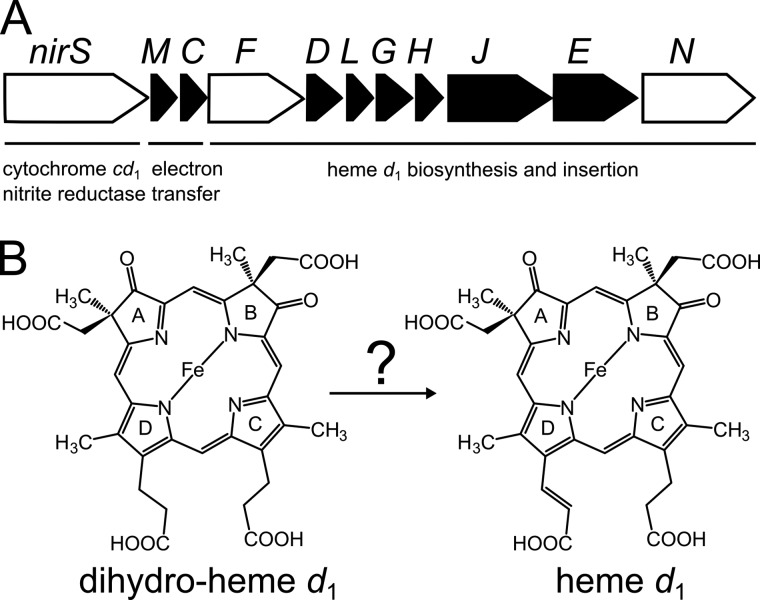
Heme d1 belongs to the tetrapyrrole subfamily of isobacteriochlorins. It carries two unusual carbonyl functions on pyrrole rings A and B and an acrylate side chain on ring D that make heme d1 unique among the naturally occurring tetrapyrroles (Fig. 1) (5, 6). The biosynthesis of heme d1 from the common tetrapyrrole precursor uroporphyrinogen III requires six enzymatic steps (7). Most of the involved enzymes are encoded by the nir genes, which are located together in the nir operon in P. aeruginosa (nirSMCFDLGHJEN) and also in other denitrifying bacteria (Fig. 1A) (8–10). In the first step, the S-adenosylmethionine-dependent uroporphyrinogen III methyltransferase NirE catalyzes the methylation of uroporphyrinogen III to precorrin-2 (11, 12). Next, precorrin 2 is converted to siroheme in two enzymatic steps catalyzed by a precorrin-2 dehydrogenase and a sirohydrochlorin ferrochelatase not encoded within the nir operon in P. aeruginosa. Siroheme is then decarboxylated to 12,18-didecarboxy-siroheme by the action of siroheme decarboxylase, which is composed of the four proteins NirD, NirL, NirG, and NirH (7). The penultimate step of heme d1 biosynthesis consists of the removal of the two propionate side chains on pyrrole rings A and B, with the concomitant introduction of the carbonyl functions at these positions yielding the heme d1 precursor dihydro-heme d1. This transformation is believed to be catalyzed by the radical S-adenosylmethionine enzyme NirJ (7). However, this hypothesis still requires experimental proof. Similarly, the enzyme responsible for the last step of heme d1 biosynthesis has not yet been identified. In this step, the propionate side chain on pyrrole ring D is converted to the corresponding acrylate side chain (Fig. 1B). At some stage of its biosynthesis, heme d1, or a precursor thereof, has to be transported across the cytoplasmic membrane to be incorporated into its target enzyme NirS in the periplasm. Currently it is thought that all heme d1 biosynthesis steps, except the last one, take place in the cytoplasm and that the final step is catalyzed in the periplasm. This hypothesis is on the basis of the finding that NirF, which has been proposed to catalyze the acrylate group formation, is a periplasmic protein (13), whereas NirE, NirDLGH, and NirJ are located in the cytoplasm.
FIGURE 1.
Heme d1 biosynthesis. A, the nir operon from P. aeruginosa comprises the genes coding for cytochrome cd1 nitrite reductase (nirS), electron transferring c-type cytochromes (nirM and nirC), and proteins involved in heme d1 biosynthesis and insertion into NirS (nirF, nirD, nirL, nirG, nirH, nirJ, nirE, and nirN). The genes encoding proteins used in this study are shown as white arrows. B, the proposed last step of heme d1 biosynthesis consists of the introduction of the double bond into the propionate side chain of pyrrole ring D of the precursor dihydro-heme d1, yielding the acrylate side chain of heme d1. Until now, the enzyme catalyzing this reaction was not known.
Depending on the organism, NirF is either a soluble periplasmic protein or attached to the outer face of the cytoplasmic membrane, most likely by a lipid anchor (14, 15). In addition to its periplasmic location, purified recombinant NirF from Paracoccus pantotrophus has been shown to bind heme d1 in vitro (13). Moreover, early mutational studies with different denitrifying bacteria have shown that the deletion of the nirF gene results in bacterial strains unable to synthesize heme d1 (8–10, 13). On the basis of all of these findings, NirF has been proposed to catalyze the formation of the acrylic double bond of heme d1. However, so far there is no direct experimental evidence clearly attributing this enzymatic function to NirF.
Interestingly, another nir gene (nirN) is present in all denitrifying bacteria. The encoded NirN protein shares about 24% amino acid sequence identity with NirS. Moreover, NirN has been shown to be located in the periplasm and to contain a heme c cofactor (16). The monomeric NirN was able to bind heme d1 in vitro and transferred the cofactor to NirS when the two proteins were mixed (12). The deletion of the nirN gene in different denitrifiers led to a mild growth phenotype, and cell-free extracts prepared from the corresponding ΔnirN strains exhibited reduced NirS activity compared with the WT strains (9, 12, 16). From these observations it was deduced that NirN is not required for heme d1 biosynthesis but, rather, might be involved in the insertion of the cofactor into NirS. In line with this proposal it has been shown that NirN from P. aeruginosa interacts with both NirS and NirF in vivo. However, in that study it was also observed by UV-visible absorption spectroscopy of periplasmic protein fractions that the cofactor content of NirS in the P. aeruginosa ΔnirN strain was different from that in the P. aeruginosa WT strain (15). Later, the same observation was reported for a ΔnirN strain of Magnetospirillum gryphiswaldense (17).
The apparently altered cofactor content of NirS in these ΔnirN strains can be rationalized by two different hypothetical scenarios: (i) NirN is involved in heme d1 insertion into NirS, and the absence of NirN leads to an improper incorporation of the cofactor causing the observed spectral differences, or (ii) NirN is involved in the last step of heme d1 biosynthesis (together with NirF?), and the absence of NirN leads to the accumulation of dihydro-heme d1, which is nevertheless inserted into NirS, leading to a different form of holo NirS with different spectral properties and reduced enzyme activity. Therefore, the aim of this study was to investigate and clarify the still enigmatic function of NirN during either heme d1 biosynthesis or insertion into NirS.
EXPERIMENTAL PROCEDURES
Chemicals
Chemicals and reagents were obtained from Sigma-Aldrich (Taufkirchen, Germany), Merck (Darmstadt, Germany), or Thermo Fisher Scientific Inc. (Schwerte, Germany). Restriction endonucleases were purchased from New England Biolabs (Frankfurt am Main, Germany). QIAquick PCR purification and gel extraction kits were purchased from Qiagen GmbH (Hilden, Germany). Q-Sepharose Fast Flow and SP-Sepharose Fast Flow were obtained from GE Healthcare. Strep-Tactin-HC resin, Desthiobiotin, and Avidin were purchased from IBA GmbH (Göttingen, Germany). All oligonucleotide primers were obtained from Metabion International AG (Martinsried, Germany).
Plasmids and Strains
The Escherichia coli strain BL21(DE3) was used as a host for protein production of recombinant semi-apo NirS (NirSs.a.), NirN, and NirF. For the production of NirSs.a. and NirN, E. coli BL21(DE3) was transformed with the plasmid pEC86 (provided by Dr. Linda Thöny-Meyer (18)) and either pET-22b(+)nirS (15) or pET-22b(+)StrepIInirN. For the production of recombinant NirF from Dinoroseobacter shibae, E. coli BL21(DE3) was transformed with pET-22b(+)nirF(D.s.)PCSStrepII. The P. aeruginosa PAO1 WT strain was used for protein production of native holo NirS (NirSWT). For protein production of native NirS containing dihydro-heme d1 (NirSΔN), the P. aeruginosa PAO1 strain RM361 (nirN::tet) was used (provided by Dr. Hiroyuki Arai (9)).
Construction of Vectors
For the construction of a NirN expression vector, the nirN gene from P. aeruginosa PAO1 was PCR-amplified using the primers strepIInirN_fw (TAT ACC ATG GGC TGG AGC CAC CCG CAG TTC GAA AAA GCT AGC GGC GAA GCG CCG GGG GAA G) and nirN_rev (CG GGA TCC TCA GTG CGA GGT TC), which contained NcoI and BamHI restriction sites (underlined), respectively. The digested nirN insert was ligated into the correspondingly digested vector pET-22b(+) to generate pET-22b(+)StrepIInirN. For the construction of an expression vector for NirF from D. shibae, the plasmid pMK-RQrbspelBnirF(D.s.)PCShis6 was purchased from Invitrogen. Through restriction of the plasmid with NdeI and HindIII, the insert pelBnirF(D.s.)PCShis6 was obtained and ligated into the correspondingly digested plasmid pET-22b(+). A Strep tag coding insert was obtained by annealing the primers CTA GTA GCG CTT GGA GCC ACC CGC AGT TCG AAA AAG and GAT CCT TTT TCG AAC TGC GGG TGG CTC CAA GCG CTA. The His tag coding sequence was removed from pET-22b(+)pelBnirF(D.s.)PCShis6 using SpeI and BamHI restriction sites, and the Strep tag coding insert was ligated into pET-22b(+)pelBnirF(D.s.)PCS to generate pET-22b(+)nirF(D.s.)PCSStrepII.
Growth Conditions
E. coli BL21(DE3) carrying the plasmids pEC86 and pET-22b(+)nirS or pET-22b(+)StrepIInirN for the production of NirSs.a. (containing the covalently bound heme c but no heme d1) and heme c containing NirN, respectively, were grown according to Studier (19) in self-inducing ZYM5052 medium containing 100 μg/ml ampicillin and 34 μg/ml chloramphenicol for 4 h at 37 °C and, subsequently, for 26 h at 25 °C. E. coli BL21(DE3) carrying the plasmid pET-22b(+)nirF(D.s.)PCSStrepII was grown in terrific broth (20) containing 100 μg/ml ampicillin to an optical density of 0.8 at 37 °C and, after induction with 100 μm isopropyl 1-thio-β-d-galactopyranoside, for 26 h at 17 °C. For the production of native NirS containing heme c and heme d1 or dihydro-heme d1, P. aeruginosa PAO1 WT or RM361, respectively, were grown under anaerobic conditions for 24 h at 37 °C in autoinducer bioassay minimal medium (according to Heydorn et al. (21)) supplied with 75 mm NaNO3 and 7.5 μm 5-aminolevulinic acid.
Purification of Proteins
The purifications of recombinant P. aeruginosa NirSs.a., native holo NirSWT, and NirSΔN were performed according to Parr et al. (22). Recombinant NirN and NirF were purified using Strep-Tactin-HC resin according to the instructions of the manufacturer (IBA GmbH) and with 50 mm Tris-HCl (pH 7.5), 150 mm NaCl as the buffer.
Determination of Protein Concentration
Bradford reagent (Sigma-Aldrich) was used to determine protein concentrations. The reagent was used according to the instructions of the manufacturer using BSA as a standard.
Extraction of Nitrite Reductase Cofactors
Heme d1 and dihydro-heme d1 were extracted from purified NirSWT and NirSΔN, respectively. Proteins at a concentration of 90 μm in buffer (50 mm Tris-HCl (pH 7.5), 150 mm NaCl) were precipitated with 6 mm HCl. Two volumes of ethyl acetate (HPLC grade) were added, and the samples were mixed for 1 min and then centrifuged for 2 min at 13000 × g. The organic cofactor-containing phase was removed and dried in vacuo. For HR-ESI-MS analysis,3 proteins were transferred to double distilled water prior to the extraction of the cofactors, and the dried cofactors were dissolved in methanol.
UV-visible Absorption Spectroscopy
UV-visible absorption spectra of purified proteins and extracted cofactors were recorded using a V-650 spectrophotometer (Jasco, Gross-Umstadt, Germany). The reduced forms of proteins and isolated cofactors were obtained by addition of a few grains of sodium dithionite.
Resonance Raman Spectroscopy
RR spectra with a spectral resolution of 2 cm−1 were recorded using a confocal Raman spectrometer (Lab Ram HR-800, Jobin Yvon) equipped with a liquid nitrogen-cooled charge-coupled device camera. The 442-nm excitation line of a He-Cd laser (Soliton) was focused onto the sample (2 μm in diameter, 1 milliwatt at the sample). Using a Linkam Cryostage THMS600 cryostat, the temperature of the sample was set to 80 K throughout the measurement. Raman shifts were calibrated to an accuracy of 0.5 cm−1 using toluene as an external standard. All spectra were corrected by polynomial background subtraction.
Heme d1 and Dihydro-Heme d1 Binding to NirN and NirF
For binding of heme d1 and dihydro-heme d1 to NirN and NirF, the in vacuo dried cofactors were directly dissolved in 150 μl of buffer (50 mm Tris-HCl (pH 7.5), 150 mm NaCl) containing either NirN at a concentration of 20 μm or NirF at a concentration of 38 μm. Directly after mixing, UV-visible absorption spectra of the mixtures were recorded on a V-650 spectrophotometer (Jasco).
NirN Activity Assay, Transfer of Cofactors to NirSs.a., and Reconstitution of NirSs.a.
The in vitro NirN activity assay was performed under aerobic or anaerobic conditions in an anaerobic chamber (Coy Laboratories, Grass Lake, MI). For the aerobic assay, dried dihydro-heme d1 was dissolved in buffer (50 mm Tris-HCl (pH 7.5), 150 mm NaCl) and transferred to a quartz cuvette (Hellma Analytics, Müllheim, Germany). NirN was subsequently added at a final concentration of 20 μm to give a final volume of 150 μl. For the anaerobic assay, the dried dihydro-heme d1 was dissolved in degassed buffer in the anaerobic chamber, followed by the addition of 20 μm NirN under anaerobic conditions. The NirN-catalyzed reaction was monitored using a V-650 spectrophotometer (Jasco). For the reconstitution of NirSs.a. with heme d1 or dihydro-heme d1 and the transfer of the NirN reaction product to NirSs.a., the enzyme was added to the NirN assay or the cofactor solution at a final concentration of 20 μm. For the oxidation of heme d1, sodium persulfate was added.
HR-ESI-MS (Accurate Mass Measurements) of Nitrite Reductase Cofactors
The sample solutions obtained after cofactor extraction were used for accurate mass measurements on an LTQ-Orbitrap Velos (ThermoFisher Scientific, Bremen, Germany). Electrospray measurements in positive mode were performed in direct infusion mode using a custom-made microspray device mounted on a Proxeon nanospray ion source. The microspray device allows sample infusion without sheath gas through a stainless steel capillary (90-μm inner diameter) at a flow rate of ∼1 μl/min. The spray voltage was set between 2.0 and 2.3 kV. The resolution of the Orbitrap mass analyzer was set to 100,000 full width at half-maximum (FWHM) at m/z 400. Accurate mass measurements were performed using the lock mass option of the instrument control software using the cation of tetradecyl-trimethylammonium bromide (256.29988 u) as an internal mass reference, which was added to the sample solution in appropriate amounts.
RESULTS AND DISCUSSION
Purification of Native NirS from the P. aeruginosa PAO1 ΔnirN Strain RM361
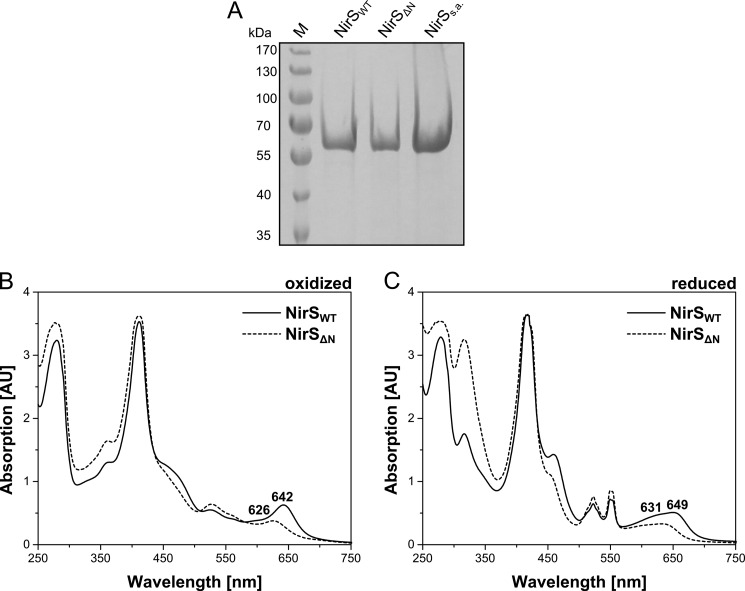
To obtain more insights into the role of NirN, the first aim of this study was to purify NirS from the P. aeruginosa PAO1 ΔnirN strain RM361 and to characterize the cofactor content of this apparently different form of holo NirS. Previous attempts to purify native NirS from the P. aeruginosa PAO1 strain RM361 only resulted in the isolation of semi-apo NirS (NirSs.a.) completely lacking heme d1 (15). Therefore, the purification protocol was changed slightly, including the reduction of the column volume of the anion exchange chromatography column. Using the new purification procedure, NirS was purified to apparent homogeneity (Fig. 2A). The enzyme purified from strain RM361 (NirSΔN) exhibited a less intense green color in contrast to the green color of NirS isolated from the WT strain (NirSWT) and the red colored semi-apo form of NirS lacking heme d1. This observation clearly supports the idea that a different form of holo NirS was produced in the P. aeruginosa ΔnirN strain.
FIGURE 2.
Purification and characterization of NirSWT and NirSΔN. A, SDS-PAGE analysis of purified native NirSWT and NirSΔN and recombinant NirSs.a. from P. aeruginosa. Lane M shows marker proteins with Mr values indicated. B and C, UV-visible absorption spectra of purified native NirSWT and NirSΔN in the oxidized (as-isolated) (B) and dithionite-reduced (C) forms. Characteristic absorption bands are labeled. AU, absorption units.
UV-visible Absorption Spectroscopy of Purified NirSΔN and NirSWT
To characterize the cofactor content of NirSΔN, UV-visible absorption spectra of the purified enzyme were recorded of the oxidized (as isolated) and dithionite-reduced forms and compared with the corresponding spectra of purified NirSWT (Fig. 2, B and C). The absorption spectra of NirSΔN are clearly different from those of NirSWT in both the oxidized and reduced forms. In fact, the spectra of the two enzymes differ, particularly in the region of the characteristic heme d1 absorption bands. Although the spectrum of oxidized NirSWT exhibits a typical heme d1 peak at 642 nm, the spectrum of NirSΔN shows a peak at 626 nm. In the reduced form, the heme d1 absorption band of NirSWT is shifted to 649 nm, whereas, for NirSΔN, a peak shift to 631 nm is observed. These spectral differences between the purified NirSΔN and NirSWT confirmed the presence of two different forms of holo NirS depending on whether the enzyme was isolated from P. aeruginosa PAO1 strain RM361 or from the WT strain. There were two possible explanations for the observed spectral differences. Either heme d1 was not properly inserted into NirSΔN and the observed differences were due to a different ligation of the cofactor, or it was not heme d1 but the precursor dihydro-heme d1 that was present in NirSΔN. On the basis of the observed UV-visible absorption spectra of NirSΔN, we favored the second hypothesis. The conjugated system of dihydro-heme d1 lacks one double bond compared with heme d1. For this reason, the absorption maxima of dihydro-heme d1 can be expected to be located at shorter wavelengths than those of heme d1 (hypsochromic shift). Indeed, such a shift was observed for the absorption maximum of NirSΔN (626 nm, oxidized) compared with the heme d1-containing NirSWT (642 nm, oxidized).
Resonance Raman Spectroscopy of NirSΔN, NirSWT and NirSs.a.
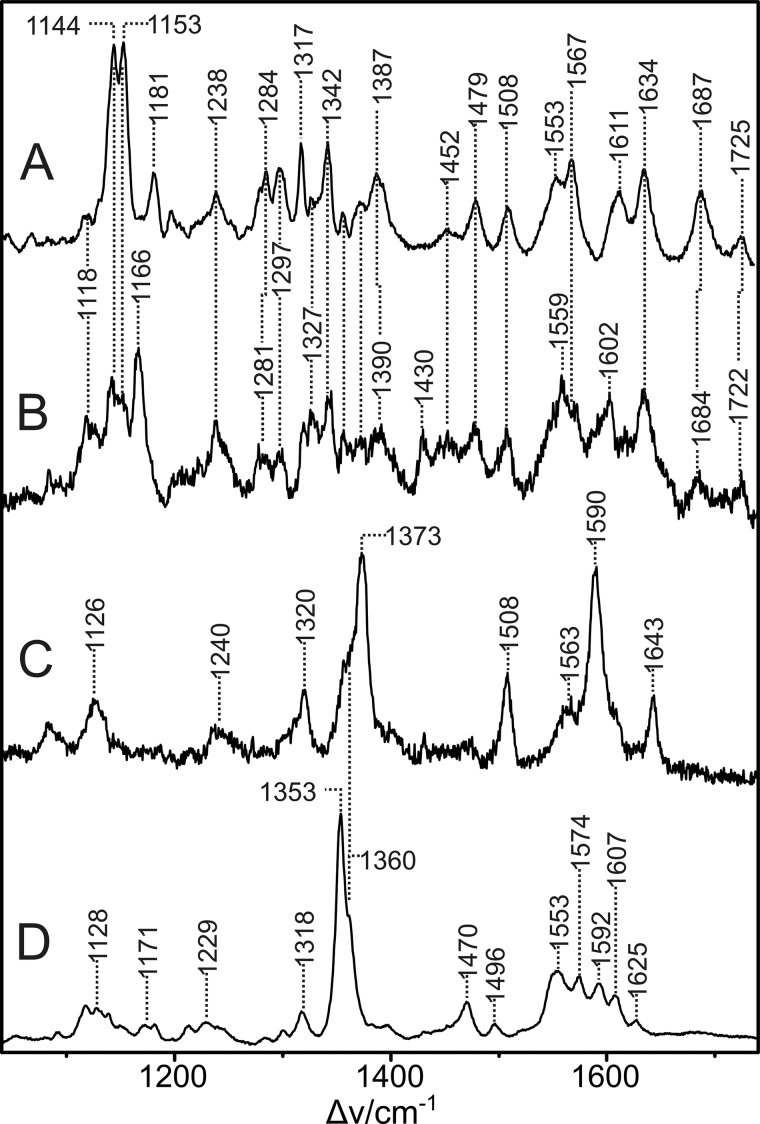
To further characterize the unusual cofactor content of NirSΔN and to obtain more insights into the question of whether dihydro-heme d1 is indeed bound in NirSΔN, resonance Raman (RR) spectroscopy was performed. RR spectra of purified NirSWT, NirSΔN, and semi-apo NirS were measured at low temperature to reduce the strong background scattering and to increase the signal-to-noise ratio. Although, upon 413-nm excitation, the heme c bands were selectively enhanced (data not shown), 442-nm excitation led to a substantial increase of the spectral mass of heme d1 and the putative dihydro-heme d1 in NirSWT and NirSΔN, respectively. Remaining contributions of heme c could readily be removed by subtracting the spectra of NirSs.a. from those of NirSWT and NirSΔN, using the characteristic bands of heme c as a reference (Fig. 3, C and D). Therefore, pure spectra of heme d1 and the putative precursor were obtained in the oxidized (as-isolated) state (Fig. 3, A and B). The spectrum of ferric heme d1 (Fig. 3A) differs substantially from that of heme c, which, because of its higher symmetry (D4h), is dominated by the totally symmetric A1g modes (Fig. 3C) (23). In contrast, the low symmetry of heme d1 leads to numerous RR-active modes that are not related to the heme c bands. As a consequence, well established empirical relationships for iron porphyrins between band frequencies above 1300 cm−1 and the oxidation, spin, and coordination state of iron (24) cannot be extended to heme d1 and, therefore, most of its bands must remain unassigned. Remarkable exceptions are the bands at 1687 and 1725 cm−1, which originate from the C=O stretching modes of the keto groups and the carboxyl function of the acrylic side chain, respectively. Note that differences between the spectrum in Fig. 3A and a spectrum of oxidized cd1 published previously (25) are likely to be due to different excitation lines and temperatures.
FIGURE 3.
RR spectra of NirSWT, NirSΔN, and semi-apo NirS measured with 442-nm excitation at 80 K. A, oxidized heme d1 of NirSWT. B, oxidized dihydro-heme d1 of NirSΔN. C, oxidized heme c of semi-apo NirS. D, reduced heme c of semi-apo NirS. The spectra in A and B were obtained by subtracting the heme c contributions (spectra C and D) from the spectra of the (as-isolated) enzymes NirSWT and NirSΔN, respectively. The spectra of the oxidized heme c (C) and reduced heme c (D) were generated by mutual spectra subtraction of the as-isolated (mainly oxidized) and dithionite-reduced semi-apo NirS because the spectrum of the pure oxidized semi-apo NirS cannot be measured directly because of photoreduction at low temperatures. Note that the ferrous heme c in semi-apo NirS undergoes an unprecedented reversible temperature-dependent transition from the low-spin to the high-spin configuration. The latter prevails at 80 K, as indicated by the characteristic marker bands at 1353, 1470, and 1607 cm−1 (24, 32).
As already expected from the weaker absorbance at 442 nm for NirSΔN compared with NirSWT (Fig. 2), the RR spectrum of the putative heme d1 precursor suffers from a substantially weaker resonance enhancement compared with heme d1 (Fig. 3B). Despite the relatively poor signal-to-noise ratio, the comparison of both spectra demonstrates that most of the bands of heme d1 also have counterparts within ± 3 cm−1 in the spectrum of the potential heme d1 precursor, albeit with quite different relative intensities. Therefore, we conclude that the ground state structure of heme d1 and its precursor are similar but not identical. This conclusion is consistent with the assignment of the heme d1 precursor to a dihydro-heme d1. Moreover, among the few bands of NirSWT for which conjugate bands in NirSΔN are not immediately evident, the bands at 1611 and 1181 cm−1 may be attributed to modes involving the C=C and C-(C=C) stretching coordinates, taking into account previous assignments of modes involving the vinyl substituents in protoporphyin IX (26–29). Furthermore, assuming a dihydro-heme d1 in NirSΔN, the different intensity pattern compared with the spectrum of heme d1 can readily be understood because the extension of the delocalized π-electron system affects both the absolute and relative RR intensities.
NirSΔN Contains Dihydro-Heme d1
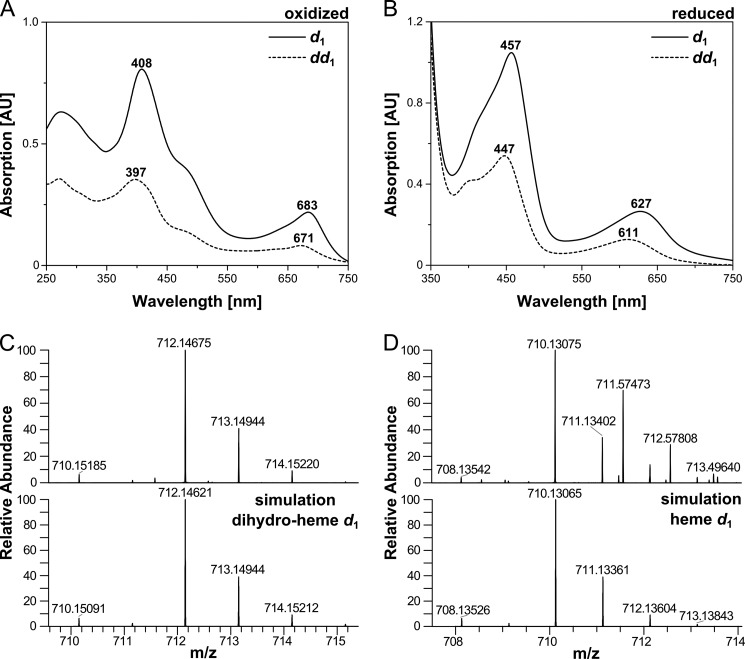
The results of the experiments described so far strongly suggest that the heme d1 precursor dihydro-heme d1 might indeed be bound in NirSΔN. To finally clarify this question, the non-covalently bound heme d1 (or possibly dihydro-heme d1) was extracted from the purified NirSWT and NirSΔN as described under “Experimental Procedures.” Then, UV-visible absorption spectra of the oxidized and dithionite-reduced forms were recorded (Fig. 4, A and B). The absorption spectrum of the heme d1 cofactor extracted from NirSWT exhibits characteristic peaks at 408 and 683 nm and a shoulder at about 476 nm in the oxidized state, as reported previously (30, 31). In contrast, the spectrum of the oxidized form of the cofactor extracted from NirSΔN shows absorption maxima at 397 and 671 nm and also a shoulder at about 476 nm. After dithionite reduction, the absorption bands of the heme d1 extracted from NirSWT are shifted to 457 and 627 nm, whereas those of the cofactor extracted from NirSΔN are shifted to 447 and 611 nm. Again, these observations strongly suggest that the cofactor isolated from NirSΔN was indeed different from the heme d1 extracted from NirSWT. As described above, we suspected that the heme d1 precursor dihydro-heme d1 lacking the acrylic double bond might be present in NirSΔN. The UV-visible absorption spectra of the isolated cofactor are in line with this proposal because the characteristic heme d1 absorption band at 683 nm in the oxidized state is shifted to a shorter wavelength by about 10 nm in the case of the cofactor from NirSΔN, and the corresponding band of heme d1 in the reduced state at 627 nm is shifted by about 15 nm in this case. Such a hypsochromic shift would be expected for dihydro-heme d1 because of the lacking double bond (6).
FIGURE 4.
Characterization of cofactors extracted from NirSWT and NirSΔN. A and B, UV-visible absorption spectra of heme d1 extracted from purified NirSWT (d1) and of dihydro-heme d1 extracted from purified NirSΔN (dd1) in the oxidized (as-isolated) (A) and dithionite-reduced (B) forms. Characteristic absorption bands are labeled. C and D, HR-ESI-MS analysis of the dihydro-heme d1 extracted from NirSΔN (C) and of heme d1 extracted from NirSWT (D). The top panels show the experimental mass and isotopic pattern of the [M+H]+ ions, and the bottom panels show the calculated mass spectra of dihydro-heme d1 (C) and heme d1 (D), respectively. Note that the measured masses 711.57473, 712.57808, and 713.49640 in D originate from an uncharacterized impurity present in the heme d1 sample. AU, absorption units.
Finally, we determined the exact mass of the cofactor extracted from NirSΔN by HR-ESI-MS. This method revealed a mass of 712.14675 for the [M+H]+ ion, which is indeed in accordance with the calculated mass (712.14621), isotopic pattern and chemical formula of dihydro-heme d1 (Fig. 4C). For comparison, the mass of the heme d1 extracted from NirSWT was also determined by HR-ESI-MS. The measured value of 710.13075 for the [M+H]+ ion is in excellent agreement with the theoretical mass (710.13065), isotopic pattern and chemical formula of heme d1 as expected (Fig. 4D). Moreover, the mass difference between the two cofactors isolated from either NirSΔN or NirSWT corresponds to the two hydrogen atoms that are present in dihydro-heme d1 (NirSΔN) but absent in heme d1 (NirSWT) because of the dehydrogenation of the propionate side chain of pyrrole ring D.
On the basis of all of the results described so far, we conclude that, in the absence of NirN in the bacterial cell, the formation of the acrylic double bond of heme d1 does not take place and that dihydro-heme d1 is inserted into NirSΔN. This novel finding led to the question whether NirN itself catalyzes the dehydrogenation reaction, which would be completely unexpected, or whether NirF catalyzes the double bond formation, as proposed previously, but with the help of NirN. These two possibilities were tested in vitro, and the results are described in the following section.
Purified, Recombinant NirN from P. aeruginosa Catalyzes the Conversion of Dihydro-heme d1 to Heme d1 in Vitro
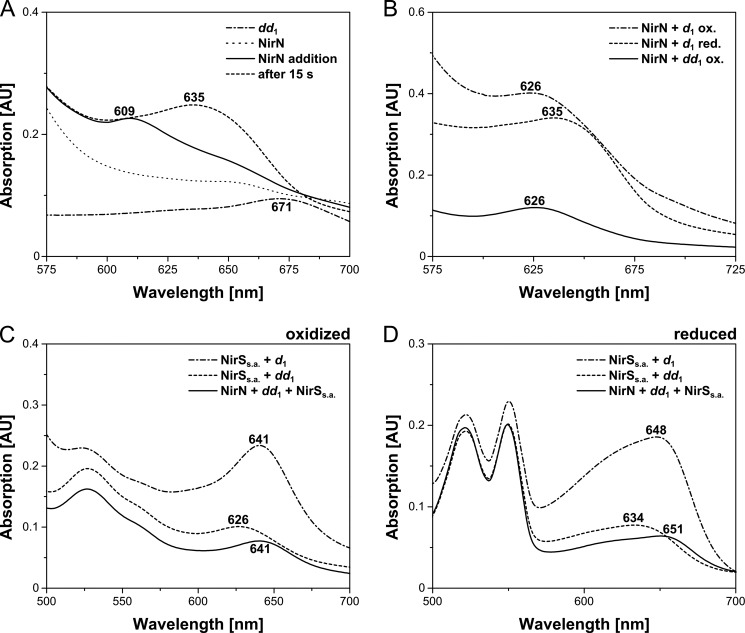
To test whether NirN is able to catalyze the dehydrogenation of the propionate side chain of pyrrole ring D, yielding the acrylate side chain of heme d1, the extracted dihydro-heme d1 was mixed with purified NirN, and UV-visible absorption spectra were recorded at different time points after mixing. As shown in Fig. 5A, the absorption band of the free dihydro-heme d1 at 671 nm disappeared upon addition of NirN, and a new absorption band at 609 nm was visible immediately after mixing. This new absorption feature most likely represents the binding of dihydro-heme d1 to NirN. However, after 15 s of incubation, the spectrum had changed, and the absorption band at 609 nm had developed into a broad band at about 635 nm that did not change further during prolonged incubation. On the basis of this observation, we speculated that NirN might have catalyzed the formation of the acrylic double bond after the initial binding of the dihydro-heme d1 to the enzyme. Therefore, we compared the final absorption spectrum of the NirN/dihydro-heme d1 reaction mixture with the absorption spectra of a NirN/heme d1 mixture in the oxidized and reduced states (Fig. 5B). Strikingly, the final spectrum of the NirN/dihydro-heme d1 reaction mixture was identical to the spectrum of the NirN/heme d1 mixture in the reduced state, both showing an absorption band at 635 nm. Furthermore, we then oxidized the NirN reaction mixture initially containing dihydro-heme d1 by the addition of sodium persulfate, which resulted in a shift of the 635 nm absorption band to 626 nm. The obtained absorption spectrum was now identical to the spectrum of the NirN/heme d1 mixture in the oxidized state (Fig. 5B). These results suggest that NirN is indeed able to catalyze the conversion of dihydro-heme d1 to heme d1.
FIGURE 5.
Binding of dihydro-heme d1 to purified NirN and transfer to semi-apo NirS. A, UV-visible absorption spectra of the free dihydro-heme d1 (dd1), of purified NirN, and of the NirN/dihydro-heme d1 mixture measured immediately after mixing the two components (NirN addition) and measured after 15 s of incubation. Characteristic absorption bands are labeled. B, UV-visible absorption spectra of NirN/heme d1 (d1) mixtures in the oxidized and reduced forms and of the NirN/dihydro-heme d1 mixture after incubation for several minutes and subsequent oxidation with sodium persulfate. The spectra in A indicate that dihydro-heme d1 first bound to NirN, resulting in a new absorption band at 609 nm, and was then transformed into a new species exhibiting an absorption band at 635 nm. Upon oxidation with sodium persulfate, this species showed an absorption band at 626 nm (B). The comparison of these spectra with those of the NirN/heme d1 mixture (oxidized (ox.) and reduced (red.)) suggested that NirN catalyzed the transformation of dihydro-heme d1 to heme d1. C and D, UV-visible absorption spectra of the NirN/dihydro-heme d1 mixture after several minutes of incubation and subsequent addition of NirSs.a. (NirN + dd1 + NirSs.a.) and of NirSs.a./heme d1 and NirSs.a./dihydro-heme d1 mixtures in the oxidized (C) and reduced (D) forms. The comparison of the obtained spectra suggested that the cofactor that was transferred from NirN to NirSs.a. after incubation of NirN with dihydro-heme d1 was indeed the newly formed heme d1. AU, absorption units.
To further substantiate this finding, we added NirSs.a. to the NirN/dihydro-heme d1 reaction mixture after the potential conversion of the precursor to heme d1 was completed. Because it has been reported previously that heme d1-loaded NirN is able to transfer the cofactor to NirSs.a. (12), we assumed that this transfer should also take place in our reaction mixture. After several minutes of incubation with NirSs.a., UV-visible absorption spectra were recorded. As shown in Fig. 5C, the absorption band at 626 nm potentially representing heme d1-loaded NirN (oxidized) was shifted to 641 nm upon addition of NirSs.a.. Indeed, the newly obtained spectrum was identical to the spectrum of heme d1-containing NirS. Moreover, the same was true after the reduction of the cofactor with sodium dithionite (Fig. 5D). These observations clearly supported the idea that NirN catalyzed the conversion of dihydro-heme d1 to heme d1. The subsequent transfer of the formed heme d1 to NirSs.a. yielding holo-NirS took place as described previously (12).
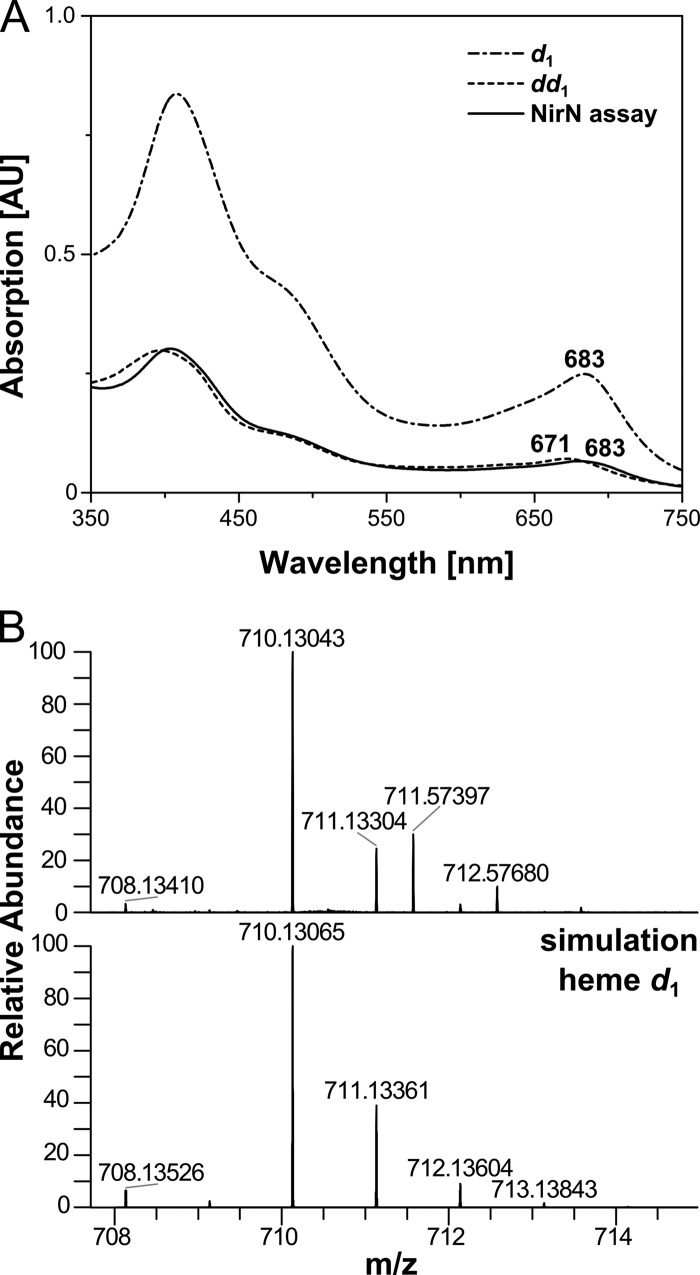
Finally, to unambiguously demonstrate that heme d1 was formed out of dihydro-heme d1 by the action of NirN, we extracted the cofactor from the NirN/dihydro-heme d1 reaction mixture after the reaction was completed and analyzed the formed reaction product by UV-visible absorption spectroscopy and HR-ESI-MS (Fig. 6). The extracted reaction product exhibited an absorption band at 683 nm identical to heme d1. Moreover, a mass of 710.13043 was determined for the reaction product ([M+H]+), which is in agreement with the theoretical mass (710.13065) of heme d1. Therefore, we concluded that NirN indeed catalyzed the formation of the acrylic double bond, therefore converting dihydro-heme d1 to heme d1.
FIGURE 6.
Characterization of the cofactor extracted from the NirN/dihydro-heme d1 mixture. A, UV-visible absorption spectra of the cofactor extracted from the NirN/dihydro-heme d1 reaction mixture after several minutes of incubation (NirN assay) and spectra of extracted heme d1 (d1) and dihydro-heme d1 (dd1) for comparison. Characteristic absorption bands are labeled. B, HR-ESI-MS analysis of the cofactor extracted from the NirN/dihydro-heme d1 reaction mixture. The top panel shows the experimental mass and isotopic pattern of the [M+H]+ ion, and the bottom panel shows the calculated mass spectrum of heme d1. Note that the measured masses 711.57397 and 712.57680 originate from an uncharacterized impurity present in the sample. AU, absorption units.
Purified, Recombinant NirF from D. shibae Binds Dihydro-Heme d1 without Conversion to Heme d1
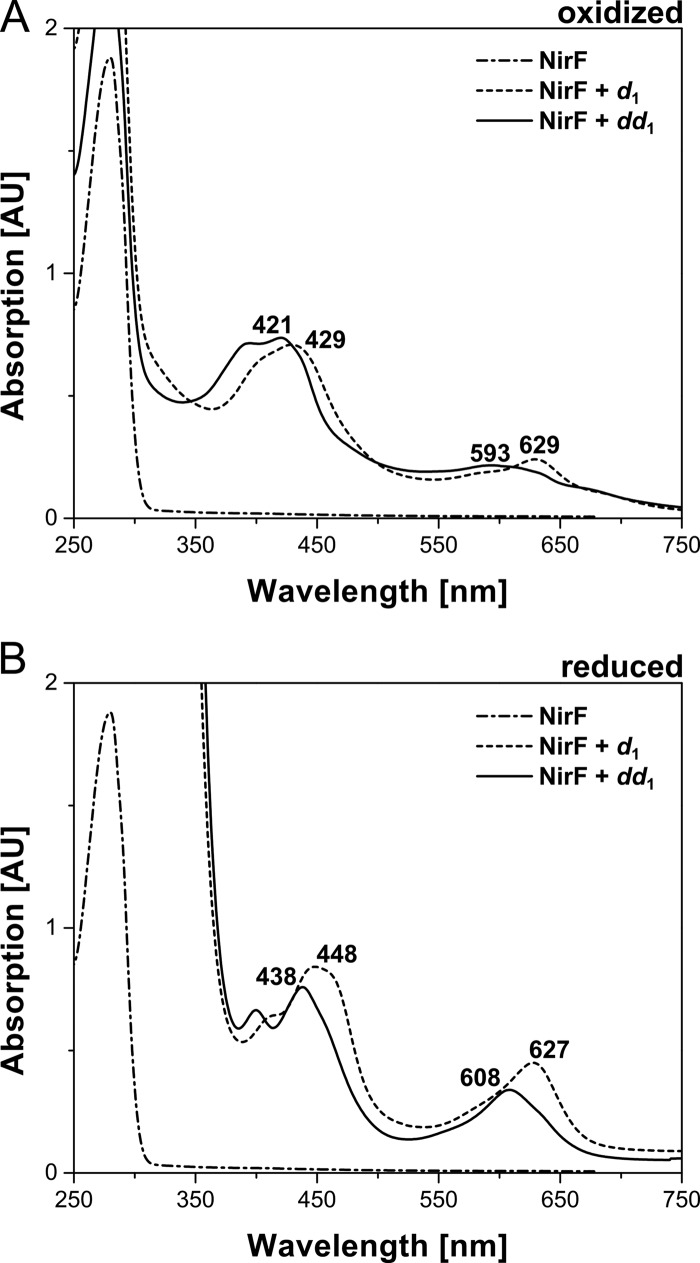
The finding that NirN catalyzes the conversion of dihydro-heme d1 to heme d1 was completely unexpected because NirF was originally proposed to be responsible for this reaction. This proposal was made on the basis of the observation that the periplasmic NirF from P. pantotrophus was able to bind heme d1 in vitro, and the obtained NirF-heme d1 complex was interpreted to represent an enzyme-product complex (13). Therefore, we incubated purified, recombinant NirF from D. shibae with dihydro-heme d1 and heme d1, and the binding of the cofactors to the protein was followed by UV-visible absorption spectroscopy (Fig. 7). The spectrum of the NirF/heme d1 mixture exhibits characteristic absorption bands at 429 and 629 nm in the oxidized state and at 448 and 627 nm in the reduced form, which is in agreement with the absorption features of heme d1-containing NirF from P. pantotrophus reported previously (13). The spectrum of the NirF/dihydro-heme d1 mixture displays absorption bands at 421 and 593 nm in the oxidized form and at 438 and 608 nm in the reduced form, showing that NirF is also able to bind the dihydro-heme d1 precursor because the observed absorption features of the NirF/dihydro-heme d1 mixture clearly differ from those of the free dihydro-heme d1. More importantly, the absorption spectrum of the NirF/dihydro-heme d1 mixture recorded directly after mixing the protein with the cofactor did not change further upon prolonged incubation, in contrast to what was observed for the NirN/dihydro-heme d1 mixture (see above). Therefore, we concluded that NirF was able to bind dihydro-heme d1 but did not convert it to heme d1.
FIGURE 7.
Binding of heme d1 and dihydro-heme d1 to purified NirF. A and B, UV-visible absorption spectra of purified NirF, NirF incubated with heme d1 (d1), and NirF incubated with dihydro-heme d1 (dd1). Spectra were measured in the oxidized (A) and dithionite-reduced (B) forms. Characteristic absorption bands are labeled. AU, absorption units.
NirN Catalyzes the Double Bond Formation using Electron Bifurcation
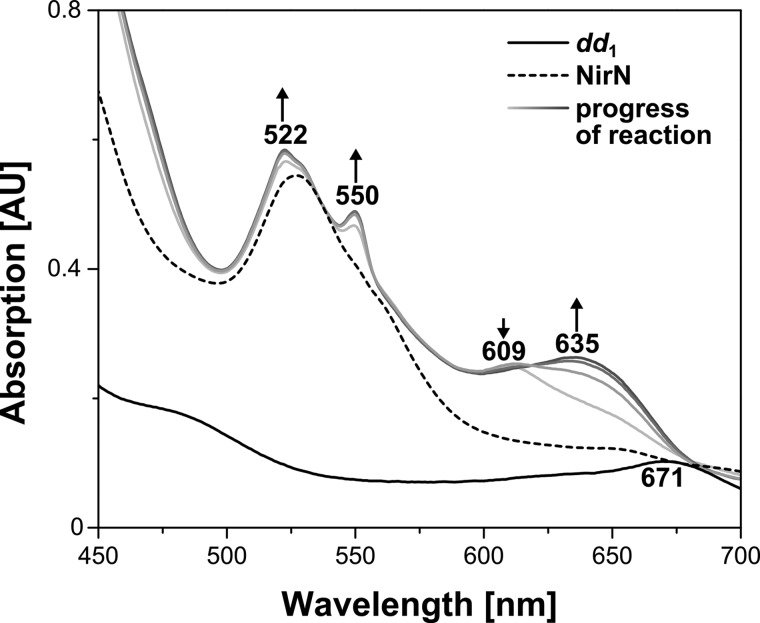
As outlined above, our studies revealed a new and unexpected function of NirN during heme d1 biosynthesis, namely that of the terminal dehydrogenase introducing the double bond into the propionate side chain of pyrrole ring D of dihydro-heme d1 to yield the acrylate side chain of heme d1. However, NirN must be a quite unusual dehydrogenase because it did not require the addition of any cofactor such as NAD+ or FAD/FMN typically employed by common dehydrogenases catalyzing two-electron oxidation reactions. Interestingly, in our initial NirN/dihydro-heme d1 reaction described above, we observed that the produced heme d1 was in the reduced Fe(II) state, although the substrate dihydro-heme d1 entered the reaction mixture in the oxidized Fe(III) form. Therefore, it seemed that one electron of the two-electron oxidation remained on the reaction product itself. Nevertheless, the fate of the second electron was still unclear. In this context, it is important to note that NirN contains a covalently attached heme c cofactor (16), and, therefore, we speculated that the second electron might be transferred to the heme c. In the initial reaction mixture, no reduction of the heme c in NirN was observed. However, this reaction was performed under aerobic conditions, which might have led to a rapid reoxidation of any reduced heme c. Therefore, we repeated the NirN activity assay under anaerobic conditions in an anaerobic chamber. NirN in its oxidized form (i.e. containing Fe(III)-heme c) was mixed with oxidized Fe(III)-dihydro-heme d1, and the reaction progress was followed by UV-visible absorption spectroscopy (Fig. 8). As before, a new absorption band at about 635 nm developed during the reaction, which represents the NirN-bound heme d1 in its reduced Fe(II) form. Moreover, two new absorption peaks at 522 and 550 nm appeared simultaneously with the absorption band at 635 nm. These absorption features are indeed characteristic for the reduced Fe(II)-heme c in NirN (16). On the basis of this experiment, we conclude that NirN catalyzes the two-electron oxidation of dihydro-heme d1 to heme d1 using an electron bifurcation mechanism during which one electron ends up on the reaction product heme d1 and the second electron is transferred to the heme c cofactor of the enzyme.
FIGURE 8.
NirN activity assay under anaerobic conditions. UV-visible absorption spectra of free dihydro-heme d1 (dd1), of purified NirN, and of the NirN/dihydro-heme d1 reaction mixture incubated under anaerobic conditions in an anaerobic chamber. For the NirN/dihydro-heme d1 reaction mixture, spectra were measured immediately after mixing the two components (light gray) and then every 15 s (from light to dark gray). Characteristic absorption bands are labeled. The increase or decrease of absorption bands during the reaction progress is indicated by arrows. AU, absorption units.
Novel Roles of NirN and NirF during Heme d1 Biosynthesis and Insertion into NirS
On the basis of the experiments described in this study, we would like to assign a novel function to the NirN protein. So far, the role of NirN was unclear because nirN deletion strains did not show extreme growth phenotypes and still produced an active form of NirS, which led to the assumption that NirN was apparently not involved in heme d1 biosynthesis. However, we observed that the deletion of the nirN gene in P. aeruginosa resulted in the production of a holo NirS with an obviously altered cofactor content (15). In this study, we could show that this form of holo NirS actually carried the heme d1 precursor dihydro-heme d1. Further, we showed that NirN is able to catalyze the conversion of dihydro-heme d1 to heme d1 in vitro. Therefore, we identified NirN as the terminal dehydrogenase catalyzing the last step of heme d1 biosynthesis. Moreover, we propose that NirN represents a novel and unusual type of a periplasmic dehydrogenase that uses an electron bifurcation mechanism to catalyze a two-electron oxidation reaction carrying only a one-electron accepting redox cofactor (heme c). Such a mechanism is possible for NirN because its substrate/product itself is able to accept one electron.
Considering the finding that NirN catalyzes the last step of heme d1 biosynthesis, the question arises what the function of NirF might be that was assumed previously to play the role now assigned to NirN. In this study, we observed that NirF is able to bind dihydro-heme d1. Together with the previous observation that NirF from P. aeruginosa is a periplasmic, membrane-anchored lipoprotein that interacts with both NirN and NirS (14, 15), one might speculate that NirF could be involved in the uptake of dihydro-heme d1 into the periplasm from a still unknown membrane transporter and then further transfer the precursor to NirN. NirN then catalyzes the formation of heme d1, which is finally transferred to NirS, yielding the active holo form of the enzyme. Such a role of NirF in the uptake of the heme d1 precursor into the periplasm is, of course, speculative at this stage and will require further research.
Acknowledgments
We thank Dr. Linda Thöny-Meyer (EMPA Materials Science and Technology, St. Gallen, Switzerland) for plasmid pEC86 and Dr. Hiroyuki Arai (Department of Biotechnology, University of Tokyo, Japan) for P. aeruginosa PAO1 strain RM361. We also thank Dr. Jürgen Moser (Institute of Microbiology, Technische Universität Braunschweig, Germany) for discussions and Dr. Dieter Jahn (Institute of Microbiology, Technische Universität Braunschweig, Germany) for support.
This work was supported by Deutsche Forschungsgemeinschaft Grants BR 2010/12-1 (to M. B.) and LA 2412/3-2 (to G. L.).
- HR-ESI-MS
- high-resolution electrospray ionization MS
- RR
- resonance Raman.
REFERENCES
- 1. Zumft W. G. (1997) Cell biology and molecular basis of denitrification. Microbiol. Mol. Biol. Rev. 61, 533–616 [DOI] [PMC free article] [PubMed] [Google Scholar]
- 2. Silvestrini M. C., Galeotti C. L., Gervais M., Schininà E., Barra D., Bossa F., Brunori M. (1989) Nitrite reductase from Pseudomonas aeruginosa: sequence of the gene and the protein. FEBS Lett. 254, 33–38 [DOI] [PubMed] [Google Scholar]
- 3. Fülöp V., Moir J. W., Ferguson S. J., Hajdu J. (1995) The anatomy of a bifunctional enzyme: structural basis for reduction of oxygen to water and synthesis of nitric oxide by cytochrome cd1. Cell 81, 369–377 [DOI] [PubMed] [Google Scholar]
- 4. Cutruzzolà F., Rinaldo S., Centola F., Brunori M. (2003) NO production by Pseudomonas aeruginosa cd1 nitrite reductase. IUBMB Life 55, 617–621 [DOI] [PubMed] [Google Scholar]
- 5. Chang C. K. (1994) Haem d1 and other haem cofactors from bacteria. Ciba Found. Symp. 180, 228–238, discussion 238–246 [PubMed] [Google Scholar]
- 6. Chang C. K., Timkovich R., Wu W. (1986) Evidence that heme d1 is a 1,3-porphyrindione. Biochemistry 25, 8447–8453 [DOI] [PubMed] [Google Scholar]
- 7. Bali S., Lawrence A. D., Lobo S. A., Saraiva L. M., Golding B. T., Palmer D. J., Howard M. J., Ferguson S. J., Warren M. J. (2011) Molecular hijacking of siroheme for the synthesis of heme and d1 heme. Proc. Natl. Acad. Sci. U.S.A. 108, 18260–18265 [DOI] [PMC free article] [PubMed] [Google Scholar]
- 8. de Boer A. P., Reijnders W. N., Kuenen J. G., Stouthamer A. H., van Spanning R. J. (1994) Isolation, sequencing and mutational analysis of a gene cluster involved in nitrite reduction in Paracoccus denitrificans. Antonie Van Leeuwenhoek 66, 111–127 [DOI] [PubMed] [Google Scholar]
- 9. Kawasaki S., Arai H., Kodama T., Igarashi Y. (1997) Gene cluster for dissimilatory nitrite reductase (nir) from Pseudomonas aeruginosa: sequencing and identification of a locus for heme d1 biosynthesis. J. Bacteriol. 179, 235–242 [DOI] [PMC free article] [PubMed] [Google Scholar]
- 10. Palmedo G., Seither P., Körner H., Matthews J. C., Burkhalter R. S., Timkovich R., Zumft W. G. (1995) Resolution of the nirD locus for heme d1 synthesis of cytochrome cd1 (respiratory nitrite reductase) from Pseudomonas stutzeri. Eur. J. Biochem. 232, 737–746 [PubMed] [Google Scholar]
- 11. Storbeck S., Walther J., Müller J., Parmar V., Schiebel H. M., Kemken D., Dülcks T., Warren M. J., Layer G. (2009) The Pseudomonas aeruginosa nirE gene encodes the S-adenosyl-l-methionine-dependent uroporphyrinogen III methyltransferase required for heme d1 biosynthesis. FEBS J. 276, 5973–5982 [DOI] [PubMed] [Google Scholar]
- 12. Zajicek R. S., Bali S., Arnold S., Brindley A. A., Warren M. J., Ferguson S. J. (2009) d1 haem biogenesis: assessing the roles of three nir gene products. FEBS J. 276, 6399–6411 [DOI] [PubMed] [Google Scholar]
- 13. Bali S., Warren M. J., Ferguson S. J. (2010) NirF is a periplasmic protein that binds d1 heme as part of its essential role in d1 heme biogenesis. FEBS J. 277, 4944–4955 [DOI] [PubMed] [Google Scholar]
- 14. Remans K., Vercammen K., Bodilis J., Cornelis P. (2010) Genome-wide analysis and literature-based survey of lipoproteins in Pseudomonas aeruginosa. Microbiology 156, 2597–2607 [DOI] [PubMed] [Google Scholar]
- 15. Nicke T., Schnitzer T., Münch K., Adamczack J., Haufschildt K., Buchmeier S., Kucklick M., Felgenträger U., Jänsch L., Riedel K., Layer G. (2013) Maturation of the cytochrome cd1 nitrite reductase NirS from Pseudomonas aeruginosa requires transient interactions between the three proteins NirS, NirN and NirF. Biosci. Rep. 10.1042/BSR20130043 [DOI] [PMC free article] [PubMed] [Google Scholar]
- 16. Hasegawa N., Arai H., Igarashi Y. (2001) Two c-type cytochromes, NirM and NirC, encoded in the nir gene cluster of Pseudomonas aeruginosa act as electron donors for nitrite reductase. Biochem. Biophys. Res. Commun. 288, 1223–1230 [DOI] [PubMed] [Google Scholar]
- 17. Li Y., Bali S., Borg S., Katzmann E., Ferguson S. J., Schüler D. (2013) Cytochrome cd1 nitrite reductase NirS is involved in anaerobic magnetite biomineralization in Magnetospirillum gryphiswaldense and requires NirN for proper d1 heme assembly. J. Bacteriol. 195, 4297–4309 [DOI] [PMC free article] [PubMed] [Google Scholar]
- 18. Arslan E., Schulz H., Zufferey R., Künzler P., Thöny-Meyer L. (1998) Overproduction of the Bradyrhizobium japonicum c-type cytochrome subunits of the cbb3 oxidase in Escherichia coli. Biochem. Biophys. Res. Commun. 251, 744–747 [DOI] [PubMed] [Google Scholar]
- 19. Studier F. W. (2005) Protein production by auto-induction in high density shaking cultures. Protein Expr. Purif. 41, 207–234 [DOI] [PubMed] [Google Scholar]
- 20. Tartoff K. D., Hobbs C. A. (1987) Improved media for growing plasmid and cosmid clones. Bethesda Res. Lab. Focus 9, 12 [Google Scholar]
- 21. Heydorn A., Nielsen A. T., Hentzer M., Sternberg C., Givskov M., Ersbøll B. K., Molin S. (2000) Quantification of biofilm structures by the novel computer program COMSTAT. Microbiology 146, 2395–2407 [DOI] [PubMed] [Google Scholar]
- 22. Parr S. R., Barber D., Greenwood C. (1976) A purification procedure for the soluble cytochrome oxidase and some other respiratory proteins from Pseudomonas aeruginosa. Biochem. J. 157, 423–430 [DOI] [PMC free article] [PubMed] [Google Scholar]
- 23. Spiro T. G. (1985) Resonance Raman spectroscopy as a probe of heme protein structure and dynamics. Adv. Protein Chem. 37, 111–159 [DOI] [PubMed] [Google Scholar]
- 24. Parthasarathi N., Hansen C., Yamaguchi S., Spiro T. G. (1987) Metalloporphyrin core size resonance Raman marker bands revisited: implications for the interpretation of hemoglobin photoproduct Raman frequencies. J. Am. Chem. Soc. 109, 3865–3871 [Google Scholar]
- 25. Ching Y., Ondrias M. R., Rousseau D. L., Muhoberac B. B., Wharton D. C. (1982) Resonance Raman spectra of heme c and heme d1 in Pseudomonas cytochrome oxidase. FEBS Lett. 138, 239–244 [DOI] [PubMed] [Google Scholar]
- 26. Choi S., Spiro T. G., Langry K. M., Smith K. M. (1982) Vinyl influences on protoheme resonance Raman spectra: nickel(II) protoporphyrin IX with deuterated vinyl groups. J. Am. Chem. Soc. 104, 4337–4344 [Google Scholar]
- 27. Choi S., Spiro T. G., Langry K. M., Smith K. M., Budd D. L., La Mar G. N. (1982) Structural correlations and vinyl influences in resonance Raman spectra of protoheme complexes and proteins. J. Am. Chem. Soc. 104, 4345–4351 [Google Scholar]
- 28. DeVito V., Asher S. A. (1989) UV resonance Raman enhancement of vinyl stretching in ferric protoporphyrin IX: conjugation and preservation of the vinyl .pi. .fwdarw. .pi.* transition. J. Am. Chem. Soc. 111, 9143–9152 [Google Scholar]
- 29. Lee H., Kitagawa T., Abe M., Pandey R. K., Leung H.-K., Smith K. M. (1986) Characterization of low frequency resonance Raman bands of metallo-protoporphyrin IX: observation of isotope shifts and normal coordinate treatments. J. Mol. Struct. 146, 329–347 [Google Scholar]
- 30. Steup M. B., Muhoberac B. B. (1989) Preparation and spectral characterization of the heme d1.apomyoglobin complex: an unusual protein environment for the substrate-binding heme of Pseudomonas cytochrome oxidase. J. Inorg. Biochem. 37, 233–257 [DOI] [PubMed] [Google Scholar]
- 31. Walsh T. A., Johnson M. K., Barber D., Thomson A. J., Greenwood C. (1981) Studies on heme d1 extracted from Pseudomonas aeruginosa nitrite reductase. J. Inorg. Biochem. 14, 15–31 [DOI] [PubMed] [Google Scholar]
- 32. Oellerich S., Wackerbarth H., Hildebrandt P. (2002) Spectroscopic characterization of nonnative conformational states of cytochrome c. J. Phys. Chem. B 106, 6566–6580 [Google Scholar]


