

Abstract
Introduction
Uric acid is the most abundant molecule with antioxidant properties found in human blood serum. We examined the relationship between serum uric acid and the incidence of respiratory disease including any effect modification by smoking status.
Methods
A cohort with serum uric acid measured between 1 January 2000 and 31 December 2012 was extracted from The Health Improvement Network primary care research database. New diagnoses of COPD and lung cancer were ascertained based on diagnostic codes entered into the medical records.
Results
During 1 002 496 person years (PYs) of follow-up, there were 3901 COPD diagnoses and 1015 cases of lung cancer. After multivariable adjustment, strong interactions with smoking status were detected (p<0.001) for both outcomes with significant negative relationships between serum uric acid and respiratory disease for current smokers but no strong relationships for never-smokers or ex-smokers. The relationships were strongest for lung cancer in heavy smokers (≥20 cigarettes per day) with predicted incidence rates 97 per 10 000 PYs (95% CI 68 to 126) in the lowest serum uric acid quintile (100–250 µmol/L) compared with a predicted 28 per 10 000 PYs (95% CI 14 to 41) in the highest quintile (438–700 µmol/L).
Conclusions
Low levels of serum uric acid are associated with higher rates of COPD and lung cancer in current smokers after accounting for conventional risk factors.
Keywords: COPD epidemiology, Lung Cancer, Oxidative Stress, Tobacco and the lung
Key messages.
What is the key question?
Is there a relationship between serum uric acid, purported to be a major physiological antioxidant, and respiratory disease and does this differ according to smoking status?
What is the bottom line?
After multivariable adjustment, strong interactions with smoking status were detected with significant negative relationships between serum uric acid and respiratory disease for current smokers but no strong relationships for never-smokers or ex-smokers.
Why read on?
This is the first study to report higher rates of respiratory disease in people with low serum uric acid and the results suggest serum uric acid, a relatively cheap and routine test, could have some value in risk stratification within current smokers.
Introduction
Animal cells require adenine and guanine based purine compounds for survival. An unusual feature of hominoids (apes and humans) is that the catabolism of purines ends with uric acid whereas in most other mammals uric acid is converted to urea and allantoin prior to excretion in urine. The conversion (oxidation) of uric acid to urea is mediated by the hepatic enzyme uricase, which is absent in hominoids due to loss of function mutations in the uricase gene.1 As a consequence uric acid levels in human blood are around 50 times higher compared with non-primate mammals.2 The fact that repression or complete loss of uricase activity has occurred more than once during primate evolution, together with some usual features of the metabolic handling of uric acid, has led to speculation that raised levels may exert some kind of physiological benefit.
Accumulative damage to lipids, proteins and DNA by reactive oxygen species is the major mechanism underlying the free radical theory of aging and variation in levels of systemic serum antioxidants due to genetic and environmental influences, may have an important role susceptibility to a range of age-related diseases. Laboratory studies have identified powerful antioxidant properties for serum uric acid and with an average concentration of 300 µmol/L (5 mg/dL) it is the most abundant free radical ‘scavenger’ found in human blood.3 4 Estimates suggest 50% of human blood antioxidant capacity is due to the action of uric acid.5 The antioxidant properties of raised serum uric acid have been hypothesised to explain the low cancer rates and longevity in hominids relative to other mammals.6
The respiratory system is exposed to high levels or reactive oxygen species from industrial pollution, indoor fires, cigarette smoke and recurrent infections. Thus levels of serum antioxidants such as uric acid may have a particularly important role in susceptibility to respiratory disease. Furthermore, uric acid derived from serum is found at high concentration in the human epithelial lining fluid of the upper and lower respiratory tracts and appears to provide an important first-line defence against environmental oxidants.7 8 Serum uric acid is frequently measured in the primary care setting to diagnose gout, assess renal function and monitor drug response. However, the relationship with respiratory disease is not well characterised.
The aim of this study was to examine the relationship between serum uric acid and respiratory disease, specifically COPD and lung cancer. Antioxidant capacity may have a more important role in people exposed to high levels of reactive oxygen species and thus we tested for interactions with smoking status.
Methods
Data source
Most general practitioners (GPs) in the UK record patient data electronically and some of these practices opt to provide these data for clinical and epidemiological research. The Health Improvement Network (THIN) primary care database currently holds anonymised longitudinal data on over 11 million patients registered with more than 500 practices, which represents around 6% of the UK population (http://csdmruk.cegedim.com). Information on diagnoses, symptoms and referrals to secondary care are electronically recorded using Read codes, a hierarchical coding system.9 All drug prescriptions as well as records of height, weight, blood pressure, smoking status and laboratory test results are entered onto the computer system. The database includes information of social deprivation (quintiles of Townsend score) based on owner-occupation, overcrowding, car ownership and unemployment levels derived from UK census data and linked to the patient's postcode. A quintile score of local particle pollution levels is also provided. THIN data is representative of the UK general practice population in terms of demographics and consultation behaviour and electronically recorded diagnoses are accurate compared with other reliable sources.10 11 Smoking levels in THIN data are similar to those reported in anonymous surveys.12
The THIN scheme of providing anonymised patient data to researchers was approved by the National Health Service South-East Multi-centre Research Ethics Committee and the University College London Scientific Review Committee approved the present study.
Study population
A cohort of patients (≥30 years and <100 years of age) with a serum uric acid level recorded between 1 January 2000 and 31 December 2012 in standard international µmol/L units were extracted from THIN. Measurements were included if they were taken after the practice had achieved acceptable mortality recording13 and computer usage.14 This was to exclude earlier time periods when practices were not fully computerised. Patients were followed from the date of the first uric acid test until they have the event of interest, died, transferred to a different GP practice, or the study period ended (31 December 2012). Patients with raised uric acid due to chronic kidney disease were excluded.
Exposure
Serum uric acid levels are highly heritable15 16 and repeated measures in the same individual are fairly stable (intraclass correlation coefficient (ICC) 0.8).17 Therefore we extracted the earliest recorded measure and assumed this would broadly approximate exposure levels over time. The ICC for THIN patients was checked using a subset with more than two measures recorded in the same month. Based on the observed frequency distributions, we selected 100–700 µmol/L (1.7–11.8 mg/dL) as the range for this study (see online supplementary figure S1).
Outcomes
Lists of diagnostic Read codes for COPD and lung cancer were developed using a published methodology.18 Events were identified based on diagnoses in the patients’ record or as a cause of death. Disease events were considered incident if they were recorded at least 6 months after GP practice registration. For each analysis, patients with the diagnosis of interest recorded within 3 months of the uric acid test were excluded to help limit any reverse causation.
Covariates
Using the date of the uric acid test as the baseline, other variables extracted as potential confounders (or effect modifiers in the case of smoking) included gender, age, social deprivation, particle pollution, calendar year, smoking status (never, ex, light-moderate (1–19 cigarettes per day), heavy (≥20 cigarettes per day)), alcohol drinker (non, ex, current), blood pressure (systolic and diastolic), height, weight and non-European ethnicity. For covariates with multiple measurements, the value recorded closest to but prior to or on the date or the uric acid test (baseline) was selected. In total, 231 796patients met the inclusion criteria and the majority had data on height, weight, smoking status and alcohol consumption recorded just prior to the uric acid test result. The 11% of patients with any missing data on height or weight (n=15 457), smoking or alcohol (n=10 883) and social deprivation (n=7231) were excluded from the cohort. Other variables including comorbidity, various drug prescriptions and creatinine levels as a measure of renal function were extracted and adjusted for in a supportive analysis (see online supplementary information).
Statistical analysis
Multivariable mixed Poisson regression was used to examine the relationship between serum uric acid levels and the clinical events of interest and to calculate adjusted incidence rate ratios (IRRs). Poisson models are appropriate for the analysis of person-time data when events are rare and goodness of fit to the Poisson model was checked using the deviance statistic. Serum uric acid and all continuous covariates were included in the regression models without categorisation. The GP practice was included in all models as a random effect to account for any data clustering. Multiplicative interactions between smoking and uric acid level were investigated by including the appropriate interaction terms in the regression model. Overall significance for categorical variables and interaction terms between uric acid and smoking status were tested using Wald tests. To help visualise interaction effects, regression model predictions were used to calculate the incidence rates across smoking categories for fixed values of serum uric acid assuming average values for the remaining covariates.
A p value of <0.05 was considered statistically significant (two-tailed) and all analyses were done using Stata V.12.
All authors had full access to all of the data in the study and can take responsibility for the integrity of the data and the accuracy of the data analysis.
Results
In total 205 484 patients (52% men) were included in the cohort with a median follow-up of 5 years from the date of the serum uric acid test (IQR: 2–7 years). During follow-up, 16 803 (8%) patients died and 31 219 (15%) transferred to different GP practices. The variables showing the strongest trends across uric acid quintiles were gender, age, weight and smoking status (table 1). The ICC for patients with two uric acid tests in the same month was similar to the literature at 0.86. Only 2.6% of the variation in serum uric acid was explained by GP practice level variables suggesting the measurement methods are similar across UK laboratories.
Table 1.
Overall cohort characteristics for variables used in the primary analyses and across quintile categories of serum uric acid (row percentages)
| Serum uric acid quintile (µmol/L)* | ||||||
|---|---|---|---|---|---|---|
| 100–250 | 251–307 | 308–360 | 361–437 | 438–700 | ||
| Overall | n=42 435 | n=39 874 | n=41 273 | n=40 866 | n=41 036 | |
| Men | 107 727 (52) | 7111 (7) | 14 634 (14) | 23 306 (22) | 29 988 (28) | 32 688 (30) |
| Women | 97 757 (48) | 35 324 (36) | 25 240 (26) | 17 967 (18) | 10 878 (11) | 8348 (9) |
| Age, years | 58.2 (14.4) | 54.5 (14.6) | 57.6 (14.2) | 58.9 (13.8) | 59.7 (13.8) | 60.4 (14.6) |
| Height, cm | 168 (10) | 164.2 (8.3) | 166.8 (9.6) | 169.4 (10) | 171.8 (9.6) | 172.6 (9.5) |
| Weight, kg | 79.7 (17.6) | 69 (14.4) | 75.8 (16) | 81 (16.4) | 85.3 (16.5) | 88.1 (17.4) |
| SBP, mm Hg | 80.1 (10.0) | 77.5 (9.9) | 79.5 (9.8) | 80.5 (9.9) | 81.4 (9.9) | 81.5 (10.2) |
| DBP, mm Hg | 135.4 (17.9) | 129.7 (18.2) | 134.1 (17.8) | 136.5 (17.5) | 138.1 (17.2) | 138.7 (17.1) |
| Smoking status | ||||||
| Non-smoker | 97 399 (47) | 22 553 (23) | 14 634 (14) | 23 306 (22) | 29 988 (28) | 32 688 (30) |
| Ex-smoker | 79 034 (39) | 12 151 (15) | 13 707 (17) | 16 121 (20) | 17 802 (23) | 19 253 (24) |
| Light-moderate (1–19 per day) | 7931 (4) | 5391 (28) | 4169 (21) | 3899 (20) | 3218 (17) | 2784 (14) |
| Heavy (≥20 per day) | 11 530 (6) | 2340 (24) | 2099 (22) | 2033 (21) | 1666 (17) | 1452 (15) |
| Alcohol drinker | 168 399 (82) | 32 495(19) | 31 598(19) | 33 889(20) | 34 872(21) | 35 545(21) |
| Most deprived quintile | 20 341 (10) | 4497 (22) | 3975 (20) | 3988 (20) | 3727 (18) | 4154 (20) |
| Highest pm10 quintile | 48 963 (24) | 10 103 (21) | 9569 (20) | 9335 (19) | 9761 (20) | 10 195(21) |
| Non-European ethnicity | 6901 (4) | 1619 (23) | 1471 (21) | 1404 (20) | 1286 (19) | 1121 (16) |
| Lung cancer | ||||||
| Events/10 000 PYs | 1015/92.5 | 168/19.3 | 193/17.9 | 208/18.6 | 206/18.4 | 240/18.3 |
| Incidence per 10 000 PYs | 11.0 (10.3–11.7) | 8.7 (7.5–10.1) | 10.8 (9.4–12.4) | 11.2 (9.7–12.8) | 11.2 (9.8–12.8) | 13.1 (11.6–14.9) |
| COPD | ||||||
| Events/10 000 PYs | 3901/83.7 | 736/17.7 | 718/16 | 800/17.1 | 789/16.4 | 858/16.6 |
| Incidence per 10 000 PYs | 46.6 (45.2–48.1) | 41.6 (38.7–44.7) | 45 (41.8–48.4) | 46.7 (43.6–50.1) | 48.2 (44.9–51.7) | 51.8 (48.4–55.4) |
Continuous variables are means with±SDs and categorical variables are numbers with percentages.
*Conversion factor: µmol/L×0.01 681 mg/dL.
DBP, diastolic blood pressure; PYs, person years; pm10, particle pollution; SBP, systolic blood pressure.
During 1 002 496 person years (PYs) of follow-up, there were 3901 COPD diagnoses and 1015 cases of lung cancer (table 1). The crude disease incidence rates tended to increase across serum uric acid quintiles (table 1). After adjusting for potential confounders, each 100 µmol/L increase in serum uric acid was associated with a statistically non-significant 2% decrease in the incidence of COPD (IRR 0.98 (95% CI 0.94 to 1.01)) and a 5% decrease in the incidence of lung cancer (IRR 0.95 (95% CI 0.89 to 1.01)). However, interaction terms between uric acid level and smoking status were statistically significant for COPD (p<0.001) and lung cancer (p<0.001) (table 2). A stratified analysis showed negative relationships between uric acid and disease incidence in smokers, particularly for lung cancer in heavy smokers where each 100 µmol/L increase in uric acid levels associated with a 28% reduction in incidence rates (table 3). However, among non-smokers and ex-smokers, there was a weak positive but statistically non-significant association between serum uric acid and respiratory diseases (table 3). The predicted incidence rates of lung cancer and COPD were 70% (97 vs 28 per 10 000 PYs) and 40% (248 vs 140 per 10 000 PYs) higher, respectively, in the lowest uric acid quintile compared with the highest quintile in current heavy smokers after adjusting for potential confounders (table 4 and figure 1). Supportive analyses including additional drugs and comorbidity did not alter the overall findings (see online supplementary figure S2) and there was no evidence that serum uric acid was influenced by the timing of diagnosis suggesting a limited role for reverse causation (see online supplementary information).
Table 2.
Adjusted incidence rate ratios (IRRs) of lung cancer and COPD as a function of 100 µmol/L (1.68 mg/dL) serum uric acid levels and including an interaction with smoking status
| Lung cancer | COPD | |||||
|---|---|---|---|---|---|---|
| Adjusted IRRs* | (95% CI) | p Value | Adjusted IRRs* | (95% CI) | p Value | |
| Non-smoker | 1.00 | (Reference) | 1.00 | (Reference) | ||
| Ex-smoker | 3.49 | (1.70 to 7.16) | 2.97 | (2.17 to 4.06) | ||
| Light-moderate (1–19 per day) | 19.54 | (8.93 to 42.79) | 12.89 | (9.06 to 18.35) | ||
| Heavy (≥20 per day) | 58.85 | (25.27 to 137.08) | <0.001 | 19.69 | (13.29 to 29.17) | <0.001 |
| Serum uric acid (per 100 µmol/L)† | 1.00 | 0.84 to 1.19 | NS | 1.04 | 0.96 to 1.11 | NS |
| Non-smoker X uric acid | 1.00 | (Reference) | 1.00 | (Reference) | ||
| Ex-smoker X uric acid | 1.04 | (0.86 to 1.26) | 1.01 | (0.93 to 1.10) | ||
| Light-moderate smoker X uric acid | 0.87 | (0.70 to 1.09) | 0.86 | (0.78 to 0.96) | ||
| Heavy smoker X uric acid | 0.72 | (0.56 to 0.92) | <0.001 | 0.85 | (0.76 to 0.95) | <0.001 |
Wald tests were used to calculate p values for categorical variables and interaction terms
*Adjusted for age, sex, social deprivation, year of uric acid test, smoking status, alcohol, height, weight, blood pressure, non-European ethnicity and particle pollution.
†Conversion factor: µmol/L×0.01 681 mg/dL
NS, non-significant.
Table 3.
Crude incidence rates and adjusted incidence rate ratios (IRRs) of lung cancer and COPD as a function of 100 µmol/L (1.68 mg/dL) serum uric acid levels stratified on smoking status
| Events/PYs per 10 000 | Crude incidence rate (95% CI) | Adjusted IRRs* (95% CI) per 100 µmol/L increase in uric acid | |
|---|---|---|---|
| Lung cancer | |||
| Non-smoker | 112/43.7 | 2.6 (2.1 to 3.1) | 1.04 (0.85 to 1.26) |
| Ex-smoker | 531/35.4 | 15.0 (13.8 to 16.3) | 1.04 (0.96 to 1.14) |
| Light-moderate | 226/8.9 | 25.4 (22.3 to 29.0) | 0.91 (0.78 to 1.05) |
| Heavy | 146/4.5 | 32.2 (27.3 to 37.8) | 0.72 (0.59 to 0.87) |
| COPD | |||
| Non-smoker | 643/41.1 | 15.7 (14.5 to 16.9) | 1.03 (0.94 to 1.12) |
| Ex-smoker | 1894/31.2 | 60.7 (58.0 to 63.5) | 1.03 (0.99 to 1.08) |
| Light-moderate | 822/7.6 | 108 (101 to 116) | 0.88 (0.81 to 0.95) |
| Heavy | 542/3.9 | 140 (129 to 153) | 0.91 (0.83 to 1.00) |
Wald tests were used to calculate p values for categorical variables and interaction terms.
*Adjusted for age, sex, social deprivation, year of uric acid test, alcohol, height, weight, blood pressure, non-European ethnicity and particle pollution.
PYs, person years.
Table 4.
Adjusted incidence predictions for lung cancer and COPD as a function of serum uric acid levels showing an interaction with smoking status
| Serum uric acid quintiles (µmol/L) | |||||
|---|---|---|---|---|---|
| 100–250 | 251–307 | 308–360 | 361–437 | 438–700 | |
| n=42 435 | n=39 874 | n=41 273 | n=40 866 | n=41 036 | |
| Predicted incidence of lung cancer per 10 000 PYs (95% CI)* | |||||
| Non-smoker | 3.0 (1.9 to 4.1) | 3.0 (2.3 to 3.7) | 3.0 (2.4 to 3.6) | 3.0 (2.4 to 3.7) | 3.1 (1.7 to 4.4) |
| Ex-smoker | 11.2 (9.0 to 13.4) | 11.8 (10.4 to 13.3) | 12.2 (10.9 to 13.4) | 12.6 (11.4 to 13.9) | 13.8 (11.3 to 16.4) |
| Light-moderate | 45.9 (34.2 to 57.7) | 40.2 (33.7 to 46.7) | 37.5 (32.0 to 43.0) | 34.5 (28.5 to 40.5) | 27.8 (18.0 to 37.5) |
| Heavy | 97.0 (67.8 to 126.3) | 69.6 (56.1 to 83.1) | 58.4 (47.3 to 69.4) | 47.4 (36.0 to 58.8) | 27.5 (14.2 to 40.9) |
| Predicted incidence of COPD per 10 000 PYs (95% CI)* | |||||
| Non-smoker | 16.6 (14.0 to 19.3) | 17.1 (15.3 to 18.9) | 17.4 (15.8 to 18.9) | 17.7 (15.9 to 19.4) | 18.5 (15.0 to 22.0) |
| Ex-smoker | 49.5 (44.0 to 54.9) | 51.4 (47.4 to 55.4) | 52.4 (48.9 to 56.0) | 53.7 (50.1 to 57.3) | 57.2 (50.9 to 63.4) |
| Light-moderate | 167.3 (144.1 to 190.5) | 147.1 (133.3 to 160.8) | 137.4 (125.3 to 149.4) | 126.7 (113.8 to 139.6) | 102.6 (82.7 to 122.6) |
| Heavy | 247.7 (206.6 to 288.8) | 213.2 (189.6 to 236.7) | 196.9 (176.5 to 217.4) | 179.3 (157.3 to 201.3) | 140.3 (106.8 to 173.8) |
The median (middle) value of serum uric acid within each quintile was used as the fixed value for the prediction.
*Adjusted for age, sex, social deprivation, year of uric acid test, alcohol, height, weight, blood pressure, non-European ethnicity and particle pollution.
PYs, person years.
Figure 1.
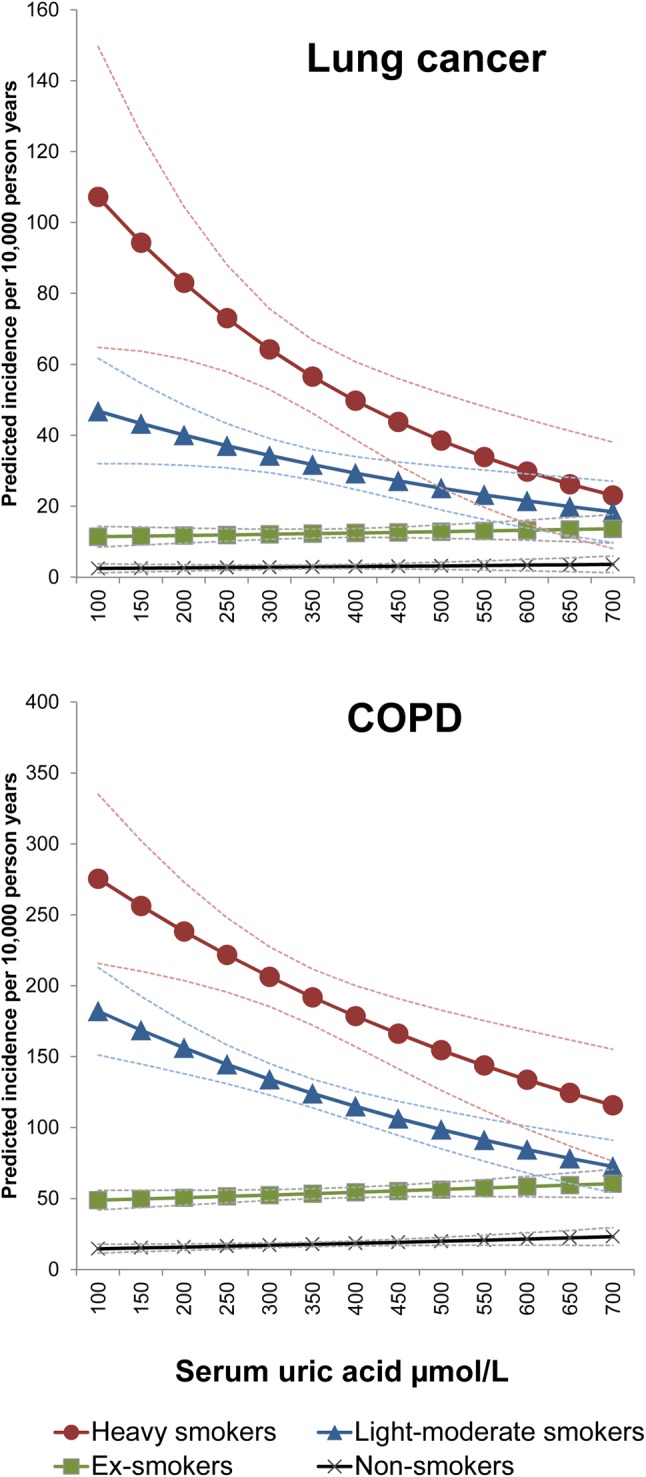
Adjusted incidence predictions for lung cancer and COPD events as a function of serum uric acid levels in a cohort of primary care patients showing an interaction with smoking status. Conversion factor: µmol/L×0.01681 mg/dL.
Discussion
To the best of our knowledge, this is the largest population-based cohort study on the relationship between serum uric acid levels and respiratory disease and the first to have adequate power to identify an interaction with smoking status. The relationship was strongest for lung cancer in heavy smokers with the predicted number of new cases during 10 000 PYs for the lowest quintile of uric acid over 70% higher than in the higher quintile after accounting for other factors.
Although observational studies of other conditions related to oxidative stress including Parkinson's disease19 and multiple sclerosis20 have reported negative relationships with serum uric acid, there have been comparatively fewer studies specifically examining the relationship with respiratory disease. The most recent, a cross-sectional study of 136 smokers with normal lung function and 367 smokers with COPD, reported an association between lower serum uric acid and more severe COPD (p<0.002).21 Smaller studies of COPD (<60 participants) reported conflicting results.22 23 A population-based cross-sectional study of Japanese subjects (n=2917) reported a weak negative relationship between uric acid and respiratory function in women but no relationship in men.24 None of these studies reported whether tests were performed to identify interaction with smoking status. As far as we are aware, the only other longitudinal analysis of serum uric acid that examined respiratory cancer (subgroup analysis of overall cancer) was a cohort study of 78 850 Austrian men.25 This study reported a weak J-shaped relationship with no evidence of an interaction with smoking status. Around 70% of the Austrian cohort were never smokers (the proportion of current smokers not specifically reported) and the number of events were lower (n=883) and thus it is possible the study lacked statistical power to detect interactions with smoking status. In the absence of a biological mechanism and based on other observations, the authors of the Austrian study speculate that the positive relationships with respiratory and other cancers examined are due to serum uric acid acting as a proxy for other unmeasured lifestyle variables.
The main strength of the present study is the large sample size that enabled us to detect the interactions between serum uric acid and smoking status. The longitudinal nature of the data meant we could examine the relationship with overall disease incidence rates and limit any potential for reverse causation. The study used routine medical data from the general population and therefore smokers and people from more socially deprived areas were well represented, which is not always the case for cohorts with active recruitment (‘healthy cohort effect’). However, differential confounding or bias may occur across smoking strata and either dilute or overestimate the relationships. Low serum uric acid could partially reflect length, intensity and timing of exposure to smoke oxidants but this is difficult to measure without lifetime follow-up data although most adult smokers in the UK adopt the habit in adolescence. We adjusted for smoking intensity as a continuous covariate in a supportive analysis, however the negative relationships in smokers could still reflect some level of self-reported underestimation of smoking intensity. In contrast with many other cancers, a number of studies have reported that raised body mass index (BMI) is associated with a lower risk of smoking-related cancers even after careful adjustment for smoking duration/intensity and reverse causation.26 27 Furthermore, a casual relationship between raised BMI due to increased energy intake and reduced risk of lung cancer was suggested by an analysis using ‘Mendelian randomization’.28 A clear biological mechanism to potentially explain these associations has not been proposed. However, if uric acid does function as a major serum antioxidant, higher energy intake causing raised levels29 may contribute to a lower risk of smoking-related cancers. Alternatively serum uric acid may be capturing unrecorded information on adiposity and energy intake in our cohort. This information can be hard to measure reliably in the primary care setting and serum uric acid may still have a role in identifying high-risk smokers regardless of causality.
It is also plausible that the associations were diluted across smoking strata due to residual confounding by unmeasured lifestyle factors as suggested for cardiometabolic diseases. For example, those in the upper end of the uric acid distribution may have lower levels of physical activity due to gout and poorer quality diets low in exogenous antioxidants. Surveillance bias could be a problem and dilute true associations if GPs are more likely to further investigate and diagnose conditions in patients with raised serum uric acid due to concerns over renal disease. However, this is less of an issue for the ‘harder’ outcome of lung cancer. We only used a single measure of uric acid as the exposure and thus regression dilution bias may have attenuated the relationships with respiratory outcomes. Patients were selected from THIN with a serum uric measure and thus risk factors for gout such as being overweight may be more common in this cohort relative to the UK population limiting the generalisability of the findings. Finally, the UK is over 90% white European and therefore the results may not be generalisable to other ethnic groups.
Lung cancer is the most common cause of cancer death globally with late diagnosis a major contributor to this high mortality burden. In the UK for example, just 15% of lung cancers are diagnosed at an early stage when treatment is most effective (http://www.gov.uk/phe). A recent clinical trial in the USA gained international attention when it reported that annual CT chest screening for high-risk smokers reduced lung cancer mortality by 20%.30 However, even within this high-risk group, disease susceptibility was highly variable31 and further risk stratification is desirable for cost-effectiveness and to improve social acceptability of a screening procedure with a high rate of false positive results.32 The strength of the associations in current smokers in the present paper suggests a role for uric acid in improving risk stratification irrespective of causal relationships. Given the low cost and accessibility of this assay in the primary care setting, this is an important area for further research.
Various hypotheses have emerged over the past 50 years to explain the inactivation of uricase during primate evolution. These are increased intellectual ability, maintenance of blood pressure in times of low salt/purine availability, and longevity due to protection against oxidative stress. Our results although consistent with the latter do not argue against these other hypotheses. If the relationships found in the presents study are real and serum uric acid is an important antioxidant, drugs that lower levels may not be appropriate for smokers due to the increased risk of developing respiratory diseases. Establishing antioxidant causality could be achieved through randomised controlled trials of uric acid administration. For example, two randomised double-blind placebo-controlled trials reported that administration of uric acid improves endothelial function and increases antioxidant capacity.33 34 There is an urgent need for larger studies of this nature that consider the potential benefits and harms (ie, increased risk of gout).
Current smokers with low serum uric acid levels have substantially higher rates of respiratory diseases compared with smokers with raised levels after accounting for conventional risk factors. The results of this study lend support to the hypothesis that uric acid functions as a serum antioxidant but causality remains to be proven. Whether serum uric acid has a clinically useful role in risk stratification in the primary care setting also requires further investigation.
Supplementary Material
Footnotes
Contributors: Study concept and design: LJH. Analysis and interpretation of data: LJH, IN and IP. Drafting of the manuscript: LJH. Critical revision of the manuscript for important intellectual content: IN and IP. Statistical analysis: LJH. Obtained funding: LJH. Study supervision: IN and IP.
Funding: LJH completed this work as part of a research fellowship funded by the National Institute for Health Research School for Primary Care Research.
Competing interests: None.
Ethics approval: South-East Multi-centre Research Ethics Committee.
Provenance and peer review: Not commissioned; externally peer reviewed.
Data sharing statement: Data sharing: no additional data available.
References
- 1.Varela-Echavarria A, Montes de Oca-Luna R, Barrera-Saldana HA. Uricase protein sequences: conserved during vertebrate evolution but absent in humans. FASEB J 1988;2:3092–6. [DOI] [PubMed] [Google Scholar]
- 2.Keilin J. The biological significance of uric acid and guanine excretion. Biol Rev 1959;34:265–94. [Google Scholar]
- 3.Frei B, Stocker R, Ames BN. Antioxidant defenses and lipid peroxidation in human blood plasma. Proc Natl Acad Sci USA 1988;85:9748–52. [DOI] [PMC free article] [PubMed] [Google Scholar]
- 4.Glantzounis GK, Tsimoyiannis EC, Kappas AM, et al. Uric acid and oxidative stress. Curr Pharm Des 2005;11:4145–51. [DOI] [PubMed] [Google Scholar]
- 5.Maxwell SR, Thomason H, Sandler D, et al. Antioxidant status in patients with uncomplicated insulin-dependent and non-insulin-dependent diabetes mellitus. Eur J Clin Invest 1997;27:484–90. [DOI] [PubMed] [Google Scholar]
- 6.Becker BF. Towards the physiological function of uric acid. Free Radic Biol Med 1993;14:615–31. [DOI] [PubMed] [Google Scholar]
- 7.Housley DG, Mudway I, Kelly FJ, et al. Depletion of urate in human nasal lavage following in vitro ozone exposure. Int J Biochem Cell Biol 1995;27:1153–9. [DOI] [PubMed] [Google Scholar]
- 8.van der Vliet A, O'Neill CA, Cross CE, et al. Determination of low-molecular-mass antioxidant concentrations in human respiratory tract lining fluids. Am J Physiol 1999;276(2 Pt 1):L289–96. [DOI] [PubMed] [Google Scholar]
- 9.Booth N. What are the Read Codes? Health Libr Rev 1994;11:177–82. [DOI] [PubMed] [Google Scholar]
- 10.Blak BT, Thompson M, Dattani H, et al. Generalisability of The Health Improvement Network (THIN) database: demographics, chronic disease prevalence and mortality rates. Inform Prim Care 2011;19:251–5. [DOI] [PubMed] [Google Scholar]
- 11.Khan NF, Harrison SE, Rose PW. Validity of diagnostic coding within the General Practice Research Database: a systematic review. Br J Gen Pract 2010;60: e128–36. [DOI] [PMC free article] [PubMed] [Google Scholar]
- 12.Langley TE, Szatkowski LC, Wythe S, et al. Can primary care data be used to monitor regional smoking prevalence? An analysis of The Health Improvement Network primary care data. BMC Public Health 2011;11:773. [DOI] [PMC free article] [PubMed] [Google Scholar]
- 13.Maguire A, Blak BT, Thompson M. The importance of defining periods of complete mortality reporting for research using automated data from primary care. Pharmacoepidemiol Drug Saf 2009;18:76–83. [DOI] [PubMed] [Google Scholar]
- 14.Horsfall L, Walters K, Petersen I. Identifying periods of acceptable computer usage in primary care research databases. Pharmacoepidemiol Drug Saf 2012. [DOI] [PubMed] [Google Scholar]
- 15.Emmerson BT, Nagel SL, Duffy DL, et al. Genetic control of the renal clearance of urate: a study of twins. Ann Rheum Dis 1992;51:375–7. [DOI] [PMC free article] [PubMed] [Google Scholar]
- 16.Wilk JB, Djousse L, Borecki I, et al. Segregation analysis of serum uric acid in the NHLBI Family Heart Study. Hum Genet 2000;106:355–9. [DOI] [PubMed] [Google Scholar]
- 17.Irizarry MC, Raman R, Schwarzschild MA, et al. Plasma urate and progression of mild cognitive impairment. Neurodegener Dis 2009;6:23–8. [DOI] [PMC free article] [PubMed] [Google Scholar]
- 18.Dave S, Petersen I. Creating medical and drug code lists to identify cases in primary care databases. Pharmacoepidemiol Drug Saf 2009;18:704–7. [DOI] [PubMed] [Google Scholar]
- 19.Shen C, Guo Y, Luo W, et al. Serum urate and the risk of Parkinson's disease: results from a meta-analysis. Can J Neurol Sci 2013;40:73–9. [DOI] [PubMed] [Google Scholar]
- 20.Liu B, Shen Y, Xiao K, et al. Serum uric acid levels in patients with multiple sclerosis: a meta-analysis. Neurol Res 2012;34:163–71. [DOI] [PubMed] [Google Scholar]
- 21.Nicks ME, O'Brien MM, Bowler RP. Plasma antioxidants are associated with impaired lung function and COPD exacerbations in smokers. COPD 2011;8:264–9. [DOI] [PMC free article] [PubMed] [Google Scholar]
- 22.Garcia-Pachon E, Padilla-Navas I, Shum C. Serum uric acid to creatinine ratio in patients with chronic obstructive pulmonary disease. Lung 2007;185:21–4. [DOI] [PubMed] [Google Scholar]
- 23.Hageman GJ, Larik I, Pennings HJ, et al. Systemic poly(ADP-ribose) polymerase-1 activation, chronic inflammation, and oxidative stress in COPD patients. Free Radic Biol Med 2003;35:140–8. [DOI] [PubMed] [Google Scholar]
- 24.Aida Y, Shibata Y, Osaka D, et al. The relationship between serum uric acid and spirometric values in participants in a health check: the Takahata study. Int J Med Sci 2011;8:470–8. [DOI] [PMC free article] [PubMed] [Google Scholar]
- 25.Strasak AM, Lang S, Kneib T, et al. Use of penalized splines in extended Cox-type additive hazard regression to flexibly estimate the effect of time-varying serum uric acid on risk of cancer incidence: a prospective, population-based study in 78,850 men. Ann Epidemiol 2009;19:15–24. [DOI] [PMC free article] [PubMed] [Google Scholar]
- 26.El-Zein M, Parent ME, Nicolau B, et al. Body mass index, lifetime smoking intensity and lung cancer risk. Int J Cancer 2013;133:1721–31. [DOI] [PubMed] [Google Scholar]
- 27.Yang Y, Dong J, Sun K, et al. Obesity and incidence of lung cancer: a meta-analysis. Int J Cancer 2013;132:1162–9. [DOI] [PubMed] [Google Scholar]
- 28.Brennan P, McKay J, Moore L, et al. Obesity and cancer: Mendelian randomization approach utilizing the FTO genotype. Int J Epidemiol 2009;38:971–5. [DOI] [PMC free article] [PubMed] [Google Scholar]
- 29.Palmer TM, Nordestgaard BG, Benn M, et al. Association of plasma uric acid with ischaemic heart disease and blood pressure: mendelian randomisation analysis of two large cohorts. BMJ 2013;347:f4262. [DOI] [PMC free article] [PubMed] [Google Scholar]
- 30.Aberle DR, Adams AM, Berg CD, et al. Reduced lung-cancer mortality with low-dose computed tomographic screening. N Engl J Med 2011;365:395–409. [DOI] [PMC free article] [PubMed] [Google Scholar]
- 31.Kovalchik SA, Tammemagi M, Berg CD, et al. Targeting of low-dose CT screening according to the risk of lung-cancer death. N Engl J Med 2013;369:245–54. [DOI] [PMC free article] [PubMed] [Google Scholar]
- 32.Young RP, Hopkins RJ, Gamble GD. Clinical applications of gene-based risk prediction for lung cancer and the central role of chronic obstructive pulmonary disease. Front Genet 2012;3:210. [DOI] [PMC free article] [PubMed] [Google Scholar]
- 33.Waring WS, McKnight JA, Webb DJ, et al. Uric acid restores endothelial function in patients with type 1 diabetes and regular smokers. Diabetes 2006;55:3127–32. [DOI] [PubMed] [Google Scholar]
- 34.Waring WS, Convery A, Mishra V, et al. Uric acid reduces exercise-induced oxidative stress in healthy adults. Clin Sci (Lond) 2003;105:425–30. [DOI] [PubMed] [Google Scholar]
Associated Data
This section collects any data citations, data availability statements, or supplementary materials included in this article.