

Abstract
A positive family history (FH) raises the risk for late-onset Alzheimer's disease though, other than the known risk conferred by apolipoprotein ε4 (ApoE4), much of the genetic variance remains unexplained. We examined the effect of family history on longitudinal regional brain atrophy rates in 184 subjects (42% FH+, mean age 79.9) with mild cognitive impairment (MCI) enrolled in a national biomarker study. An automated image analysis method was applied to T1-weighted MR images to measure atrophy rates for 20 cortical and subcortical regions. Mixed-effects linear regression models incorporating repeated-measures to control for within-subject variation over multiple time points tested the effect of FH over a follow-up of up to 48 months. Most of the 20 regions showed significant atrophy over time. Adjusting for age and gender, subjects with a positive FH had greater atrophy of the amygdala (p < 0.01), entorhinal cortex (p < 0.01), hippocampus (p < 0.053) and cortical gray matter (p < 0.009). However, when E4 genotype was added as a covariate, none of the FH effects remained significant. Analyses by ApoE genotype showed that the effect of FH on amygdala atrophy rates was numerically greater in ε3 homozygotes than in E4 carriers, but this difference was not significant. FH+ subjects had numerically greater 4-year cognitive decline and conversion rates than FH− subjects but the difference was not statistically significant after adjusting for ApoE and other variables. We conclude that a positive family history of AD may influence cortical and temporal lobe atrophy in subjects with mild cognitive impairment, but it does not have a significant additional effect beyond the known effect of the E4 genotype.
Keywords: Hippocampus, Amygdala, Entorhinal cortex, Memory, Dementia, Family history
Highlights
-
•
Family history of AD is associated with accelerated medial temporal atrophy in MCI.
-
•
Family history effect on medial temporal lobe atrophy is largely due to ApoE4 effect
-
•
Family history is not related to brain atrophy rate in ApoE3 homozygotes.
1. Introduction
Genetic factors significantly influence late-onset Alzheimer's disease (AD) though by some estimates 30–65% of the genetic variance remains unexplained by the four established AD genes (Tanzi, 2012; Mahley and Rall, 2000). Polymorphisms of the ApoE gene, specifically the epsilon 4 (ε4) allele, account for most of the known heritability of late-onset AD (Tanzi, 2012). A positive family history is a risk factor for late-onset AD (Tanzi, 2012; Cupples, 2004; Silverman, 1994), with studies indicating a 2–4-fold larger risk in first-degree relatives. Some of this risk is additive to the known risk conferred by the ApoE gene suggesting a missing heritability. Currently, in routine practice, clinicians still rely on a simple “yes/no” measure of self-reported FH status to evaluate subjects at risk — hence, studies examining the effect of FH on biomarker phenotypes may improve the interpretation of biomarker tests and the counseling of at risk subjects.
Several studies have examined the effect of FH on biomarkers (Lampert, 2013; Honea, 2011; Xiong, 2011; Andrawis, 2012; Okonkwo, 2012). For example, several cross-sectional studies in mild cognitive impairment or normal subjects report that first-degree relatives have a higher prevalence of abnormal cerebrospinal fluid beta-amyloid and/or tau phenotypes, even after accounting for the known effects of age and ApoE4 (Lampert, 2013; Xiong, 2011). One of these studies also estimated that the unexplained genetic heritability in FH (for an effect on beta-amyloid in MCI) was about half the size of the ApoE4 effect (Lampert, 2013).
Prior studies have also examined the effect of FH on hippocampal volume (Lampert, 2013; Honea, 2011; Andrawis, 2012; Okonkwo, 2012). In a prior cross-sectional study of normal, MCI, and AD subjects, we failed to find an effect of FH on hippocampal volume (Lampert, 2013). However, in another study of normal subjects derived from the KU Brain Aging Project, maternal FH was reported to influence 2-year volume loss in the precuneus, parahippocampal and hippocampus independent of ApoE4 (Honea, 2011). Supporting this was another 1-year multisite study, which found that maternal (but not paternal family history) was associated with increased hippocampal atrophy in MCI subjects but not in normal or AD subjects (Andrawis, 2012). However, another 4-year study of middle aged normals, in the Wisconsin Aging study, found that FH status predicted greater atrophy only within a posterior sub-region of the hippocampus but not in other gray matter regions, and that there was no effect of maternal versus paternal history (Okonkwo, 2012). Reasons for discrepancy may be differences in inclusion criteria, sample size, follow-up duration, image analyses, and covariates used.
The Alzheimer's Disease Neuroimaging Initiative (ADNI) is a highly successful national longitudinal biomarker research study (Weiner, 2010) and as such it is ideal for more definitive testing of preliminary results generated by single site studies. Stringent subject selection criteria, serial MRI scans using qualified scanners and phantoms, and standardized central MR image analyses are some of the many strengths of ADNI. The goal of this present analysis was to use ADNI data to test the effect of FH on longitudinal atrophy rates (up to 48 months) of 20 brain regions in subjects with MCI. We decided to focus on subjects with mild cognitive impairment for three reasons: ADNI included twice as many MCI subjects as controls; MCI subjects are at greater risk for progression to AD than normal controls; MCI subjects have a greater rate of atrophy than normal controls. Hence, the MCI group offered greater power for testing our hypotheses and was also more relevant to the type of subject seen in routine clinical practice. Our primary hypothesis was that a positive FH would be associated with greater rate of atrophy in brain regions known to degenerate early in AD such as the hippocampus, amygdala, entorhinal cortex, and cortical gray matter.
2. Materials and methods
2.1. Subjects
Data used in the preparation of this article were obtained from the Alzheimer's Disease Neuroimaging Initiative (ADNI-1) database (http://adni.loni.usc.edu) (Weiner, 2010). The ADNI was launched in 2003 by the National Institute on Aging (NIA), the National Institute of Biomedical Imaging and Bioengineering (NIBIB), the Food and Drug Administration (FDA), private pharmaceutical companies, and nonprofit organizations, as a 5-year public–private partnership. The primary goal of ADNI has been to test whether serial magnetic resonance imaging (MRI), positron emission tomography (PET), other biological markers, and clinical and neuropsychological assessment can be combined to measure the progression of mild cognitive impairment and early Alzheimer's disease (AD). Determination of sensitive and specific markers of very early AD progression is intended to aid researchers and clinicians to develop new treatments and monitor their effectiveness, as well as lessen the time and cost of clinical trials.
The Principal Investigator of this initiative is Michael W. Weiner, MD, VA Medical Center and University of California — San Francisco. ADNI is the result of efforts of many co-investigators from a broad range of academic institutions and private corporations, and subjects have been recruited from over 50 sites across the U.S. and Canada. The initial goal of ADNI was to recruit 800 subjects but ADNI has been followed by ADNI-GO and ADNI-2. To date these three protocols have recruited over 1500 adults, ages 55–90, to participate in the research, consisting of cognitively normal older individuals, people with early or late MCI, and people with early AD. The follow-up duration of each group is specified in the protocols for ADNI-1, ADNI-2 and ADNI-GO. Subjects originally recruited for ADNI-1 and ADNI-GO had the option to be followed in ADNI-2. For up-to-date information, see http://www.adni-info.org. For additional details readers can also refer to the ADNI-1 Procedures manual (ADNI, 2013; Alzheimer's Disease Neuroimaging Initiative, 2013).
2.2. Selection criteria
Only subjects with a baseline diagnosis of MCI were eligible for this study. Additionally, subjects selected for analysis were required to have data for all of the following parameters: baseline age, race, gender, and years of education; baseline Mini-Mental State Examination (MMSE) score; ApoE genotyping results; and family history status of AD. Subjects also needed initial visit 1.5 T MR scans analyzed centrally by FreeSurfer software (v.4.4) to derive cortical thickness and sub-cortical volume data; and a minimum of two other follow-up MRI time points (6, 12, 18, 24, 36, or 48 months from baseline) with centrally FreeSurfer analyzed MRI data. A total of 184 MCI subjects in ADNI-1 were included.
2.3. MCI criteria
To be classified as MCI in ADNI a subject needed an inclusive MMSE score between 24 and 30, subjective memory complaint, objective evidence of impaired memory calculated by scores of the Wechsler Memory Scale Logical Memory II adjusted for education, a score of 0.5 on the Global CDR, absence of significant confounding conditions such as current major depression, normal or near normal daily activities, and absence of clinical dementia. For a detailed list of all selection criteria readers are referred to the ADNI-1 Procedures manual (ADNI, 2013).
2.4. Family history criteria
FH data was collected by an interview with the subject and their study partner regarding the presence of AD in the subject's parents and siblings. A control typically self-reported while the study partner was the main source of information for memory-impaired subjects. A positive family history (FH+) was characterized as having a parent or sibling, living or deceased, who had been reported as diagnosed with AD. A negative family history (FH−) meant having no reported parents or siblings with a history of AD. ADNI participants with uncertain family history status were excluded from the analysis.
2.5. ApoE genotyping
ApoE allele genotyping of all subjects was executed using DNA extracted from peripheral blood cells with details given elsewhere (ADNI, 2013).
2.6. MR imaging acquisition
ADNI used 1.5 T MP-RAGE T1-weighted MR images that were later pre-processed and corrected for nonlinearity via “GradWarp.” The scans were implemented using a standardized ADNI protocol adjusted for use at each specific collection site and then underwent scaling and vetting to meet quality control criteria. For more detailed information regarding the specific MR acquisition protocols and control methods used please see http://adni.loni.usc.edu.
2.7. MR cortical thickness and volumetric methods
FreeSurfer image analysis was used for derivation of cortical thickness and volumetric segmentation. We selected 20 brain regions of interest, including 4 regions known to atrophy in early AD (hippocampus, amygdala, cortical gray matter volume, and entorhinal cortex) as well as other regions of exploratory interest. Specific details about these techniques have been previously described in publications (Ségonne, 2004; Fischl, 2002; Sled et al., 1998; Fischl et al., 2001; Fischl et al., 1999; Fischl and Dale, 2000; Han, 2006; Hostage et al., 2014). Morphometric procedures using FreeSurfer have been shown to demonstrate good test–retest reliability (Han, 2006). For more information please see http://adni.loni.usc.edu.
2.8. Statistical analyses
For each region of the brain, the longitudinal variation in thickness/volume was modeled as a log-linear function of time and other subject information. Firstly, we used gender, age and family history status:
| (1.1) |
The response Vij(t) is the thickness/volume in the jth region of the brain, j = 1, 2,…, 20 for the ith subject, i = 1,…, 184, measured at the tth time point, t = 0, 6, 12, 18, 24, 36, or 48 months. The terms in the model include μj, the baseline thickness volume, measured at time 0, for a 75 year old male subject with no family history of Alzheimer's. The baseline subject represents the most common subject characteristics in the study, and the reference age represents the first quartile of ages in the study. There is also a subject specific random effect, ai, assumed to have a Gaussian distribution with 0 mean and SD σa2. This term accounts for subject specific variation in the baseline brain volume, due to factors such as difference in intra-cranial brain volume. In addition, we have a linear effect of age (centered at 75), with coefficient βaj, an additional effect for females, αFj, as well as an effect of positive family history, αFHj. The aforementioned effects are all at t = 0 and specific to region j. Next, we model atrophy (or volume increase) as a linear function in time, decomposed into effects of the demographic variables: firstly, βj is the baseline rate of atrophy, corresponding to the baseline subject described above. There is also a subject specific random rate of atrophy, bi, assumed to have a Gaussian distribution with 0 mean and SD σb2. This term allows the rate of atrophy to vary across subjects, as a proxy for terms not explicitly included in the model, such as genetic and lifestyle factors. We also have an additional atrophy effect for females, βFj, as well as an atrophy effect of positive family history, αFHj. Finally, εijt is a random measurement error, assumed to have a zero mean Gaussian distribution with SD σ2. The brain volumes Vij(t) were log transformed to ensure that the distribution of the estimated error terms (residuals) of the model better conformed to the assumption of Gaussianity.
We also used a second model, where additional genetic information was incorporated:
| (1.2) |
In model (1.2), the common terms represent the same things as in model (1.1), except that the baseline subject additionally possesses the ApoE 3/3 allele. The term αE4j denotes the additional baseline effect of the ApoE 4+ allele, while βE4j denotes the additional atrophy effect of the ApoE 4+ allele. Both models were fit separately to data from each region of the brain, using restricted maximum likelihood (REML), as implemented in the nmle package [Pinheiro et al. Linear and Nonlinear Mixed Effects Models. R package version 3.1-113, 2013] in the R computing platform (http://www.r-project.org).
Our a priori primary hypothesis regions included those well known to atrophy in early AD such as the hippocampus, amygdala, entorhinal cortex and cortical gray matter. We applied a Bonferroni correction to exploratory analyses of all other regions.
3. Results
Baseline features of the sample are summarized in Table 1. 42% of the sample had a positive FH. There were no significant differences by FH for gender, years of education, or MMSE score. There was a difference in age (p = 0.05), and as expected there was an overrepresentation of the ApoE4 allele in FH+ subjects (p = 0.002). Total follow-up was up to 48 months, and the mean follow-up time for the FH− group (27.8 months) was not significantly different from the FH+ group (29.5 months, p < 0.25).
Table 1.
Baseline characteristics of FH+ versus FH− MCI subjects in ADNI.
| Attribute | FH− | FH+ | p-Value |
|---|---|---|---|
| n | 106 | 78 | |
| Age (mean) | 80.99 | 78.9 | 0.05 |
| M/F ratio | 1.58 | 1.28 | 0.56 |
| Education (years) | 15.61 | 15.48 | 0.76 |
| MMSE | 27.22 | 27.15 | 0.79 |
| MRI follow up time (months) | 27.8 | 29.5 | 0.25 |
| ApoE4 % | 0.41 | 0.65 | 0.002 |
MCI = mild cognitive impairment; FH- indicates those subjects without a family history of AD in a first degree relative; FH+ indicates those subjects with a positive family history; M/F ratio is male/female ration; MMSE is Mini-Mental State Exam; ApoE4% is percent in each group who carry the ApoE4 allele; ADNI is the Alzheimer’s Disease Neuroimaging Initiative. Refer to text for details of selection criteria.
3.1. Effect of FH after adjusting for age and gender
As shown in the first three columns in Table 2, most brain regions showed a significant atrophy over time (i.e. base rate). The effect of positive FH is shown in the last three columns. Adjusting for age and gender, subjects with a positive FH had greater atrophy of the cerebral cortex (p < 0.009), amygdala (p < 0.01), entorhinal cortex (p < 0.01) and hippocampus (p < 0.053).
Table 2.
Effect of family history on 4-year atrophy rates.
| Primary regions | Baseline rate of atrophy | Baseline SE | Baseline p-value |
FH rate | FH SE | FH p-value |
|---|---|---|---|---|---|---|
| Hippocampus.total.vol | −0.024 | 0.003 | <0.0001 | −0.004 | 0.002 | 0.053 |
| Amygdala.total.vol | −0.004 | 0.006 | 0.515 | −0.01 | 0.004 | 0.011 |
| Entorhinal.cortex.TA | −0.02 | 0.004 | <0.0001 | −0.007 | 0.003 | 0.01 |
| Cerebral.cortex.total.vol | −0.011 | 0.002 | <0.0001 | −0.003 | 0.001 | 0.009 |
| Exploratory regions | ||||||
| Parahippocampal.TA | −0.016 | 0.004 | <0.0001 | −0.004 | 0.002 | 0.096 |
| Pericalcarine.TA | −0.001 | 0.003 | 0.829 | −0.002 | 0.002 | 0.263 |
| Postcentral.TA | −0.009 | 0.003 | 0.002 | 0.002 | 0.002 | 0.239 |
| posterior.cingulate.TA | −0.009 | 0.003 | 0.004 | −0.001 | 0.002 | 0.508 |
| Precentral.TA | −0.015 | 0.004 | 0.001 | 0.002 | 0.003 | 0.39 |
| Precuneus.TA | −0.007 | 0.003 | 0.026 | −0.002 | 0.002 | 0.224 |
| Superior.Parietal.TA | −0.006 | 0.003 | 0.066 | −0.002 | 0.002 | 0.329 |
| Superior.temporal.TA | −0.013 | 0.003 | <0.0001 | 0.001 | 0.002 | 0.631 |
| Temporal.Pole.TA | −0.015 | 0.004 | 0.001 | −0.001 | 0.003 | 0.665 |
| Transverse.temporal.TA | −0.007 | 0.005 | 0.134 | 0.005 | 0.003 | 0.127 |
| Cerebellar.cortex.total.vol | −0.011 | 0.003 | <0.0001 | −0.005 | 0.002 | 0.007 |
| Cerebellar.WM.total.volume | 0.006 | 0.004 | 0.191 | 0.003 | 0.003 | 0.218 |
| Fusiform.gyrus.TA | −0.007 | 0.003 | 0.016 | −0.003 | 0.002 | 0.094 |
| Inferior.parietal.TA | −0.007 | 0.003 | 0.035 | −0.002 | 0.002 | 0.256 |
| Inferior.temporal.TA | −0.009 | 0.003 | 0.002 | −0.003 | 0.002 | 0.117 |
| Middle.temporal.TA | −0.009 | 0.003 | 0.003 | −0.002 | 0.002 | 0.245 |
Base rate is the unadjusted annual rate for all MCI subjects. FH rate indicates additional effect of FH after adjusting for age and gender. Four key a priori predicted regions are listed under “primary regions”. The estimated rate effects are in units of percent increase in log volume per year: a value of 1.00 (approximately) represents a 1% increase in volume per year. Negative values indicate atrophy.
3.2. Effect of FH after adjusting for age, gender and ApoE
Table 3 depicts the estimated effects and significance of ApoE ε4+ and FH on longitudinal atrophy rates. In this model, some 15 regions showed a significant ApoE4+ effect including all the predicted primary regions (such as the hippocampus, amygdala, entorhinal cortex and cerebral cortex). However, none of the primary predicted regions showed a significant FH effect in this model and the atrophy rate attributable to FH was considerably smaller than that attributable to ApoE4. Fig. 1 compares atrophy rates due to ApoE4+ versus those due to FH+ — it shows that most FH effects are small relative to ApoE4+ effects, as evidenced by the wider spread of ApoE4+ effects while most FH+ rates remained close to zero.
Table 3.
Effect of FH on atrophy rates after adjusting for ApoE4.
| Primary regions | ApoE4+ rate | ApoE4+ SE |
ApoE4+ p-value |
FH rate | FH SE | FH p-value |
|---|---|---|---|---|---|---|
| Hippocampus.total.vol | −0.017 | 0.002 | <0.00001 | −0.001 | 0.002 | 0.71 |
| Amygdala.total.vol | −0.023 | 0.004 | <0.00001 | −0.006 | 0.004 | 0.12 |
| Entorhinal.cortex.TA | −0.022 | 0.002 | <0.00001 | −0.003 | 0.002 | 0.28 |
| Cerebral.cortex.total.vol | −0.01 | 0.001 | <0.00001 | −0.002 | 0.001 | 0.2 |
| Exploratory regions | ||||||
| Parahippocampal.TA | −0.016 | 0.002 | <0.00001 | −0.001 | 0.002 | 0.65 |
| Pericalcarine.TA | 0.002 | 0.002 | 0.31028 | −0.002 | 0.002 | 0.2 |
| Postcentral.TA | −0.005 | 0.002 | 0.00679 | 0.003 | 0.002 | 0.1 |
| Posterior.cingulate.TA | −0.009 | 0.002 | 0.00001 | 0 | 0.002 | 0.89 |
| Precentral.TA | −0.009 | 0.003 | 0.00061 | 0.004 | 0.003 | 0.14 |
| Precuneus.TA | −0.01 | 0.002 | <0.00001 | −0.001 | 0.002 | 0.73 |
| Superior.parietal.TA | −0.01 | 0.002 | <0.00001 | 0 | 0.002 | 0.88 |
| Superior.temporal.TA | −0.01 | 0.002 | <0.00001 | 0.003 | 0.002 | 0.12 |
| Temporal.pole.TA | −0.016 | 0.003 | <0.00001 | 0.002 | 0.003 | 0.58 |
| Transverse.temporal.TA | −0.002 | 0.003 | 0.58824 | 0.005 | 0.003 | 0.11 |
| Cerebellar.cortex.total.vol | −0.002 | 0.002 | 0.31333 | −0.005 | 0.002 | 0.01 |
| Cerebellar.WM.total.volume | 0.001 | 0.003 | 0.61001 | 0.003 | 0.003 | 0.26 |
| Fusiform.gyrus.TA | −0.011 | 0.002 | <0.00001 | −0.001 | 0.002 | 0.51 |
| Inferior.parietal.TA | −0.011 | 0.002 | <0.00001 | 0 | 0.002 | 0.88 |
| Inferior.temporal.TA | −0.013 | 0.002 | <0.00001 | −0.001 | 0.002 | 0.69 |
| Middle.temporal.TA | −0.012 | 0.002 | <0.00001 | 0 | 0.002 | 0.95 |
ApoE4 rate is the additional rate for E4 positive subjects. A negative sign indicates greater atrophy over time. FH rate indicates the additional effect of FH after adjusting for age, gender and ApoE4. ApoE4 rates (of atrophy) for the amygdala, hippocampus and entorhinal cortex are several fold greater than the FH rates. The estimated rates are in units of percent increase in log volume per year: a value of 1.00 (approximately) represents a 1% increase in volume per year.
Fig. 1.
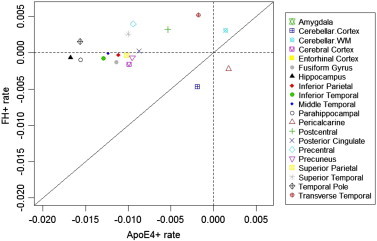
Comparison of atrophy rates due to ApoE4+ versus FH+. The diagonal line denotes equality of rates. Note that most FH+ rates (horizontal dotted line) are close to 0, while ApoE4+ rates have a wider spread from zero (vertical dotted line). Most FH effects are small relative to ApoE4+ effects. Negative values indicate atrophy.
3.3. Effect of FH on atrophy rates in ApoE ε3 homozygotes
Table 4 summarizes the model when fit to only ε3 homozygotes — there was no significant FH effect on any predicted region and effect sizes (Cohen's D) ranged from 0.05 to 0.22. For example, the FH effect size on the amygdala atrophy rate was −0.17 (p < 0.14). Exploratory analyses comparing the effect of FH in ApoE ε4+ versus ε 3/3 subjects showed that some regions exhibit a slightly greater FH effect on atrophy in the ε 3/3 group (e.g. amygdala) whereas some other regions have a greater FH effect in the ε4+ group (e.g. hippocampus) but none of these were statistically different.
Table 4.
Effect of FH on atrophy rates in ApoE 3/3 homozygotes.
| Primary regions | FH rate | Cohen's D for FH effect | FH p-value |
|---|---|---|---|
| Hippocampus.total.vol | 0.002 | 0.07 | 0.54939 |
| Amygdala.Total.Vol | −0.009 | −0.17 | 0.14095 |
| Entorhinal.cortex.TA | −0.001 | −0.04 | 0.70974 |
| Cerebral.cortex.total.vol | 0.001 | 0.04 | 0.72922 |
| Exploratory regions | |||
| Parahippocampal.TA | 0.002 | 0.06 | 0.61137 |
| Pericalcarine.TA | −0.005 | −0.22 | 0.0535 |
| Postcentral.TA | −0.001 | −0.03 | 0.77311 |
| Posterior.cingulate.TA | 0.002 | 0.1 | 0.3911 |
| Precentral.TA | −0.004 | −0.12 | 0.29272 |
| Precuneus.TA | 0.002 | 0.1 | 0.39153 |
| Superior.parietal.TA | −0.001 | −0.04 | 0.72119 |
| Superior.temporal.TA | 0.002 | 0.09 | 0.4295 |
| Temporal.pole.TA | −0.002 | −0.06 | 0.57661 |
| Transverse.temporal.TA | 0.005 | 0.13 | 0.26851 |
| Cerebellar.cortex.total.vol | 0.001 | 0.05 | 0.68839 |
| Cerebellar.WM.total.volume | −0.002 | −0.06 | 0.60951 |
| Fusiform.gyrus.TA | −0.003 | −0.11 | 0.35543 |
| Inferior.parietal.TA | 0 | 0.01 | 0.9105 |
| Inferior.temporal.TA | −0.003 | −0.13 | 0.27452 |
| Middle.temporal.TA | −0.001 | −0.06 | 0.59783 |
FH rate is the additional effect of FH after adjusting for age and gender. The estimated rate effects are in units of percent increase in log volume per year: a value of 1.00 (approximately) represents a 1% increase in volume per year. Negative values indicate atrophy. The amygdala is the only region that comes close to significance among the predicted regions.
3.4. Longitudinal cognitive data
Duration of follow-up available for cognition was longer than that available for MRI scans and we examined the baseline and last available time point within the 4 year window. Duration of follow-up tended to be longer in FH+ subjects (mean 43.7 months) than FH− subjects (mean 38.5 months) (p = 0.02). FH+ subjects (57%) had numerically higher rate of conversion from MCI to dementia than FH− subjects (45%) but the difference was not statistically significant. FH+ subjects (mean 7 points ±10) had numerically greater decline in cognition (ADAS-Cog) than FH− subjects (mean 5.7 points ±9) but the FH effect was not statistically significant in a multivariate model with age, gender, education, baseline cognition, E4 and time. Gender and ApoE4 genotype (p = 0.313) were significant in this model.
4. Discussion
To our knowledge, this is the first national long-term (up to 48 months) examination of the effects of FH on atrophy rates of multiple regions in MCI subjects at risk for future AD. We found that a positive FH was associated with accelerated atrophy rates for three key structures (amygdala, hippocampus, and entorhinal cortex) plus cortical gray volume in MCI but that the residual FH effect on atrophy rate, after covarying for ApoE E4, was no longer significant for any brain structure. The residual FH effect was also substantially smaller than that of the ApoE4 effect. We also found that in the subset of ApoE3 homozygotes, there was no significant FH effect on any key structure.
These data suggest that any missing heritability within FH (other than ApoE4) for explaining atrophy rate in MCI subjects is likely to be quite small and nonsignificant. Lastly, given the large size of the main E4 effect relative to the main FH effect in MCI subjects, our data suggests that much of the E4 effect may not be contained wholly in the FH effect. There appeared to be a weak interaction between ApoE status and FH in that the effect of FH on amygdala atrophy rates seemed larger in E3 homozygotes than E4 carriers, but this too was not significant.
Prior studies of FH effects on CSF [reviewed in Lampert, 2013] and FDG-PET [reviewed in Mosconi, 2007] biomarkers have generally found consistent changes. However, prior studies of FH effects on longitudinal hippocampal atrophy rates have yielded potentially conflicting findings (Honea, 2011; Andrawis, 2012; Okonkwo, 2012). Honea (2011) found a positive effect for maternal FH, independent of E4 status, on 2-year hippocampal atrophy rate in normal controls — and proposed that this supported the mitochondrial hypothesis of AD. Andrawis (2012) did not find a significant effect of FH on 1-year atrophy rates in normal controls or AD patients but did find an effect for maternal FH in MCI subjects. Yet another study of normal middle-aged adults, by Okonkwo (2012), found a FH effect on atrophy only in a posterior subregion of the hippocampus and only in E4− subjects — there was no FH effect in E4+ subjects. In addition, Okonkwo et al. found no significant difference between maternal and paternal FH on atrophy rate (Okonkwo, 2012). The follow-up in Okonkwo's study was 4-years and longer than prior studies but their controls were younger. These studies relied on just 2 MRI scans (baseline and follow-up) to extract atrophy rates.
Our study extends these data by examining MCI subjects over a longer follow-up period (3 MRI scans and up to 48 month follow-up) and by examining multiple brain regions. The use of 3 MRI scans over this period may have allowed for a more accurate estimate of the slope of change than in prior studies. Further, our examination of 20 different brain regions allowed us to examine changes in regions associated with cognitive brain circuits known to be affected early in AD. Overall, our data do not support a significant residual (after covarying for ApoE status) FH effect on rates of atrophy of any key brain region. Since we did not examine maternal versus paternal FH, our study cannot settle questions relating to the mitochondrial hypothesis.
A strength of this current study is the use of a relatively large sample of carefully selected MCI subjects, data collected in a standardized manner from many sites across the country, multiple imaging time points, and relatively long duration of follow-up. Nonetheless, there are still some limitations. FH status was ascertained via interviews with the subjects and their study partners, so it is possible that there may have been a reporter bias (for example, some respondents may not know the difference between AD and dementia). That said, our findings are still relevant because FH is collected by simple history in most clinics and biomarker research studies. We studied only MCI subjects and did not examine interactions of FH with amyloid or tau phenotypes. Prior studies have shown that amyloid positivity may be linked to E4 status [reviewed in Lampert, 2013] and accelerated atrophy [reviewed in Honea, 2011], and so it is conceivable that there may also be an interaction of amyloid status with FH. We also did not analyze subregions of the hippocampus and hence could not directly test findings that FH might affect only specific subregions (Okonkwo, 2012). We also did not examine the effect of FH on glucose metabolic status, another marker that has been linked to FH (Mosconi, 2007). Thus, our findings cannot be generalized to other biomarkers or other diagnostic groups. As stated earlier, we did not test maternal versus paternal FH since we did not collect that data. Likewise, we were unable to test parental versus sibling FH as there is a vast majority of patients with an affected parent (n = 51 parental, n = 9 both, n = 18 sibling; 77% parental) and therefore not enough power to separate the two. Thus, our study must be interpreted within these potential limitations.
Future directions of this study should include further analysis to determine if there are other genetic factors (e.g. whole genome data) in addition to ApoE4 that predict atrophy rates in brain regions susceptible to AD as well as studies examining the effect of FH on multiple biomarkers (MRI, CSF, PET) over longer periods of time. Since FH has been linked to beta-amyloid positivity and amyloid deposition in turn has been linked to atrophy, future studies should examine FH effects in healthy controls who are amyloid positive (i.e., preclinical AD). Only a subset of ADNI-1 subjects had CSF or amyloid PET data. ADNI2, where every subject underwent florbetapir PET, will allow for a better test of this theory in the near future. Such information may serve to further improve personalized testing and drug development for at-risk patients.
Abbreviations used for brain regions
| Experimental regions | Abbreviation |
|---|---|
| Hippocampus total volume | Hippocampus.total.vol |
| Amygdala total volume | Amygdala.total.vol |
| Entorhinal cortex | Entorhinal.cortex.TA |
| Parahippocampal TA | Parahippocampal.TA |
| Posterior cingulate TA | Posterior.cingulate.TA |
| Precuneus TA | Precuneus.TA |
| Superior.parietal TA | Superior.parietal.TA |
| Superior.temporal TA | Superior.temporal.TA |
| Temporal.pole TA | Temporal.pole.TA |
| Transverse.temporal TA | Transverse.temporal.TA |
| Cerebral cortex total vol | Cerebral.cortex.total.vol |
| Fusiform gyrus TA | Fusiform.gyrus.TA |
| Inferior parietal TA | Inferior.parietal.TA |
| Inferior temporal TA | Inferior.temporal.TA |
| Middle temporal TA | Middle.temporal.TA |
| Cerebellar cortex (total volume) | Cerebellar.cortex.total.vol |
| Cerebellar white mater (total volume) | Cerebellar.WM.total.volume |
| Pericalcarine cortex | Pericalcarine.TA |
| Postcentral gyrus | Postcentral.TA |
| Precentral gyrus | Precentral.TA |
Acknowledgments
Data collection and sharing for this project was funded by the Alzheimer's Disease Neuroimaging Initiative (ADNI) (National Institutes of Health grant U01 AG024904) and DOD ADNI (Department of Defense award number W81XWH-12-2-0012). ADNI is funded by the National Institute on Aging, the National Institute of Biomedical Imaging and Bioengineering, and through generous contributions from the following: Alzheimer's Association; Alzheimer's Drug Discovery Foundation; BioClinica, Inc.; Biogen Idec Inc., Bristol-Myers Squibb Company; Eisai Inc.; Elan Pharmaceuticals, Inc.; Eli Lilly and Company; F. Hoffmann-La Roche Ltd and its affiliated company Genentech, Inc.; GE Healthcare; Innogenetics, N.V.; IXICO Ltd; Janssen Alzheimer Immunotherapy Research & Development, LLC; Johnson & Johnson Pharmaceutical Research & >Development LLC; Medpace, Inc.; Merck & Co., Inc.; Meso Scale Diagnostics, LLC; NeuroRx Research; Novartis Pharmaceuticals Corporation; Pfizer Inc.; Piramal Imaging; Servier; Synarc Inc.; and Takeda Pharmaceutical Company. The Canadian Institutes of Health Research is providing funds to support ADNI clinical sites in Canada. Private sector contributions are facilitated by the Foundation for the National Institutes of Health (http://www.fnih.org). The grantee organization is the Northern California Institute for Research and Education, and the study is coordinated by the Alzheimer's disease Cooperative Study at the University of California, San Diego. ADNI data are disseminated by the Laboratory for Neuro Imaging at the University of Southern California.
PMD and JRP have received research grants and/or advisory fees from several government agencies, advocacy groups and pharmaceutical/imaging companies. PMD received a grant from ADNI to support data collection for this study and he owns stock in Sonexa, Maxwell, Adverse Events and Clarimedix, whose products are not discussed here. EJL was supported by the Wrenn Clinical Research Scholar award.
Contributor Information
Erika J. Lampert, Email: ejlampert@gmail.com.
Kingshuk Roy Choudhury, Email: kingshuk.roy.choudhury@duke.edu.
Christopher A. Hostage, Email: cah1289@gmail.com.
Bharath Rathakrishnan, Email: bg.rathakrishnan@gmail.com.
Michael Weiner, Email: Michael.weiner@ucsf.edu.
Jeffrey R. Petrella, Email: jeffrey.petrella@duke.edu.
P. Murali Doraiswamy, Email: murali.doraiswamy@duke.edu.
Supplementary materials
Classification, clinical diagnosis, and ApoE genotyping
Specific exclusion criteria for the ADNI study included: presence of other significant neurologic disease; baseline MR scans showing evidence of infection, infarction, or other focal lesion or multiple lacunes; and those with pacemakers, aneurysm clips or other devices which prevent them from receiving MR imaging. In addition, subjects were excluded due to the presence of major depression, psychotic features, alcohol/substance abuse or dependence in previous 2 years; significant medical illness or laboratory abnormalities (B12, RPR, TFTs) that might have interfered with the study; residence in a skilled nursing facility; or current use of warfarin or certain other psychoactive medications.
MR cortical thickness and volume derivations
Briefly, this processing includes motion correction and averaging (Tanzi, 2012) of multiple volumetric T1 weighted images (when more than one is available), removal of nonbrain tissue using a hybrid watershed/surface deformation procedure (Mahley and Rall, 2000), automated Talairach transformation, and segmentation of the subcortical white matter and deep gray matter volumetric structures (including the hippocampus, amygdala, caudate, putamen, and ventricles) (Cupples, 2004). It also involves intensity normalization (Silverman, 1994), tessellation of the gray matter white matter boundary, automated topology correction (Lampert, 2013; Honea, 2011) and surface deformation following intensity gradients to optimally place the gray/white and gray/cerebrospinal fluid borders at the location where the greatest shift in intensity defines the transition to the other tissue class (Xiong, 2011; Andrawis, 2012; Okonkwo, 2012). Once the cortical models are complete, a number of deformable procedures can be performed for further data processing and analysis including surface inflation (Weiner, 2010), registration to a spherical atlas which utilized individual cortical folding patterns to match cortical geometry across subjects (ADNI, 2013), parcellation of the cerebral cortex into units based on gyral and sulcal structures (Alzheimer's Disease Neuroimaging Initiative, 2013; Ségonne, 2004) and creation of a variety of surface based data including maps of curvature and sulcal depth. This method uses both intensity and continuity information from the entire three dimensional MR volume in segmentation and deformation procedures to produce representations of cortical thickness, calculated as the closest distance from the gray/white boundary to the gray/CSF boundary at each vertex on the tessellated surface (Fischl, 2002). The maps are created using spatial intensity gradients across tissue classes and are therefore not simply reliant on absolute signal intensity. The maps produced are not restricted to the voxel resolution of the original data thus are capable of detecting sub-millimeter differences between groups. Procedures for the measurement of cortical thickness have been validated against histological analysis (Sled et al., 1998) and manual measurements (Fischl et al., 2001; Fischl et al., 1999). FreeSurfer morphometric procedures have been demonstrated to show good test–retest reliability across scanner manufacturers and across field strengths (Fischl and Dale, 2000; Han, 2006).
Longitudinal processing has been performed with the longitudinal stream in FreeSurfer, where an unbiased within-subject template space and average image (Hostage, et al., 2014) is created using robust, inverse consistent registration (Cupples, 2004). Information from this subject template is used to initialize the longitudinal image processing in several locations to increase repeatability and statistical power.
References
- ADNI . ADNI Procedures Manual. 2013. Available from: http://Adni.loni.usc.edu/wp-content/uploads/2010/09/ADNI_GeneralProceduresManual.pdf [cited 2013 September 19] [Google Scholar]
- Alzheimer's Disease Neuroimaging Initiative . Study Documents. 2013. Available from: http://Adni.loni.usc.edu/methods/documents/ [cited 2013 September 19] [Google Scholar]
- Andrawis J.P. Effects of ApoE4 and maternal history of dementia on hippocampal atrophy. Neurobiology of Aging. 2012;33(5):856–866. doi: 10.1016/j.neurobiolaging.2010.07.020. 20833446 [DOI] [PMC free article] [PubMed] [Google Scholar]
- Cupples L.A. Estimating risk curves for first-degree relatives of patients with Alzheimer's disease: the REVEAL study. Genetics in Medicine: Official Journal of the American College of Medical Genetics. 2004;6(4):192–196. doi: 10.1097/01.gim.0000132679.92238.58. 15266206 [DOI] [PubMed] [Google Scholar]
- Fischl B., Dale A.M. Measuring the thickness of the human cerebral cortex from magnetic resonance images. Proceedings of the National Academy of Sciences of the United States of America. 2000;97(20):11050–11055. doi: 10.1073/pnas.200033797. 10984517 [DOI] [PMC free article] [PubMed] [Google Scholar]
- Fischl B. Whole brain segmentation: automated labeling of neuroanatomical structures in the human brain. Neuron. 2002;33(3):341–355. doi: 10.1016/s0896-6273(02)00569-x. 11832223 [DOI] [PubMed] [Google Scholar]
- Fischl B., Liu A., Dale A.M. Automated manifold surgery: constructing geometrically accurate and topologically correct models of the human cerebral cortex. IEEE Transactions on Medical Imaging. 2001;20(1):70–80. doi: 10.1109/42.906426. 11293693 [DOI] [PubMed] [Google Scholar]
- Fischl B., Sereno M.I., Dale A.M. Cortical surface-based analysis. II: inflation, flattening, and a surface-based coordinate system. Neuroimage. 1999;9(2):195–207. doi: 10.1006/nimg.1998.0396. 9931269 [DOI] [PubMed] [Google Scholar]
- Han X. Reliability of MRI-derived measurements of human cerebral cortical thickness: the effects of field strength, scanner upgrade and manufacturer. Neuroimage. 2006;32(1):180–194. doi: 10.1016/j.neuroimage.2006.02.051. 16651008 [DOI] [PubMed] [Google Scholar]
- Honea R.A. Progressive regional atrophy in normal adults with a maternal history of Alzheimer disease. Neurology. 2011;76(9):822–829. doi: 10.1212/WNL.0b013e31820e7b74. 21357834 [DOI] [PMC free article] [PubMed] [Google Scholar]
- Hostage C.A. Mapping the effect of the apolipoprotein E genotype on 4-year atrophy rates in an Alzheimer disease-related brain network. Radiology. 2014;271(1):211–219. doi: 10.1148/radiol.13131041. 24475827 [DOI] [PMC free article] [PubMed] [Google Scholar]
- Lampert E.J. Prevalence of Alzheimer's pathologic endophenotypes in asymptomatic and mildly impaired first-degree relatives. PloS One. 2013;8(4):e60747. doi: 10.1371/journal.pone.0060747. 23613741 [DOI] [PMC free article] [PubMed] [Google Scholar]
- Mahley R.W., Rall S.C., Jr. Apolipoprotein E: far more than a lipid transport protein. Annual Review of Genomics and Human Genetics. 2000;1:507–537. doi: 10.1146/annurev.genom.1.1.507. 11701639 [DOI] [PubMed] [Google Scholar]
- Mosconi L. Maternal family history of Alzheimer's disease predisposes to reduced brain glucose metabolism. Proceedings of the National Academy of Sciences of the United States of America. 2007;104(48):19067–19072. doi: 10.1073/pnas.0705036104. 18003925 [DOI] [PMC free article] [PubMed] [Google Scholar]
- Okonkwo O.C. Family history of Alzheimer disease predicts hippocampal atrophy in healthy middle-aged adults. Neurology. 2012;78(22):1769–1776. doi: 10.1212/WNL.0b013e3182583047. 22592366 [DOI] [PMC free article] [PubMed] [Google Scholar]
- Ségonne F. A hybrid approach to the skull stripping problem in MRI. Neuroimage. 2004;22(3):1060–1075. doi: 10.1016/j.neuroimage.2004.03.032. 15219578 [DOI] [PubMed] [Google Scholar]
- Silverman J.M. Patterns of risk in first-degree relatives of patients with Alzheimer's disease. Archives of General Psychiatry. 1994;51(7):577–586. doi: 10.1001/archpsyc.1994.03950070069012. 8031231 [DOI] [PubMed] [Google Scholar]
- Sled J.G., Zijdenbos A.P., Evans A.C. A nonparametric method for automatic correction of intensity nonuniformity in MRI data. IEEE Transactions on Medical Imaging. 1998;17(1):87–97. doi: 10.1109/42.668698. 9617910 [DOI] [PubMed] [Google Scholar]
- Tanzi R.E. The genetics of Alzheimer disease. Cold Spring Harbor Perspectives in Medicine. 2012;2(10):a006296. doi: 10.1101/cshperspect.a006296. [DOI] [PMC free article] [PubMed] [Google Scholar]
- Weiner M.W. The Alzheimer's Disease Neuroimaging Initiative: Progress report and future plans. Alzheimer’s & Dementia: the Journal of the Alzheimer’s Association. 2010;6(3):202–211. doi: 10.1016/j.jalz.2010.03.007. 20451868 [DOI] [PMC free article] [PubMed] [Google Scholar]
- Xiong C. Role of family history for Alzheimer biomarker abnormalities in the adult children study. Archives of Neurology. 2011;68(10):1313–1319. doi: 10.1001/archneurol.2011.208. 21987546 [DOI] [PMC free article] [PubMed] [Google Scholar]