

Abstract
Over the past years, several studies on Mild Cognitive Impairment (MCI) and Alzheimer's disease (AD) have reported Default Mode Network (DMN) deficits. This network is attracting increasing interest in the AD community, as it seems to play an important role in cognitive functioning and in beta amyloid deposition. Attention has been particularly drawn to how different DMN regions are connected using functional or structural connectivity. To this end, most studies have used functional Magnetic Resonance Imaging (fMRI), Positron Emission Tomography (PET) or Diffusion Tensor Imaging (DTI). In this study we evaluated (1) functional connectivity from resting state magnetoencephalography (MEG) and (2) structural connectivity from DTI in 26 MCI patients and 31 age-matched controls. Compared to controls, the DMN in the MCI group was functionally disrupted in the alpha band, while no differences were found for delta, theta, beta and gamma frequency bands. In addition, structural disconnection could be assessed through a decreased fractional anisotropy along tracts connecting different DMN regions. This suggests that the DMN functional and anatomical disconnection could represent a core feature of MCI.
Keywords: Default mode network, Mild cognitive impairment, Magnetoencephalography, Functional connectivity, Alpha band, Structural connectivity, Diffusion tensor imaging, Tractography
Highlights
We studied functional and structural connectivity in MCI patients and controls.
We focused on the connections between regions in the Default Mode Network.
Resting state alpha-band functional connectivity was decreased in MCI.
The integrity of the structural connections was lower for the MCI group.
Functional and structural connectivity correlated in the alpha band in both groups.
1. Introduction
Mild Cognitive Impairment (MCI) is a clinical condition that is often seen as an intermediate stage between normal aging and Alzheimer's disease (AD). MCI patients show a cognitive decline that is not severe enough to be classified as dementia. However, they have a higher conversion rate to dementia than their age-matched controls, particularly of the Alzheimer type (10–15% annually for MCIs versus 1–4% for controls) (Petersen and Negash, 2008; Petersen, 2001). Over the past few years a lot of attention has been given to this MCI stage, as a deeper understanding of its pathological basis could help understand or delay AD.
The pathophysiology of AD involves the Default Mode Network (DMN). This network was first introduced in Raichle et al. (2001). and has garnered increasing attention from the neuroscience and neurology communities ever since (for a review, see Rosazza and Minati, 2011). It is highly active during an idle state, it deactivates during task performance, and it includes brain regions such as the precuneus, posterior and anterior cingulate, and the inferior parietal cortex (Buckner et al., 2008; Greicius et al., 2003; Raichle and Snyder, 2007). The precuneus and posterior cingulate cortex have been found to be relevant in AD as they show decreased metabolic activity (Matsuda, 2001) and accumulate beta-amyloid plaques at an early stage in the disease (Mintun et al., 2006). DMN alterations such as decreased activity and connectivity have been reported in AD and MCI (Agosta et al., 2012; Greicius et al., 2004; Jones et al., 2011; Qi et al., 2010; Rombouts et al., 2005; Sorg et al., 2007). Furthermore, these alterations were found to be related to the severity of the disease and its progression (Brier et al., 2012; Petrella et al., 2011).
To date, functional Magnetic Resonance Imaging (fMRI) is the most widespread technique used to explore the DMN in MCI or AD. Blood-oxygenation-level-dependent (BOLD) fMRI signals measure hemodynamic responses to neuronal activity with great spatial resolution and have led to the discovery of multiple resting state networks, including the DMN. Other imaging modalities can also provide insight into DMN integrity in MCI: structural MRI reveals brain atrophy; Diffusion Tensor Imaging (DTI) reconstructs white matter tracts; Positron Emission Tomography (PET) detects metabolic activity or beta-amyloid plaques and magnetoencephalography/electroencephalography (MEG/EEG) measures magnetic/electric fields generated by neural currents. Based on this fact, researchers have combined fMRI (often controlling for brain atrophy with T1-weighted structural MRI) with other neuroimaging modalities such as PET (Hedden et al., 2009; Sheline et al., 2010; Sperling et al., 2009) and DTI (Wee et al., 2012), or DTI with PET (Bozoki et al., 2012) to investigate DMN functional and structural connectivity impairment in AD and MCI.
While fMRI and PET give an indirect estimation of neural activity, EEG and MEG are direct measures of neural firing. Therefore, these neurophysiological techniques enable us to gain a better understanding of the time–frequency dynamics of the DMN, providing us with useful information as to how its regions are connected at different frequency bands. Complementary structural information about DMN connectivity is given by DTI, as it enables the modeling of the white matter connections that support the network. Using this technique, we can compute direct or weighted structural connectivity measures that estimate the number of tracts connecting two regions and the integrity of anatomical connections, respectively. However, thus far, the combination of MEG and DTI has not been used to unravel DMN abnormalities in MCI. In this study, we investigated the DMN in MCI patients compared to age-matched controls using resting-state MEG and DTI data to extract both functional and structural networks. The purpose of the study was to determine the functional connections that were altered in MCI relative to controls at different frequency bands, and how this relates to the underlying structural network. For that, source space MEG functional connectivity (FC) was computed and two different structural connectivity (SC) measures were used to evaluate whether the amount of tracts or their integrity influences the organization of the functional networks. Our initial hypothesis is that both functional and structural connections will be significantly impaired in MCI patients and there will be a strong correlation between functional and structural connectivity abnormalities.
2. Materials and methods
2.1. Subjects
This study included 26 patients with a diagnosis of amnestic-MCI and 31 age-matched controls. MCI patients were diagnosed by clinical experts. Criteria for MCI included: (1) memory complaint confirmed by an informant, (2) normal cognitive function, (3) none or minimal impairment in activities of daily life, (4) abnormal memory function, and (5) not being sufficiently impaired to meet the criteria for dementia (Grundman et al., 2004). Table 1 summarizes the subject's characteristics.
Table 1.
Subject characteristics. Data are given as mean ± standard deviation. M = males, F = females, educational level was grouped into five levels: 1: illiterate, 2: primary studies, 3: elemental studies, 4: high school studies, 5: university studies. MMSE = Mini mental state examination score. Controls and MCIs differed in MMSE (p = 0.0012) and educational level (p = 0.03), and did not differ in age (p = 0.39) or sex (p = 0.44).
| n | Age (years) | Sex (F/M) | MMSE | Educational level | |
|---|---|---|---|---|---|
| Control | 31 | 70.8 ± 4.2 | 21/10 | 29.5 ± 0.7 | 3.5 ± 1.2 |
| MCI | 26 | 72.5 ± 6.7 | 15/11 | 27.7 ± 2.4 | 2.8 ± 1.3 |
Additionally, all participants were in good health and had no history of psychiatric or other neurological disorders (other than MCI). They underwent an MRI brain scan to rule out infection, infarction or focal lesions. Meeting any of the following conditions was considered an exclusion criterion: Hachinski score (Rosen et al., 1980) higher than 4, Geriatric Depression Scale score (Yesavage et al., 1982–1983) higher than 14, chronic use of anxiolytics, neuroleptics, narcotics, anticonvulsants, or sedative–hypnotics or a history of alcoholism. MCI patients underwent medical tests to rule out possible causes of cognitive decline such as B12 vitamin deficiency, thyroid problems, syphilis, or HIV. The investigation was approved by the local Ethics Committee.
2.2. MEG acquisition
Three-minute MEG resting-state recordings were acquired at the Center for Biomedical Technology (Madrid, Spain) using an Elekta Vectorview system with 306 sensors (102 magnetometers and 204 planar gradiometers), inside a magnetically shielded room (Vacuumschmelze GmbH, Hanau, Germany). During the measurements, subjects sat with their eyes closed and were instructed to remain calm and move as little as possible. A Fastrak Polhemus system digitized each subject's head and four coils were attached to the forehead and mastoids, so that the head position with respect to the MEG helmet was continuously determined. Activity in electrooculogram channels was also recorded to keep track of ocular artifacts.
Signals were sampled at 1000 Hz with an online filter of bandwidth 0.1–300 Hz. Maxfilter software (version 2.2, Elekta Neuromag) was used to remove external noise with the temporal extension of the signal space separation (tsss) method with movement compensation (Taulu and Simola, 2006).
2.3. MRI acquisition
3D T1 weighted anatomical brain MRI scans were collected with a General Electric 1.5 T magnetic resonance scanner, using a high-resolution antenna and a homogenization PURE filter (Fast Spoiled Gradient Echo (FSPGR) sequence with parameters: TR/TE/TI = 11.2/4.2/450 ms; flip angle 12°; 1 mm slice thickness, a 256 × 256 matrix and FOV 25 cm). For MEG source analysis, the reference system of the T1 volumes was transformed manually using 3 fiducial points and head shape, until a good match between MEG and T1 coordinates was reached. Diffusion weighted images (DWI) were acquired with a single shot echo planar imaging sequence with the following parameters: TE/TR 96.1/12,000 ms; NEX 3 for increasing the SNR; 2.4 mm slice thickness, 128 × 128 matrix and 30.7 cm FOV yielding an isotropic voxel of 2.4 mm; 1 image with no diffusion sensitization (i.e., T2-weighted b0 images) and 25 DWI (b = 900 s/mm2).
2.4. Definition of the Regions of Interest
For this bimodal connectivity analysis, we defined Regions of Interest (ROIs) in the individual's structural T1 volume using the Freesurfer (version 5.1.0) cortical parcellation in 66 regions (Desikan et al., 2006), such as in Hagmann et al. (2008) and Honey et al. (2009). We selected four ROIs per hemisphere, which are the most common brain structures included in the DMN (Buckner et al., 2008; Greicius et al., 2003; Raichle and Snyder, 2007): precuneus (lPr and rPr), anterior cingulate (lAC and rAC), posterior cingulate (lPC and rPC) and inferior parietal (lIP and rIP).
2.5. MEG functional connectivity (FC)
MEG preprocessing and source reconstruction were performed with FieldTrip software (Oostenveld et al., 2011).
2.5.1. MEG source reconstruction
First, ocular, jump and muscular artifacts were identified and located in the 3 minute resting state recordings. Then, the continuous resting time-series were segmented into artifact-free segments of 4 s. All subjects had a minimum of 16 artifact-free segments (control: (27.5 ± 5.9), MCI: (27.2 ± 6.1)). Data was filtered in the 1–45 Hz band for spectral analysis and in delta (2–4 Hz), theta (4–8 Hz), alpha (8–12 Hz), low beta (12–20 Hz), high beta (20–30 Hz) and gamma (30–45 Hz) bands and for the functional connectivity analysis. To do so while avoiding edge effects, the continuous 3 minute data was first filtered with a finite impulse response filter of order 1000, and then the artifact-free segments were extracted for further analysis.
Source locations were defined in the subject's space using the cortical segmentation produced by Freesurfer. A regular mesh of points with 1 cm spacing was created inside each ROI. The number of source locations depended on individual's data (control: (124 ± 14), MCI: (118 ± 15)). The forward model was solved with a realistic single-shell model (Nolte, 2003).
Source reconstruction was performed with Linearly Constrained Minimum Variance beamformer (Van Veen et al., 1997) separately for each frequency band. For each subject, the average covariance matrix over all trials was used to compute the spatial filter's coefficients, and then these coefficients were applied to individual trials, obtaining a time series per segment and source location. To avoid mixing MEG sensors with different sensitivities or resorting to scaling, only magnetometers were used for this source reconstruction step. We must note, however, that gradiometer information is indirectly present as both magnetometers and gradiometers were used in the tsss filtering.
2.5.2. Preliminary power spectrum analysis
The goal of this work was to study functional connectivity in classical frequency bands, defined with fixed frequency limits (see Subsection 2.5.1). Prior to that, we tested if power spectrum was altered in the MCI sample in these frequency bands. Power spectra were obtained from the time series via a multitaper method with discrete prolate spheroidal sequences as tapers and 1 Hz smoothing for frequencies between 2 and 45 Hz, with a 0.25 Hz step. The average spectra over trials was used and normalized with the sum of the spectral power in the range [2–45] Hz. Then, an average power spectrum per ROI and subject was obtained. Power was averaged per frequency band and Mann–Whitney tests were performed to compare power values between controls and MCIs. Alpha peaks were computed as in Garcés et al. (2013) to evaluate a possible slowing of the spectra.
2.5.3. Functional connectivity
Functional connectivity (FC) was obtained from the source reconstruction with the amplitude correlation method (Brookes et al., 2011a). For this, the amplitude of the bandpass filtered time series was extracted with Hilbert transforms and correlation coefficients between the amplitude of all source locations were computed. Then, connectivity values were averaged over links connecting the same ROIs, producing an average 8 × 8 connectivity matrix per subject. Additionally, we calculated the correlation between beamformer weights in both groups in order to have an estimate of volume conduction.
2.6. Structural connectivity (SC)
Diffusion weighted images were pre-processed with FMRIB's Diffusion Toolbox (FDT) (http://fsl.fmrib.ox.ac.uk/fsl/fslwiki/FslOverview/). Pre-processing consisted of eddy-current correction, motion correction and removal of non-brain tissue using the robust Brain Extraction Tool (Smith, 2002).
Diffusion Toolkit (DTK — http://www.trackvis.org) was used to fit the diffusion tensor model. We used tensorline tractography (Lazar et al., 2003) to estimate the fiber tracts between the selected ROIs. Stopping criteria for the streamline propagation were a maximum angle of 35° between consecutive steps and a lower threshold of fractional anisotropy of 0.2 (Johansen-Berg et al., 2004). A streamline was considered a connection between two ROIs if it entered at least one voxel of each ROI. We then computed two different SC estimates: direct SC (dSC) and weighted SC (wSC). dSC was defined as the number of streamlines connecting a given pair of ROIs and represents the number of tracts that connect two ROIs. wSC is weighted with fractional anisotropy (FA) and evaluates the integrity of the structural connection:
where N = dSC is the number of streamlines connecting a pair of ROIs, v = 1…Vn is the set of voxels that are crossed by a given streamline n and FAn,v is the fractional anisotropy in the voxel v of the streamline n.
2.7. Statistical analysis
To examine the differences between controls and MCIs in spectral power and functional or structural connectivity we used non-parametric Mann–Whitney tests. In all cases, in order to correct for multiple comparisons we followed a permutation approach which was introduced by Maris and Oostenveld (2007). First, the original values were 2000 times randomly assigned to the original groups (controls and MCIs) and a Mann–Whitney test was performed for each randomization. Then, the U-value original dataset was compared to the ones obtained with the randomized data. The final p-value was defined as the proportion of permutations with U-values higher than the one in the original data.
3. Results
3.1. MEG power spectrum
Preliminary spectral analyses were carried out to determine whether power spectrum was altered in MCI. MCIs tended to have higher spectral power in the theta band, and lower power in the beta and gamma bands, but no significant differences were obtained. Alpha peak frequency was lower for MCIs than for controls in all ROIs, although differences were only significant for the inferior parietal cortex bilaterally (p < 0.05).
3.2. Functional connectivity
MEG FC networks differed significantly between controls and MCIs in the alpha band, while no differences were found for the delta, theta, beta and gamma bands. Table 2 contains the p-values of the statistical analysis for each link and frequency band. In the alpha band, functional connectivity was lower in the MCI group, especially in links including Pr and IP, as displayed in Fig. 1. To determine whether volume conduction could be causing these differences, we calculated the correlation between beamforming weights, which is an estimate of source leakage. If two source locations have similar weights (or a high correlation between their weights), the reconstructed time series would be highly correlated. In the opposite case, if two source locations have a low weight correlation but the corresponding reconstructed time series are correlated, it is unlikely that the high correlation results from volume conduction. Beamformer weights did not differ between controls and MCIs in any frequency band, which makes it unlikely that the functional connectivity differences were caused by volume conduction.
Table 2.
Functional and structural connectivity differences between controls and MCIs. p-Values are indicated for each link, after correction for multiple comparisons. Significant p-values (p < 0.05) are shown in bold. All significant differences corresponded to MCI < control. For structural connectivity, n.i. indicates that this link was not included in the statistical analysis (Pr: precuneus, IP: inferior parietal, PC: posterior cingulate, AC: anterior cingulate, l: left, r: right).
| Link | Functional connectivity |
Structural connectivity | |||||
|---|---|---|---|---|---|---|---|
| Delta | Theta | Alpha | Low beta | High beta | Gamma | ||
| lPr–rPr | 0.32 | 0.40 | 0.24 | 0.29 | 0.24 | 0.34 | 0.06 |
| lPr–lPC | 0.18 | 0.19 | 0.15 | 0.12 | 0.55 | 0.20 | 0.10 |
| lPr–rPC | 0.73 | 0.56 | 0.78 | 0.37 | 0.35 | 0.55 | 0.005 |
| lPr–lIP | 0.44 | 0.32 | 0.004 | 0.46 | 0.42 | 0.65 | 0.13 |
| lPr–rIP | 0.26 | 0.87 | 0.012 | 0.19 | 0.74 | 0.54 | 0.024 |
| lPr–lAC | 0.68 | 0.46 | 0.014 | 0.97 | 0.34 | 0.35 | 0.26 |
| lPr–rAC | 0.68 | 0.69 | 0.08 | 0.82 | 0.77 | 0.72 | n.i. |
| rPr–lPC | 0.23 | 0.23 | 0.15 | 0.09 | 0.16 | 0.08 | 0.052 |
| rPr–rPC | 0.99 | 0.96 | 0.47 | 0.85 | 0.85 | 0.82 | 0.15 |
| rPr–lIP | 0.87 | 0.77 | 0.003 | 0.06 | 0.29 | 0.29 | 0.014 |
| rPr–rIP | 0.09 | 0.21 | 0.002 | 0.08 | 0.72 | 0.65 | 0.072 |
| rPr–lAC | 0.18 | 0.71 | 0.008 | 0.68 | 0.60 | 0.18 | n.i. |
| rPr–rAC | 0.82 | 0.35 | 0.29 | 0.25 | 0.59 | 0.12 | 0.17 |
| lPC–rPC | 0.75 | 0.43 | 0.73 | 0.29 | 0.42 | 0.59 | 0.007 |
| lPC–lIP | 0.30 | 0.61 | 0.45 | 0.78 | 0.78 | 0.93 | 0.008 |
| lPC–rIP | 0.90 | 0.99 | 0.004 | 0.12 | 0.89 | 0.87 | 0.029 |
| lPC–lAC | 0.17 | 0.42 | 0.30 | 0.92 | 0.22 | 0.89 | 0.49 |
| lPC–rAC | 0.71 | 0.59 | 0.07 | 0.85 | 0.23 | 0.25 | n.i. |
| rPC–lIP | 0.36 | 0.51 | 0.34 | 0.13 | 0.38 | 0.97 | 0.002 |
| rPC–rIP | 0.88 | 0.83 | 0.09 | 0.19 | 0.79 | 0.89 | 0.041 |
| rPC–lAC | 0.27 | 0.22 | 0.003 | 0.84 | 0.38 | 0.13 | n.i. |
| rPC–rAC | 0.52 | 0.97 | 0.38 | 0.85 | 0.41 | 0.82 | 0.75 |
| lIP–rIP | 0.83 | 0.58 | 0.009 | 0.21 | 0.32 | 0.85 | 0.11 |
| lIP–lAC | 0.54 | 0.55 | 0.40 | 0.27 | 1.00 | 0.85 | n.i. |
| lIP–rAC | 0.60 | 0.51 | 0.93 | 0.29 | 0.87 | 0.78 | n.i. |
| rIP–lAC | 0.84 | 0.72 | 0.06 | 0.97 | 0.85 | 0.08 | n.i. |
| rIP–rAC | 0.30 | 0.26 | 0.50 | 0.67 | 0.65 | 0.38 | n.i. |
| lAC–rAC | 0.79 | 0.74 | 0.94 | 0.98 | 0.94 | 0.94 | 0.031 |
Fig. 1.
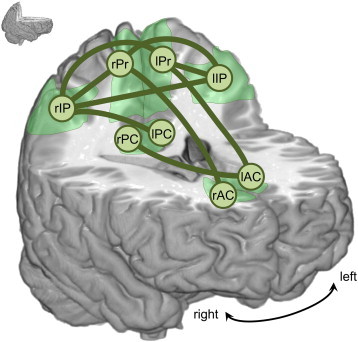
Functional connectivity: differences between controls and MCIs in the alpha band. Green links display connections with a significant decrease in MEG functional connectivity in the MCI group (p < 0.05). ROIs are represented as circles (Pr: precuneus, IP: inferior parietal, PC: posterior cingulate, AC: anterior cingulate, l: left, r: right).
3.3. Structural connectivity
Streamlines connecting all ROIs were reconstructed with tensorline tractography, yielding a dSC measure. Thousands of streamlines were found between most ROIs (on average over all links and subjects, dSC = 4413 ± 5594 tracts, given as mean ± std). Higher dSC values (~104) were obtained between pairs of neighboring regions (such as lPr–rPr, lAC–rAC or lPC–rPC). Conversely, lower dSC values were found (~102) for some long distance connections such as AC–Pr and AC–IP. Small amounts of reconstructed tracts, especially in long connections, can be caused by the inherent limitations of the DTI and tractography techniques: fiber crossing, fanning or kissing impair the accuracy of the tractography. To control for this effect, links between ROIs were not included in the statistical analysis if, for at least three subjects, less than 100 streamlines were reconstructed (dSC < 100). Following this criterion, the following 8 links were removed from the statistical analysis: lAC–lIP, lAC–rIP, rAC–lIP, rAC–rIP, lAC–rPr, rAC–lPr, lAC–rPC and rAC–lPC. For the remaining links, we compared dSC and wSC (the mean fractional anisotropy along the reconstructed tracts) between controls and MCIs. No differences were found for dSC (p < 0.05). However, wSC was significantly lower in the MCI group than in the control group (p < 0.05), especially in links involving IP and PC, as displayed in Fig. 2. p-Values for each link are included in Table 2.
Fig. 2.
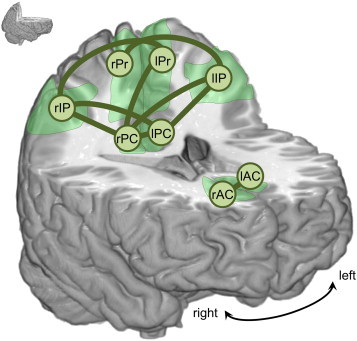
Structural connectivity: differences between controls and MCIs. Green links display connections with a significant decrease in weighted structural connectivity (wSC) in the MCI group (p < 0.05). ROIs are represented as circles (Pr: precuneus, IP: inferior parietal, PC: posterior cingulate, AC: anterior cingulate, l: left, r: right).
3.4. Correlation between FC and SC
To determine the relationship between FC and SC, we examined how FC values changed with dSC and wSC for all links and subjects with Spearman correlations, as shown in Fig. 3. All links between ROIs with dSC > 100 were used for analyses. FC and dSC were positively correlated in both MCIs (r = 0.68, p < 10−5) and controls (r = 0.69, p < 10−5), and high values of FC corresponded with high dSC values. FC and wSC were not significantly correlated for MCIs (r = 0.03, p = 0.48) or controls (r = –0.01, p = 0.84). For both dSC and wSC, the dependency pattern was similar for controls and MCIs.
Fig. 3.
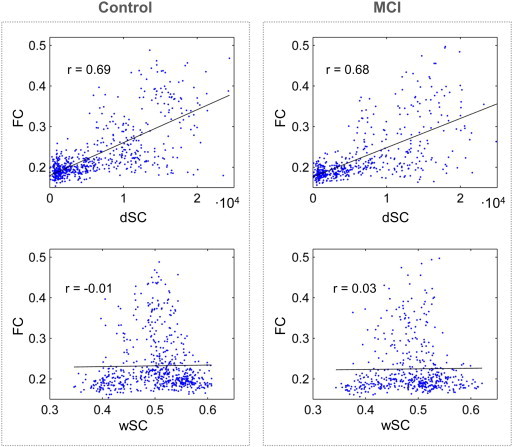
Relation between structural and functional connectivity. Functional connectivity (FC) as a function of structural connectivity (SC) for all subjects and pairs of ROIs, separately for controls and MCIs (in the left and right columns respectively). The dependence with the direct SC (dSC) is shown in the top row, and the dependence with fractional anisotropy weighted SC (wSC) is shown in the bottom row. The Spearman correlation coefficient between FC and SC is plotted along in each case.
4. Discussion
In this study, we examined FC and SC within the DMN in a sample of MCI patients and healthy elderly subjects. FC derived from MEG source space reconstruction of resting state data, and SC was extracted from tensorline tractography of DTI images. Three main findings were obtained. Firstly, the DMN was functionally disrupted in the MCI group, specifically in the alpha band, as shown by a decreased FC relative to controls. Secondly, the DMN was also structurally damaged in the MCI group, as indicated by a reduction in fractional anisotropy along the reconstructed white matter pathways connecting DMN regions. Lastly, FC and dSC measures were related, while no significant correlation was obtained for wSC.
The overall results are in line with some previous studies in MCI. Functional disruption of the DMN in MCI has already been reported in fMRI experiments (Agosta et al., 2012; Sorg et al., 2007). Recent reports indicate that lower FC values relate to a worse performance in cognitive tests, a higher conversion rate from MCI to AD (Binnewijzend et al., 2012) or to AD progression (Damoiseaux et al., 2012). Thus, FC appears to offer valuable information in the MCI–AD continuum. Using fMRI, Sambataro et al. (2010) observed that FC in the DMN decreased with age along with task performance in a sample of healthy young and old subjects.
Our MEG findings confirm and extend the notion that the DMN is functionally impaired in MCI, and show that this connectivity disruption occurs specifically in the alpha frequency band, while no differences were found in delta, theta, beta or gamma frequency bands. Alpha band alterations are in fact well-known in MCI and they have been shown to relate for instance to the stability of the clinical condition (Babiloni et al., 2011) or amygdalo–hippocampal atrophy (Moretti et al., 2009). Additionally, the alpha band seems to be the most relevant frequency band in the DMN, even in healthy subjects. For instance, Brookes et al. (2011b) performed an independent component analysis to extract resting state networks from MEG data, and achieved a great similarity for the DMN between fMRI and MEG data filtered in the alpha band. Knyazev et al. (2011) identified the DMN exclusively in the alpha band using EEG activity during rest and during the performance of a cognitive task, and Mayhew et al. (2013) demonstrated an interaction between alpha power and fMRI responses in the DMN. For this study, this could imply that the coupling between DMN regions is impaired in MCI in its main working rhythm (alpha), while their connectivity remains unaffected for the other frequency bands.
With regard to SC, anatomical disconnection or loss of white matter integrity (often assessed through fractional anisotropy) has been repeatedly observed in MCI, especially in cingulum fibers (Bozoki et al., 2012; Kiuchi et al., 2009). These white matter abnormalities have been considered relevant, as they have been associated with performance in neuropsychological tests (Fellgiebel et al., 2005) or conversion rate to AD (Fu et al., 2014). We also noted that differences between controls and MCIs in SC were only significant for wSC but not for dSC. This indicates that SC disruption of the DMN in MCI may be mainly attributed to an abnormal structural integrity of tracts rather than to a reduction of the number of streamlines connecting DMN regions. Therefore, fractional anisotropy along reconstructed tracts appears to have a higher sensibility to detect this disruption than the dSC index.
We observed that dSC correlated positively with FC, while no significant correlation was found for wSC and FC. This suggests that the FC measure is more dependent on the amount of tracts connecting two ROIs than on the integrity or FA of these tracts. Other studies had also found positive correlations between SC and fMRI FC in the DMN (Honey et al., 2009; Khalsa et al., 2013), although this is to our knowledge the first study that combines MEG FC and SC in MCI patients. Additionally, we found that the topographic pattern of network disruption in MCI was similar for FC and SC. FC and SC were reduced in MCI patients in the posterior part of the DMN, particularly affecting links connecting IP with Pr or PC. While FC between the anterior cingulate and the posterior part of the DMN was reduced in MCI, no differences could be seen with SC, although this may be attributed to limitations in the tractography technique (Jbabdi and Johansen-Berg, 2011; Jones et al., 2013).
The exact physiological mechanisms that underlie functional and structural disconnections are unknown. However, some bimodal PIB-PET–fMRI studies have provided an insight into the matter: reduced functional connectivity seems to relate to amyloid-β in healthy controls and AD patients (Hedden et al., 2009; Sheline et al., 2010; Sperling et al., 2009). Similar findings have been obtained in transgenic mice with an optical intrinsic signal imaging technique (Bero et al., 2012). The present MEG study provides additional information to this functional disruption seen in MCI: it is strongest in the alpha band. Interestingly, alpha rhythms are especially sensitive to the number of active synapses and firing rate in cortical and thalamic neuronal populations (Bhattacharya et al., 2011; Hindriks and van Putten, 2013), and amyloid-β deposition has been shown to contribute to synaptic loss in AD (Bate and Williams, 2011; Reddy and Beal, 2008). With regard to the structural white matter abnormalities, although they are often attributed to Wallerian degeneration (Bozzali, 2002), some studies point out that amyloid-β deposition could be involved as well (Serra et al., 2010).
It is important to note that this study is subjected to some methodological and experimental limitations. Firstly, quantifying FC from resting state MEG data is not trivial. Here, we used beamforming for source space reconstruction and amplitude correlation as an FC metric. This amplitude correlation algorithm has a clear drawback: it is sensitive to volume conduction. Other methods such as Phase Lag Index (Stam et al., 2007) overcome this problem since they are not affected by zero-phase lag interactions. However, they have the disadvantage of discarding true zero-phase lag interactions. Given that the amplitude correlation method has been proven to be suitable for reproducing fMRI networks (Brookes et al., 2011a), we chose this method to assess FC within the DMN network: the DMN was in fact discovered and mainly explored in the fMRI community. However, taking into account that volume conduction could contaminate this FC metric, we used the weight correlation as an estimate of volume conduction to ensure that differences between groups were not caused by this factor. Secondly, quantifying structural connectivity is also a delicate task: tractography techniques are prone to errors, especially when fibers cross, kiss or bend (Jbabdi and Johansen-Berg, 2011; Jones et al., 2013). Long distance connections tend to be biased due to error accumulation and are therefore difficult to evaluate. Thus, we decided not to include connections with a small amount of reconstructed fibers into the statistical analysis. Thirdly, we employed anatomically defined ROIs to study the DMN. We relied on the literature and selected 8 ROIs that are commonly included in the DMN, and thereby assumed that these ROIs really form the DMN in our sample. However, it would be interesting to explore the spatial extent of the DMN in an MCI sample with MEG at different frequency bands, possibly with an independent component analysis (Brookes et al., 2011b; Luckhoo et al., 2012) or combining resting state with task activity (Petrella et al., 2011; Wang et al., 2013).
5. Conclusions
In conclusion, we studied functional and structural connectivity in the DMN in a sample of MCI patients and healthy controls using resting state MEG and DTI. When compared with the control group, the DMN was functionally disrupted in MCI subjects in the alpha band and also structurally disconnected, as indicated by a reduction in fractional anisotropy in the tracts connecting different DMN regions. The correlations between these two approaches (functional and structural) could indicate that they are dependent and it highlights the importance of white matter integrity in the early stages of the disease. These findings are in agreement with previous fMRI and DTI experiments and indicate that MEG is sensitive to early functional connectivity abnormalities that occur in MCI disease. Thus, cognitive symptoms could be the consequence of an early disruption of structural and functional connections and this would support the idea that a progressive disconnection accompanies AD. Future studies with bigger samples and clinical follow-up would be needed to confirm these results and assess their clinical impact. Additionally, the introduction of classifiers at the individual level would contribute to evaluate the usefulness of structural and functional connectivity in the DMN as a potential biomarker of MCI.
Conflicts of interest
The authors declare that the research was conducted in the absence of any commercial or financial relationships that could be construed as a potential conflict of interest.
Acknowledgments
This work was supported the projects PSI2009-14415-C03-01 and PSI2012-38375-C03-01 from the Spanish Ministry of Science and Economy. Research by P.G. and by L.C. was supported by PICATA predoctoral and postdoctoral contracts of the Moncloa Campus of International Excellence (UCM–UPM), respectively. J.A.P.P was supported by the Spanish Ministry of Education through the National Program FPU (AP2010-1317). S.A. was supported by a predoctoral fellowship from the Basque Government.
Contributor Information
Pilar Garcés, Email: pilar.garces@ctb.upm.es.
José Ángel Pineda-Pardo, Email: joseangel.pineda@ctb.upm.es.
Leonides Canuet, Email: leonides.canuet@ctb.upm.es.
Sara Aurtenetxe, Email: sara.aurtenetxe@ctb.upm.es.
Maria Eugenia López, Email: meugenia.lopez@ctb.upm.es.
Alberto Marcos, Email: amarcosdolado@gmail.com.
Miguel Yus, Email: miguel_yus@yahoo.com.
Marcos Llanero-Luque, Email: mllanero@gmail.com.
Francisco del-Pozo, Email: francisco.delpozo@ctb.upm.es.
Miguel Sancho, Email: msancho@ucm.es.
Fernando Maestú, Email: fernando.maestu@ctb.upm.es.
References
- Agosta F., Pievani M., Geroldi C., Copetti M., Frisoni G.B., Filippi M. Resting state fMRI in Alzheimer's disease: beyond the default mode network. Neurobiology of Aging. 2012;33:1564–1578. doi: 10.1016/j.neurobiolaging.2011.06.007. 21813210 [DOI] [PubMed] [Google Scholar]
- Babiloni C., Frisoni G.B., Vecchio F., Lizio R., Pievani M., Cristina G., Fracassi C., Vernieri F., Rodriguez G., Nobili F., Ferri R., Rossini P.M. Stability of clinical condition in mild cognitive impairment is related to cortical sources of alpha rhythms: an electroencephalographic study. Human Brain Mapping. 2011;32:1916–1931. doi: 10.1002/hbm.21157. 21181798 [DOI] [PMC free article] [PubMed] [Google Scholar]
- Bate C., Williams A. Amyloid-β-induced synapse damage is mediated via cross-linkage of cellular prion proteins. Journal of Biological Chemistry. 2011;286:37955–37963. doi: 10.1074/jbc.M111.248724. 21900234 [DOI] [PMC free article] [PubMed] [Google Scholar]
- Bero A.W., Bauer A.Q., Stewart F.R., White B.R., Cirrito J.R., Raichle M.E., Culver J.P., Holtzman D.M. Bidirectional relationship between functional connectivity and amyloid-β deposition in mouse brain. Journal of Neuroscience: the Official Journal of the Society for Neuroscience. 2012;32:4334–4340. doi: 10.1523/JNEUROSCI.5845-11.2012. 22457485 [DOI] [PMC free article] [PubMed] [Google Scholar]
- Bhattacharya B.S., Coyle D., Maguire L.P. A thalamo-cortico-thalamic neural mass model to study alpha rhythms in Alzheimer's disease. Neural Networks: the Official Journal of the International Neural Network Society. 2011;24:631–645. doi: 10.1016/j.neunet.2011.02.009. 21435838 [DOI] [PubMed] [Google Scholar]
- Binnewijzend M.A., Schoonheim M.M., Sanz-Arigita E., Wink A.M., van der Flier W.M., Tolboom N., Adriaanse S.M., Damoiseaux J.S., Scheltens P., van Berckel B.N.M., Barkhof F. Resting-state fMRI changes in Alzheimer's disease and mild cognitive impairment. Neurobiology of Aging. 2012;33:2018–2028. doi: 10.1016/j.neurobiolaging.2011.07.003. 21862179 [DOI] [PubMed] [Google Scholar]
- Bozoki A.C., Korolev I.O., Davis N.C., Hoisington L.A., Berger K.L. Disruption of limbic white matter pathways in mild cognitive impairment and Alzheimer's disease: a DTI/FDG-PET study. Human Brain Mapping. 2012;33:1792–1802. doi: 10.1002/hbm.21320. 21674695 [DOI] [PMC free article] [PubMed] [Google Scholar]
- Bozzali M. White matter damage in Alzheimer's disease assessed in vivo using diffusion tensor magnetic resonance imaging. Journal of Neurology, Neurosurgery, and Psychiatry. 2002;72:742–746. doi: 10.1136/jnnp.72.6.742. 12023417 [DOI] [PMC free article] [PubMed] [Google Scholar]
- Brier M.R., Thomas J.B., Snyder A.Z., Benzinger T.L., Zhang D., Raichle M.E., Holtzman D.M., Morris J.C., Ances B.M. Loss of intranetwork and internetwork resting state functional connections with Alzheimer's disease progression. Journal of Neuroscience: the Official Journal of the Society for Neuroscience. 2012;32:8890–8899. doi: 10.1523/JNEUROSCI.5698-11.2012. 22745490 [DOI] [PMC free article] [PubMed] [Google Scholar]
- Brookes M.J., Hale J.R., Zumer J.M., Stevenson C.M., Francis S.T., Barnes G.R., Owen J.P., Morris P.G., Nagarajan S.S. Measuring functional connectivity using MEG: methodology and comparison with fcMRI. Neuroimage. 2011;56:1082–1104. doi: 10.1016/j.neuroimage.2011.02.054. 21352925 [DOI] [PMC free article] [PubMed] [Google Scholar]
- Brookes M.J., Woolrich M., Luckhoo H., Price D., Hale J.R., Stephenson M.C., Barnes G.R., Smith S.M., Morris P.G. Investigating the electrophysiological basis of resting state networks using magnetoencephalography. Proceedings of the National Academy of Sciences of the United States of America. 2011;108:16783–16788. doi: 10.1073/pnas.1112685108. 21930901 [DOI] [PMC free article] [PubMed] [Google Scholar]
- Buckner R.L., Andrews-Hanna J.R., Schacter D.L. The brain's default network: anatomy, function, and relevance to disease. Annals of the New York Academy of Sciences. 2008;1124:1–38. doi: 10.1196/annals.1440.011. 18400922 [DOI] [PubMed] [Google Scholar]
- Damoiseaux J.S., Prater K.E., Miller B.L., Greicius M.D. Functional connectivity tracks clinical deterioration in Alzheimer's disease. Neurobiol. Aging. 2012;33:828.e19–828.e30. doi: 10.1016/j.neurobiolaging.2011.06.024. [DOI] [PMC free article] [PubMed] [Google Scholar]
- Desikan R.S., Ségonne F., Fischl B., Quinn B.T., Dickerson B.C., Blacker D., Buckner R.L., Dale A.M., Maguire R.P., Hyman B.T., Albert M.S., Killiany R.J. An automated labeling system for subdividing the human cerebral cortex on MRI scans into gyral based regions of interest. Neuroimage. 2006;31:968–980. doi: 10.1016/j.neuroimage.2006.01.021. 16530430 [DOI] [PubMed] [Google Scholar]
- Fellgiebel A., Müller M.J., Wille P., Dellani P.R., Scheurich A., Schmidt L.G., Stoeter P. Color-coded diffusion-tensor-imaging of posterior cingulate fiber tracts in mild cognitive impairment. Neurobiol. Aging. 2005;26:1193–1198. doi: 10.1016/j.neurobiolaging.2004.11.006. [DOI] [PubMed] [Google Scholar]
- Fu J.-L., Liu Y., Li Y.-M., Chang C., Li W.-B. Use of diffusion tensor imaging for evaluating changes in the microstructural integrity of white matter over 3 years in patients with amnesic-type mild cognitive impairment converting to Alzheimer's disease. Journal of Neuroimaging: Official Journal of the American Society of Neuroimaging. 2014;24:343–348. doi: 10.1111/jon.12061. 24251793 [DOI] [PubMed] [Google Scholar]
- Garcés P., Vicente R., Wibral M., Pineda-Pardo J.Á., López M.E., Aurtenetxe S., Marcos A., de Andrés M.E., Yus M., Sancho M., Maestú F., Fernández A. Brain-wide slowing of spontaneous alpha rhythms in mild cognitive impairment. Frontiers in Aging Neuroscience. 2013;5:100. doi: 10.3389/fnagi.2013.00100. 24409145 [DOI] [PMC free article] [PubMed] [Google Scholar]
- Greicius M.D., Krasnow B., Reiss A.L., Menon V. Functional connectivity in the resting brain: a network analysis of the default mode hypothesis. Proceedings of the National Academy of Sciences of the United States of America. 2003;100:253–258. doi: 10.1073/pnas.0135058100. 12506194 [DOI] [PMC free article] [PubMed] [Google Scholar]
- Greicius M.D., Srivastava G., Reiss A.L., Menon V. Default-mode network activity distinguishes Alzheimer's disease from healthy aging: evidence from functional MRI. Proceedings of the National Academy of Sciences of the United States of America. 2004;101:4637–4642. doi: 10.1073/pnas.0308627101. 15070770 [DOI] [PMC free article] [PubMed] [Google Scholar]
- Grundman M., Petersen R.C., Ferris S.H., Thomas R.G., Aisen P.S., Bennett D.A., Foster N.L., Jack C.R., Galasko D.R., Doody R., Kaye J., Sano M., Mohs R., Gauthier S., Kim H.T., Jin S., Schultz A.N., Schafer K., Mulnard R., van Dyck C.H., Mintzer J., Zamrini E.Y., Cahn-Weiner D., Thal L.J. Mild cognitive impairment can be distinguished from Alzheimer disease and normal aging for clinical trials. Archives of Neurology. 2004;61:59–66. doi: 10.1001/archneur.61.1.59. 14732621 [DOI] [PubMed] [Google Scholar]
- Hagmann P., Cammoun L., Gigandet X., Meuli R., Honey C.J., Wedeen V.J., Sporns O. Mapping the structural core of human cerebral cortex. PLoS Biology. 2008;6:e159. doi: 10.1371/journal.pbio.0060159. 18597554 [DOI] [PMC free article] [PubMed] [Google Scholar]
- Hedden T., Van Dijk K.R.A., Becker J.A., Mehta A., Sperling R.A., Johnson K.A., Buckner R.L. Disruption of functional connectivity in clinically normal older adults harboring amyloid burden. Journal of Neuroscience: the Official Journal of the Society for Neuroscience. 2009;29:12686–12694. doi: 10.1523/JNEUROSCI.3189-09.2009. 19812343 [DOI] [PMC free article] [PubMed] [Google Scholar]
- Hindriks R., van Putten M.J.A.M. Thalamo-cortical mechanisms underlying changes in amplitude and frequency of human alpha oscillations. Neuroimage. 2013;70:150–163. doi: 10.1016/j.neuroimage.2012.12.018. 23266701 [DOI] [PubMed] [Google Scholar]
- Honey C.J., Sporns O., Cammoun L., Gigandet X., Thiran J.P., Meuli R., Hagmann P. Predicting human resting-state functional connectivity from structural connectivity. Proceedings of the National Academy of Sciences of the United States of America. 2009;106:2035–2040. doi: 10.1073/pnas.0811168106. 19188601 [DOI] [PMC free article] [PubMed] [Google Scholar]
- Jbabdi S., Johansen-Berg H. Tractography: where do we go from here? Brain Connectivity. 2011;1:169–183. doi: 10.1089/brain.2011.0033. 22433046 [DOI] [PMC free article] [PubMed] [Google Scholar]
- Johansen-Berg H., Behrens T.E.J., Robson M.D., Drobnjak I., Rushworth M.F.S., Brady J.M., Smith S.M., Higham D.J., Matthews P.M. Changes in connectivity profiles define functionally distinct regions in human medial frontal cortex. Proceedings of the National Academy of Sciences of the United States of America. 2004;101:13335–13340. doi: 10.1073/pnas.0403743101. 15340158 [DOI] [PMC free article] [PubMed] [Google Scholar]
- Jones D.K., Knösche T.R., Turner R. White matter integrity, fiber count, and other fallacies: the do's and don'ts of diffusion MRI. Neuroimage. 2013;73:239–254. doi: 10.1016/j.neuroimage.2012.06.081. 22846632 [DOI] [PubMed] [Google Scholar]
- Jones D.T., Machulda M.M., Vemuri P., McDade E.M., Zeng G., Senjem M.L., Gunter J.L., Przybelski S.A., Avula R.T., Knopman D.S., Boeve B.F., Petersen R.C., Jack C.R. Age-related changes in the default mode network are more advanced in Alzheimer disease. Neurology. 2011;77:1524–1531. doi: 10.1212/WNL.0b013e318233b33d. 21975202 [DOI] [PMC free article] [PubMed] [Google Scholar]
- Khalsa S., Mayhew S.D., Chechlacz M., Bagary M., Bagshaw A.P. The structural and functional connectivity of the posterior cingulate cortex: comparison between deterministic and probabilistic tractography for the investigation of structure–function relationships. Neuroimage. 2013 doi: 10.1016/j.neuroimage.2013.12.022. 24365673 [DOI] [PubMed] [Google Scholar]
- Kiuchi K., Morikawa M., Taoka T., Nagashima T., Yamauchi T., Makinodan M., Norimoto K., Hashimoto K., Kosaka J., Inoue Y., Inoue M., Kichikawa K., Kishimoto T. Abnormalities of the uncinate fasciculus and posterior cingulate fasciculus in mild cognitive impairment and early Alzheimer's disease: a diffusion tensor tractography study. Brain Research. 2009;1287:184–191. doi: 10.1016/j.brainres.2009.06.052. 19559010 [DOI] [PubMed] [Google Scholar]
- Knyazev G.G., Slobodskoj-Plusnin J.Y., Bocharov A.V., Pylkova L.V. The default mode network and EEG α oscillations: an independent component analysis. Brain Research. 2011;1402:67–79. doi: 10.1016/j.brainres.2011.05.052. 21683942 [DOI] [PubMed] [Google Scholar]
- Lazar M., Weinstein D.M., Tsuruda J.S., Hasan K.M., Arfanakis K., Meyerand M.E., Badie B., Rowley H.A., Haughton V., Field A., Alexander A.L. White matter tractography using diffusion tensor deflection. Human Brain Mapping. 2003;18:306–321. doi: 10.1002/hbm.10102. 12632468 [DOI] [PMC free article] [PubMed] [Google Scholar]
- Luckhoo H., Hale J.R., Stokes M.G., Nobre A.C., Morris P.G., Brookes M.J., Woolrich M.W. Inferring task-related networks using independent component analysis in magnetoencephalography. Neuroimage. 2012;62:530–541. doi: 10.1016/j.neuroimage.2012.04.046. 22569064 [DOI] [PMC free article] [PubMed] [Google Scholar]
- Maris E., Oostenveld R. Nonparametric statistical testing of EEG- and MEG-data. Journal of Neuroscience Methods. 2007;164:177–190. doi: 10.1016/j.jneumeth.2007.03.024. 17517438 [DOI] [PubMed] [Google Scholar]
- Matsuda H. Cerebral blood flow and metabolic abnormalities in Alzheimer's disease. Annals of Nuclear Medicine. 2001;15:85–92. doi: 10.1007/BF02988596. 11448080 [DOI] [PubMed] [Google Scholar]
- Mayhew S.D., Ostwald D., Porcaro C., Bagshaw A.P. Spontaneous EEG alpha oscillation interacts with positive and negative BOLD responses in the visual-auditory cortices and default-mode network. Neuroimage. 2013;76:362–372. doi: 10.1016/j.neuroimage.2013.02.070. 23507378 [DOI] [PubMed] [Google Scholar]
- Mintun M.A., Larossa G.N., Sheline Y.I., Dence C.S., Lee S.Y., Mach R.H., Klunk W.E., Mathis C.A., DeKosky S.T., Morris J.C. [11C]PIB in a nondemented population: potential antecedent marker of Alzheimer disease. Neurology. 2006;67:446–452. doi: 10.1212/01.wnl.0000228230.26044.a4. 16894106 [DOI] [PubMed] [Google Scholar]
- Moretti D.V., Pievani M., Fracassi C., Binetti G., Rosini S., Geroldi C., Zanetti O., Rossini P.M., Frisoni G.B. Increase of theta/gamma and alpha3/alpha2 ratio is associated with amygdalo–hippocampal complex atrophy. Journal of Alzheimer’s Disease: JAD. 2009;17:349–357. doi: 10.3233/JAD-2009-1059. 19363263 [DOI] [PubMed] [Google Scholar]
- Nolte G. The magnetic lead field theorem in the quasi-static approximation and its use for magnetoencephalography forward calculation in realistic volume conductors. Physics in Medicine and Biology. 2003;48:3637–3652. doi: 10.1088/0031-9155/48/22/002. 14680264 [DOI] [PubMed] [Google Scholar]
- Oostenveld R., Fries P., Maris E., Schoffelen J.-M. FieldTrip: open source software for advanced analysis of MEG, EEG, and invasive electrophysiological data. Computational Intelligence and Neuroscience. 2011;2011:156869. doi: 10.1155/2011/156869. 21253357 [DOI] [PMC free article] [PubMed] [Google Scholar]
- Petersen R.C. Current concepts in mild cognitive impairment. Archives of Neurology. 2001;58:1985–1992. doi: 10.1001/archneur.58.12.1985. 11735772 [DOI] [PubMed] [Google Scholar]
- Petersen R.C., Negash S. Mild cognitive impairment: an overview. CNS Spectrums. 2008;13:45–53. doi: 10.1017/s1092852900016151. 18204414 [DOI] [PubMed] [Google Scholar]
- Petrella J.R., Sheldon F.C., Prince S.E., Calhoun V.D., Doraiswamy P.M. Default mode network connectivity in stable vs progressive mild cognitive impairment. Neurology. 2011;76:511–517. doi: 10.1212/WNL.0b013e31820af94e. 21228297 [DOI] [PMC free article] [PubMed] [Google Scholar]
- Qi Z., Wu X., Wang Z., Zhang N., Dong H., Yao L., Li K. Impairment and compensation coexist in amnestic MCI default mode network. Neuroimage. 2010;50:48–55. doi: 10.1016/j.neuroimage.2009.12.025. 20006713 [DOI] [PubMed] [Google Scholar]
- Raichle M.E., MacLeod A.M., Snyder A.Z., Powers W.J., Gusnard D.A., Shulman G.L. A default mode of brain function. Proceedings of the National Academy of Sciences of the United States of America. 2001;98:676–682. doi: 10.1073/pnas.98.2.676. 11209064 [DOI] [PMC free article] [PubMed] [Google Scholar]
- Raichle M.E., Snyder A.Z. A default mode of brain function: a brief history of an evolving idea. Neuroimage. 2007;37:1083–1090. doi: 10.1016/j.neuroimage.2007.02.041. [DOI] [PubMed] [Google Scholar]
- Reddy P.H., Beal M.F. Amyloid beta, mitochondrial dysfunction and synaptic damage: implications for cognitive decline in aging and Alzheimer's disease. Trends in Molecular Medicine. 2008;14:45–53. doi: 10.1016/j.molmed.2007.12.002. 18218341 [DOI] [PMC free article] [PubMed] [Google Scholar]
- Rombouts S.A.R.B., Barkhof F., Goekoop R., Stam C.J., Scheltens P. Altered resting state networks in mild cognitive impairment and mild Alzheimer's disease: an fMRI study. Human Brain Mapping. 2005;26:231–239. doi: 10.1002/hbm.20160. 15954139 [DOI] [PMC free article] [PubMed] [Google Scholar]
- Rosazza C., Minati L. Resting-state brain networks: literature review and clinical applications. Neurological Sciences: Official Journal of the Italian Neurological Society and of the Italian Society of Clinical Neurophysiology. 2011;32:773–785. doi: 10.1007/s10072-011-0636-y. 21667095 [DOI] [PubMed] [Google Scholar]
- Rosen W.G., Terry R.D., Fuld P.A., Katzman R., Peck A. Pathological verification of ischemic score in differentiation of dementias. Annals of Neurology. 1980;7:486–488. doi: 10.1002/ana.410070516. 7396427 [DOI] [PubMed] [Google Scholar]
- Sambataro F., Murty V.P., Callicott J.H., Tan H.-Y., Das S., Weinberger D.R., Mattay V.S. Age-related alterations in default mode network: impact on working memory performance. Neurobiol. Aging. 2010;31:839–852. doi: 10.1016/j.neurobiolaging.2008.05.022. [DOI] [PMC free article] [PubMed] [Google Scholar]
- Serra L., Cercignani M., Lenzi D., Perri R., Fadda L., Caltagirone C., Macaluso E., Bozzali M. Grey and white matter changes at different stages of Alzheimer's disease. Journal of Alzheimer’s Disease: JAD. 2010;19:147–159. doi: 10.3233/JAD-2010-1223. 20061634 [DOI] [PubMed] [Google Scholar]
- Sheline Y.I., Raichle M.E., Snyder A.Z., Morris J.C., Head D., Wang S., Mintun M.A. Amyloid plaques disrupt resting state default mode network connectivity in cognitively normal elderly. Biological Psychiatry. 2010;67:584–587. doi: 10.1016/j.biopsych.2009.08.024. 19833321 [DOI] [PMC free article] [PubMed] [Google Scholar]
- Smith S.M. Fast robust automated brain extraction. Human Brain Mapping. 2002;17:143–155. doi: 10.1002/hbm.10062. 12391568 [DOI] [PMC free article] [PubMed] [Google Scholar]
- Sorg C., Riedl V., Mühlau M., Calhoun V.D., Eichele T., Läer L., Drzezga A., Förstl H., Kurz A., Zimmer C., Wohlschläger A.M. Selective changes of resting-state networks in individuals at risk for Alzheimer's disease. Proceedings of the National Academy of Sciences of the United States of America. 2007;104:18760–18765. doi: 10.1073/pnas.0708803104. 18003904 [DOI] [PMC free article] [PubMed] [Google Scholar]
- Sperling R.A., Laviolette P.S., O’Keefe K., O'Brien J., Rentz D.M., Pihlajamaki M., Marshall G., Hyman B.T., Selkoe D.J., Hedden T., Buckner R.L., Becker J.A., Johnson K.A. Amyloid deposition is associated with impaired default network function in older persons without dementia. Neuron. 2009;63:178–188. doi: 10.1016/j.neuron.2009.07.003. 19640477 [DOI] [PMC free article] [PubMed] [Google Scholar]
- Stam C.J., Nolte G., Daffertshofer A. Phase lag index: Assessment of functional connectivity from multi channel EEG and MEG with diminished bias from common sources. Human Brain Mapping. 2007;28:1178–1193. doi: 10.1002/hbm.20346. 17266107 [DOI] [PMC free article] [PubMed] [Google Scholar]
- Taulu S., Simola J. Spatiotemporal signal space separation method for rejecting nearby interference in MEG measurements. Physics in Medicine and Biology. 2006;51:1759–1768. doi: 10.1088/0031-9155/51/7/008. 16552102 [DOI] [PubMed] [Google Scholar]
- Van Veen B.D., van Drongelen W., Yuchtman M., Suzuki A. Localization of brain electrical activity via linearly constrained minimum variance spatial filtering. IEEE Transactions on Bio-Medical Engineering. 1997;44:867–880. doi: 10.1109/10.623056. 9282479 [DOI] [PubMed] [Google Scholar]
- Wang L., Li H., Liang Y., Zhang J., Li X., Shu N., Wang Y.Y., Zhang Z. Amnestic mild cognitive impairment: topological reorganization of the default-mode network. Radiology. 2013;268:501–514. doi: 10.1148/radiol.13121573. 23481166 [DOI] [PubMed] [Google Scholar]
- Wee C.-Y., Yap P.-T., Zhang D., Denny K., Browndyke J.N., Potter G.G., Welsh-Bohmer K.A., Wang L., Shen D. Identification of MCI individuals using structural and functional connectivity networks. Neuroimage. 2012;59:2045–2056. doi: 10.1016/j.neuroimage.2011.10.015. 22019883 [DOI] [PMC free article] [PubMed] [Google Scholar]
- Yesavage J.A., Brink T.L., Rose T.L., Lum O., Huang V., Adey M., Leirer V.O. Development and validation of a geriatric depression screening scale: a preliminary report. Journal of Psychiatric Research. 1982–1983;17:37–49. doi: 10.1016/0022-3956(82)90033-4. 7183759 [DOI] [PubMed] [Google Scholar]