

Abstract
Background
In Friedreich's ataxia (FA) the genetically decreased expression of the mitochondrial protein frataxin leads to disturbance of the mitochondrial iron metabolism. Within the cerebellum the dentate nuclei (DN) are primarily affected. Histopathological studies show atrophy and accumulation of mitochondrial iron in DN. Dentate iron content has been suggested as a biomarker to measure the effects of siderophores/antioxidant treatment of FA. We assessed the iron content and the volume of DN in FA patients and controls based on ultra-high-field MRI (7 Tesla) images.
Methods
Fourteen FA patients (mean age 38.1 yrs) and 14 age- and gender-matched controls participated. Multi-echo gradient echo and susceptibility weighted imaging (SWI) sequences were acquired on a 7 T whole-body scanner. For comparison SWI images were acquired on a 1.5 T MR scanner. Volumes of the DN and cerebellum were assessed at 7 and 1.5 T, respectively. Parametric maps of T2 and T2* sequences were created and proton transverse relaxation rates were estimated as a measure of iron content.
Results
In FA, the DN and the cerebellum were significantly smaller compared to controls. However, proton transverse relaxation rates of the DN were not significantly different between both groups.
Conclusions
Applying in vivo MRI methods we could demonstrate significant atrophy of the DN in the presence of normal iron content. The findings suggest that relaxation rates are not reliable biomarkers in clinical trials evaluating the potential effect of FA therapy.
Keywords: Friedreich's ataxia, Dentate nuclei, Dentate iron content, Relaxometry, Volumetry, Ultra-high-field MRI
1. Introduction
Friedreich's ataxia (FA) is the most common genetic ataxia that affects up to one out of 36,000 people (Epplen et al., 1997; Schöls et al., 1997). The disease usually begins before the age of 25 years (Harding criteria; Harding, 1993) although older onset is observed [Late-Onset FA (LOFA), De Michele et al., 1994]. Symptoms are variable and include ataxia, neuropathy, dysarthria, hypertrophic cardiomyopathy, skeleton deformities, and diabetes mellitus (Harding, 1993; Pandolfo, 2003). Available treatments cannot delay the progression.
The causative mutation was found in 1996 (Campuzano et al., 1996). A GAA nucleotide repeat expansion in the first intron of chromosome 9q13 gene leads to decreased expression of the mitochondrial protein frataxin (Pandolfo, 2003). This protein is widely held to play an essential role in the mitochondrial iron metabolism. Lack of frataxin causes perturbation of iron–sulfur cluster (ISC) biosynthesis and iron transport and storage (Rötig et al., 1997; Gakh et al., 2006; Cavadini et al., 2002; Koeppen, 2011). Studies in mutation-carrying mice, yeast and humans found mitochondrial dysfunction in cardiac cells, fibroblasts (Delatycki et al., 1999) and the cerebellar dentate nucleus (DN) supposedly due to oxidative stress and accumulation of iron in mitochondria. Therefore, siderophores/antioxidant molecules are of interest concerning therapeutic treatment. Measuring the iron content of the DN is discussed as a possible method to monitor the effect of these treatments. Studies in small patient populations using magnetic resonance imaging (MRI; Waldvogel et al., 1999; Boddaert et al., 2007; Velasco-Sanchez et al., 2011; Bonilha da Silva et al., 2014) or transcranial sonography (Synofzik et al., 2011) suggest increased iron content in the DN in FA patients and a decrease during treatment with deferiprone (Boddaert et al., 2007; Velasco-Sanchez et al., 2011). However, in immunohistochemistry and immunofluorescence studies the absolute amount of iron did not differ between patients and controls (Koeppen et al., 2012).
Until the 20th century, FA was classified as a disorder of the spinal cord, and only in 1957 was the considerable involvement of the DN and, to a lesser extent, of the cerebellum appreciated (Urich et al., 1957; Wüllner et al., 1993; Huang et al., 1993; Ormerod et al., 1994). In histopathological studies the DN is severely atrophic with neuronal loss of large neurons and proliferation of synaptic terminals (Koeppen and Mazurkiewicz, 2013). Atrophy of the cerebellum appears late and is commonly minor.
The aim of our study was to investigate the volume and iron content of the DN in FA compared to controls using ultra-high-field [UHF; 7 Tesla (T)] MRI. UHF MRI3 is supposed to have an improved sensitivity for evaluating the iron content using relaxometry. The results were compared to data obtained with a 1.5 T field. We hypothesized that UHF MRI allowed for more sensitive assessment of increased iron content than conventional 1.5 T field strength.
2. Materials and methods
2.1. Subjects
Fourteen participants with genetically proven FA (8 female, 6 male; mean age 38.1 ± 8.5 yrs, range 24 to 52 yrs, Table 1) and 14 age and gender-matched controls without any known neurological diseases or neurological deficits (7 female, 7 male; mean age 38.1 ± 7.7 yrs, range 24 to 51 yrs) participated in the study. Duration from symptom onset until examination was 17.6 ± 7.2 years, range 6 to 27 years. Six out of 14 subjects had LOFA (onset > 24 yrs). Twelve out of 14 subjects were treated with idebenone. All but one patient (Participant 9 in Table 1) and one control were right handed. The severity of neurological symptoms was assessed with two neurological scales: Friedreich Ataxia Rating Scale [FARS, Subramony et al., 2005]; Scale of the Assessment and Rating of Ataxia [SARA, Schmitz-Hübsch et al., 2006]. Patients who are more severely affected reach higher scores. In the patient group the mean FARS score was 70.1 ± 25.3 (range 25–116, max. score 159) and the mean SARA score was 22.1 ± 7.1 (range 7–32, max. score 40). For individual scores see Table 1. Scores were highly correlated (p < 0.001, Pearson's R > 0.882).
Table 1.
Patient characteristics. FARS = Friedreich Ataxia Rating Scale; SARA = Scale of the Assessment and Rating of Ataxia.
| Number | Gender | Age (yrs) | Age at onset (yrs) | Duration (yrs) | Handedness | Medication | FARS | SARA |
|---|---|---|---|---|---|---|---|---|
| 1 | Male | 52 | 25 | 27 | Right | Idebenone | 34 | 11 |
| 2 | Female | 24 | 15 | 9 | Right | Idebenone | 54 | 14 |
| 3 | Female | 40 | 29 | 11 | Right | Idebenone | 33 | 15 |
| 4 | Male | 35 | 16 | 19 | Right | Idebenone | 94 | 26 |
| 5 | Female | 27 | 15 | 12 | Right | Idebenone | 92 | 29 |
| 6 | Female | 32 | 12 | 20 | Right | Idebenone | 84 | 27 |
| 7 | Female | 29 | 11 | 18 | Right | none | 108 | 32 |
| 8 | Female | 43 | 17 | 26 | Right | none | 82 | 28 |
| 9 | Male | 46 | 25 | 21 | Left | Idebenone | 60 | 17 |
| 10 | Male | 40 | 16 | 24 | Right | Idebenone | 118 | 31 |
| 11 | Female | 46 | 33 | 13 | Right | Idebenone | 65 | 21 |
| 12 | Male | 51 | 30 | 21 | Right | Idebenone | 56 | 20 |
| 13 | Female | 35 | 16 | 19 | Right | Idebenone | 84 | 32 |
| 14 | Male | 33 | 27 | 6 | Right | Idebenone | 44 | 15 |
All subjects gave informed consent. The study was approved by the ethics committee of the Medical Faculty of the University of Essen-Duisburg. The experiments were conducted in accordance with the Declaration of Helsinki.
2.2. MRI measurements
All participants were examined on a Magnetom 7 T whole-body MR system (Siemens Healthcare, Erlangen, Germany) equipped with a gradient coil of comparable performance as used at 1.5 T. An eight-channel head coil (Rapid Biomedical, Wurzburg, Germany) was used for signal transmission and reception. For comparison, a second examination was performed with an Avanto 1.5 T whole-body scanner (Siemens Healthcare, Erlangen, Germany) using a standard 12-channel receive-only head coil provided by the vendor. The time interval between both imaging procedures was less than 4 months.
In the 7 T scanner, a multi-echo gradient echo sequence was used for T2* mapping with TR = 800 ms, bandwidth = 570 Hz/pixel, and a bipolar readout mode to enable short TE. 19 slices were measured within 5:09 min. A total of 12 echoes were read out between 4.08 and 38.76 ms, each being separated by 3.06 ms. For T2 mapping utilizing a turbo spin echo sequence, due to strong specific absorption rate limitations only one slice could be measured within 11:18 min. Here, six echoes were read out at TE = 7.7, 15.4, 23.1, 30.8, 38.5, and 46.2 ms. For all mapping sequences the field-of-view (192 × 192 mm), matrix (384 × 384) and slice thickness (2 mm) were kept the same, resulting in a high spatial resolution of 0.5 × 0.5 × 2 mm3 voxel size. Finally, a T2*-weighted SWI sequence with a high resolution of 0.5 mm isotropic was performed (TR/TE = 35/16.9 ms, FOV 224 × 182 mm2, flip angle 19°, BW 160 Hz/pixel, 144 slices, matrix 448 × 364, slice thickness 0.5 mm, Grappa R = 2 and TA 16:14 min).
At 1.5 T, a multi-echo gradient echo sequence was used for T2* mapping with T = 800 ms, bandwidth = 570 Hz/pixel, and a bipolar readout mode to enable minimum TE. T2 mapping was based on a multi-echo spin echo sequence with a TR of 4 s, 180° flip angle, and a bandwidth of 482 Hz/pixel. For both mapping sequences the spatial resolution had to be reduced to 0.75 × 0.75 × 3 mm3 with acquisition times of 3:24 min and 9:02 min, respectively. In addition, a 3D sagittal volume of the entire brain was acquired with a T1-weighted magnetization prepared rapid acquisition gradient echo sequence (MPRAGE; TR = 2400 ms, TE = 3.5 ms, TI = 1200 ms, FOV = 256 mm, 160 slices, voxel size 1.0 × 1.0 × 1.0 mm3, TA = 10:15 min).
2.2.1. Volumetry
The volume of DN was calculated based on 7 T SWI images. Due to magnetic susceptibility effects caused by high iron content, they are best visible in the raw magnitude and high-pass-filtered phase images. DN were marked manually as regions of interest (ROIs) using MRICro software (http://www.mricro.com, Rorden, 2007) on the phase images by two independent examiners (KS, BB). They were identified based on their anatomical localization and by comparison with a 3D histological atlas (Schmahmann, 1999). The methodology has been reported previously in detail (Diedrichsen et al., 2011). Iron-rich areas appear too large in phase images (Haacke et al., 1995) because they have the disadvantage of a “blooming effect”. Note that the apparent volume of the DN is therefore overestimated compared to true histological measures. Data show relative differences in DN volume between patients and controls, but do not reflect true volume.
The volume of the cerebellum was calculated based on 1.5 T MPRAGE images by BB, an experienced lab technician. Interrater reliability has previously been shown to be high (seeDimitrova et al., 2008). Volumetric analysis of MPRAGE images was performed semi-automatically with the help of ECCET software (http://www.eccet.de) developed for visualization and segmentation of MRI and computed tomography data. Details of this methodology have been reported previously (Rabe et al., 2009; Weier et al., 2012). In brief, the cerebellum was semi-automatically outlined and separated from the brain stem. We expressed DN and cerebellar volumes as the fraction of total intracranial volume (TICV) to estimate atrophy independent of head size.
2.2.2. Relaxometry
Proton transverse relaxation rates (RR) are influenced by inhomogeneities in the local magnetic field resulting from the paramagnetic effect of iron. Cerebral structures that contain considerable iron present elevated RR. The field inhomogeneity is expected to increase in high magnetic fields and lead to an increase in RR for 7 T maps in comparison to 1.5 T maps. Syngo MapIt (Siemens Healthcare, Erlangen, Germany) was used to automatically create parametric maps of T2 and T2* sequences. ROIs were manually drawn on anatomical axial T2* and T2 images. We chose a ROI of 20–40 pixels to provide comparable size between participants and regions. The following ROIs were chosen: left and right DN, cerebellar white matter (Cer), globus pallidus (GP) and the splenium of the corpus callosum (CCS). Great care was taken, to assess only voxels belonging to DN but not white matter. Because in the 7 T scanner merely one slice of the T2 sequence could be acquired, we drew ROIs only in the DN and cerebellar white matter. For all ROIs mean T2 and T2* were assessed. The relaxation rates R2, R2*, and R2′ were computed with the following formulas: R2 = 1 / T2, R2* = 1 / T2*, R2′ = R2* − R2. R2′ is suggested to have higher iron specificity than R2 and R2* (Gelman et al., 1999; Schenck and Zimmerman, 2004).
2.3. Statistics
Statistical analysis of the data was performed using SPSS 20.0.0. To compare the iron content in the DN and the volume of nuclei and cerebellum between groups (patients and controls), unpaired t-tests were used. Repeated-measures ANOVA were calculated for the obtained parameters to compare iron contents between gray and white matter. Within-subject factors were gray (DN, GP) and white (Cer, CCS) matter at 1.5 and 7 T, the between-subject factor was group (patients, controls). The Pearson correlation coefficient was used to assess bivariate correlations. Level of significance was set to p < 0.05. Bonferroni correction for multiple comparisons was applied if required. Cronbach's Alpha was assessed to control interrater reliability.
3. Results
3.1. Volumetry
3.1.1. Volumetry of the DN
Two examiners independently assessed the volume of the DN. We achieved a high interrater reliability (Cronbach's Alpha = 0.985), although nuclei could not be measured in 4 patients, because their visibility was too low for correct assessment. Volume of the DN (expressed as fraction of TICV) was significantly smaller in patients compared to controls (Fig. 1, FA: 0.0026 ± 0.0005, controls: 0.004 ± 0.0004, t-test, t(19) = 7.042, p < 0.001).
Fig. 1.
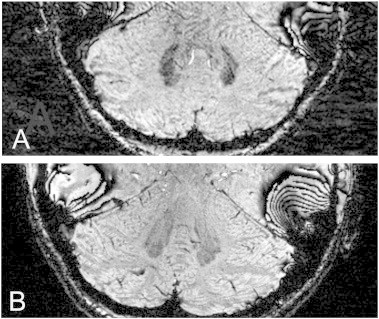
A. DN of a patient (number 8 in Table 1) and B. a control (different window levels). In the FA-patient the nucleus is smaller and the gray matter ribbon is less distinct than in the normal dentate nucleus.
3.1.2. Volumetry of the cerebellum
The volume of the cerebellum (expressed as fraction of TICV) was assessed and compared between groups. In patients, we found a significantly smaller cerebellum compared to controls (FA: 0.088 ± 0.009, controls: 0.097 ± 0.007, t-test, t(22) = 3.14, p = 0.005). Volume of the cerebrum (in relation to TICV) was not significantly different compared to controls (t-test, t(24) = 0.5, p = 0.616).
3.1.3. Correlation between the DN and cerebellum
TICV corrected volume of the cerebellum and the DN correlated in patients (R = 0.479), although this did not reach significance (p = 0.162). Correlation reached significance when taking into account patients and controls (R = 0.465, p = 0.019, Fig. 2).
Fig. 2.
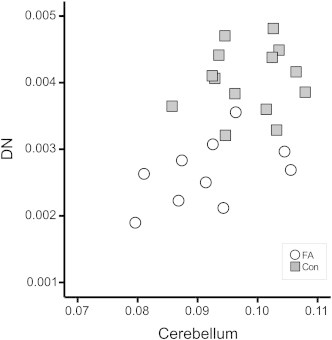
The volume of DN and the cerebellum in relation to total intracranial volume (TICV) was correlated in patients and controls. Con = controls.
3.2. Relaxometry
3.2.1. Group differences between patients and controls
Iron content of the DN was assessed by calculating RR (R2*, R2, R2′) of the left and right DN. Patients did not show increased RR compared to controls at 7 T (Fig. 3A) or 1.5 T (Fig. 3B). Instead, R2* and R2′ at 7 T were smaller in patients compared to controls (t-test; R2*, t(20) = 2.3, p = 0.03; R2′, t(22) = 2.4, p = 0.03). Significance was lost after correction for multiple comparisons. In the following, we report only R2′ as this parameter is most reliable and dependent on R2* and R2.
Fig. 3.
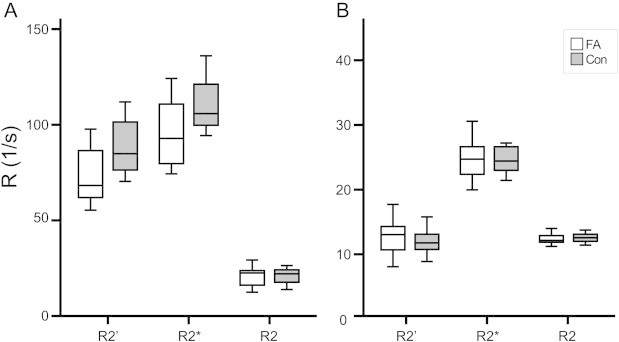
Relaxometry parameters between patients and controls did not show significant differences for either 7 T (A) or 1.5 T (B). Values were higher at 7 T than at 1.5 T. Con = controls.
3.2.2. Age dependency of relaxation rates in the DN
RR increased with higher age in controls (Fig. 4; 7 T: R2′, R = 0.611, p = 0.020). It could not be reproduced at 1.5 T. Values in patients did not show age dependency (7 T: R2′, R = –0.277, p = 0.383).
Fig. 4.
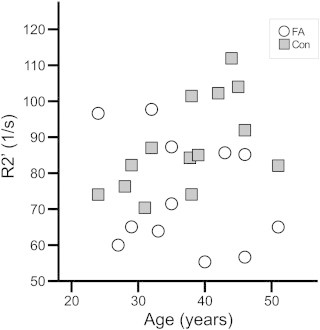
In controls, relaxometry parameters increased with age, although differences did not reach statistical significance.
3.2.3. Validity of the method
3.2.3.1. Comparison of values at 7 and 1.5 T
RR at 7 T and at 1.5 T in all evaluated structures were highly correlated (Suppl. mat. Fig. 1; R2′, R = 0.719, p < 0.001). RR at 7 T were higher than at 1.5 T [t-test, t(201) = 16.4, p < 0.001]. The ratio between values at 7 and 1.5 T was even higher in gray matter (DN, GP) than in white matter (Cer, CCS) and highest for R2′ (Suppl. mat. Fig. 2). The Bland–Altman plot (Bland and Altman, 1986) shows a proportional error (Suppl. mat. Fig. 3).
RR at 7 T and at 1.5 T in all evaluated structures were highly correlated (Suppl. mat. Fig. 1; R2′, R = 0.719, p < 0.001). RR at 7 T were higher than at 1.5 T [t-test, t(201) = 16.4, p < 0.001]. The ratio between values at 7 and 1.5 T was even higher in gray matter (DN, GP) than in white matter (Cer, CCS) and highest for R2′ (Suppl. mat. Fig. 2). The Bland–Altman plot (Bland and Altman, 1986) shows a proportional error (Suppl. mat. Fig. 3).
3.2.3.2. Comparison of relaxation rates between gray and white matter
RR are influenced by inhomogeneity in the local magnetic field resulting from the paramagnetic effect of iron. Therefore, we found significantly higher R2* values in gray matter (DN, GP) than in white matter (Cer, CCS) at 7 and 1.5 T (Suppl. mat. Fig. 1; ANOVA; group effect, F(1) = 579.8 (7 T) and 226.7 (1.5 T), p < 0.001). Due to methodical limitations at 7 T, R2 and therefore R2′ values could be assessed only in the DN and cerebellar white matter. A t-test revealed significantly higher values in DN than in the white matter (p < 0.001).
RR are influenced by inhomogeneity in the local magnetic field resulting from the paramagnetic effect of iron. Therefore, we found significantly higher R2* values in gray matter (DN, GP) than in white matter (Cer, CCS) at 7 and 1.5 T (Suppl. mat. Fig. 1; ANOVA; group effect, F(1) = 579.8 (7 T) and 226.7 (1.5 T), p < 0.001). Due to methodical limitations at 7 T, R2 and therefore R2′ values could be assessed only in the DN and cerebellar white matter. A t-test revealed significantly higher values in DN than in the white matter (p < 0.001).
3.3. Correlation to clinical rating scores
We did not find a significant correlation between DN volume and any of the clinical rating scores (FARS, SARA; p ≥ 0.676, R ≤ –0.152) or duration of symptoms (p = 0.206, R = 0.438). Neither, there was a correlation between cerebellar volume and clinical rating scores (p ≥ 0.164, R ≤ –0.410), duration of disease (p = 0.775, R = –0.088) and age (p = 0.634, R = –0.146), or, finally, between RR of the DN and clinical rating scores (FARS, SARA; p ≥ 0.075, R ≤ 0.490) or duration of symptoms (p ≥ 0.067, R ≤ 0.502).
4. Discussion
To our knowledge, this is the first study showing atrophy of DN in patients with FA using conventional volumetry based on UHF MR images. Beyond that, we confirmed histochemical findings, that the total iron levels in the DN are not increased (Koeppen et al., 2007, 2012) applying relaxometry at two field strengths (1.5 and 7 T). Our results are in contrast to earlier MR studies using relaxometry (Waldvogel et al., 1999; Boddaert et al., 2007; Bonilha da Silva et al., 2014).
4.1. Atrophy of the dentate nuclei and the cerebellum
In FA, the DN is the most prominently affected structure of the cerebellum (Koeppen et al., 2012). Histopathological studies demonstrate severe atrophy due to selective atrophy of large neurons (Koeppen et al., 2012; Pandolfo, 2009; Alper and Narayanan, 2003). Up to now, imaging studies did not provide sufficient precision to assess the cerebellar nuclei. The Italian group around Mascalchi described reduction of the white and gray matter in the peridentate region using DTI and VBM (Pagani et al., 2010; Della Nave et al., 2008a,b). However, due to limitations of the methodology, they failed to demonstrate atrophy of the DN. Using a sequence suitable to demonstrate structures containing iron (SWI) and taking advantage of the improved resolution in UHF MRI, we could document in vivo statistically significant atrophy of DN in FA. Only recently has the development of MRI technologies allowed the visualization of the deep cerebellar nuclei, as has been demonstrated earlier in healthy subjects by our group (Diedrichsen et al., 2011; Küper et al., 2012). Our findings are the first to demonstrate that the DN are reduced in size in FA patients using these in vivo volumetric measures. However, the size in both groups is overestimated in phase images due to the “blooming effect”. Iron-rich areas appear larger than in histological measurements. More recent developments like quantitative susceptibility mapping (QSM) likely increase the accuracy of histology (Deistung et al., 2013) and should be applied in future studies.
Our findings of reduced cerebellar volume agree with recent pathological and imaging studies of the cerebellum in FA. Initially, cerebellar atrophy was assessed visually (Wüllner et al., 1993; Huang et al., 1993; Ormerod et al., 1994; De Michele et al., 1995; Bhidayasiri et al., 2005). In the past few years, analyses applying voxel based morphometry (VBM), diffusion tensor imaging (DTI), or diffusion weighted imaging (DWI) have confirmed reduction in gray and white matter of cerebellar hemispheres (Franca et al., 2009; Della Nave et al., 2008a,b). Bhidayasiri et al. (2005) observed cerebellar atrophy in MRI more often in patients with LOFA (5/9) than in patients with early-onset FA. There was no difference in the present study, but subgroups were too small to allow meaningful statistical comparison.
The involvement of the cerebellum is much less than neuronal atrophy of the DN would indicate (Koeppen and Mazurkiewicz, 2013). In our study, patients with more pronounced atrophy of the DN had more severe loss of cerebellar volume. We hypothesize that atrophy of the nuclei might drive in part the cerebellar atrophy due to retrograde processes.
4.2. Dentate iron level
Relaxation rates in our study indicate that the iron levels in the DN of FA patients were not increased. Although a vast number of reviews and studies on FA act on the assumption of disturbances in iron metabolism, the influence and pathomechanism of these disturbances remain unresolved. A redistribution of iron has been reported, with mitochondrial iron accumulation and cytosolic iron depletion (Huang et al., 2009) resulting from defects in ISC synthesis and an increase in cellular iron uptake (Li et al., 2008; reviewed in Rouault, 2012 and Koeppen, 2011); however, inverted distribution (increased cytosolic iron and depleted mitochondrial iron) was observed by another group in the hearts of FA patients (Ramirez et al., 2012). While some report iron accumulation in brain and heart tissue of FA patients (Lamarche et al., 1980), there is also evidence in FA patients of normal absolute iron levels in the DN (Koeppen et al., 2007), dorsal root ganglia (Koeppen et al., 2009), fibroblasts (Delatycki et al., 1999), and the heart (Michael et al., 2006). X-ray fluorescence and ferritin immunohistochemistry of the DN in FA demonstrated no change in iron distribution, rather that the copper and zinc regions broadened and overlapped with the iron region (Koeppen et al., 2012). Maximal metal concentrations did not differ between patients and controls (Koeppen et al., 2007).
Waldvogel et al. (1999) were the first to use relaxometry to determine iron content of the DN. They examined 12 patients (5–33 yrs) and 23 controls. The difference of R2* values between groups reached significance (p = 0.026). These data have to be observed with caution because 20 pixels with the highest R2* were selected and their R2* value averaged. Boddaert et al. (2007) controlled for reliability by repeating the MRI (1.5 T) after 2 h, and they averaged all measured R2* values in the DN. However, they examined only 9 patients (14–23 yrs) and found, although significantly, only minor differences of R2* between patients (18.3/s) and controls (16.6/s). Values decreased to 16.2 and 15.7/s after treatment with deferiprone (20–30 mg/kg/d DFP) for only 1 month and 6 months, respectively. Presumably, either treatment is effective already after 1 month and does not induce a significant further decrease, or the initial value was incorrect. Likewise, an effect of treatment was seen by Velasco-Sanchez et al. (2011). Twenty patients (8–25 yrs) were treated with idebenone (20 mg/kg/d) and deferiprone (20 mg/kg/d) for 11 months. R2* was obtained in 1.5 T MRI. Significant (p = 0.007) reduction of R2* in the DN but not in other regions was observed during treatment. Absolute values are not available to the reader. Controls were not assessed. Recently, Bonilha da Silva et al. (2014) evaluated T2 of DN in 35 patients. T2 was significantly decreased in patients compared to controls, and was even lower at 12 month follow-up. Finally, in a recent ultrasound trial (Synofzik et al., 2011), a blinded examiner visually rated hyperechogenicity in 34 consecutive patients (14–71 yrs), which was seen in 85% of patients vs. 6% of controls. However, the histological equivalent of hyperechogenicity in FRDA is not clear. As echogenicity results from the reflection of ultrasound waves at interfaces with differing acoustic impedance it might result from both gliosis due to atrophy and increased iron content. Our findings suggest that relaxometric measurements in the DN must be be treated cautiously as outcome measures in clinical studies. Although therapy with chelators might reduce mitochondrial iron, it appears unlikely that this loss can be detected by relaxometry in the presence of normal cellular iron levels.
Age differences in the study populations might explain differences between our findings and the earlier studies. We found that the iron content in the DN tended to increase with age in healthy subjects. Similar findings were observed by Maschke et al. (2004) in healthy subjects as well as in FA patients (Waldvogel et al., 1999; Bonilha da Silva et al., 2014). These findings fit into the background of increasing iron levels during aging throughout the brain. First to show this were Hallgren and Sourander (1958), who found a linear increase of iron content in various brain regions until about 20 years of age and a less steep increase in the following years. The iron level approaches a plateau in the fifth decade (Maschke et al., 2004). Although the number of older patients was very small, Waldvogel observed that the difference in iron content between patients and controls was diminished in older participants. Bonilha da Silva et al. (2014) found a significant decrease of T2 with increasing age in the DN in patients and controls. We included patients from 24 to 52 years (mean 38 yrs), while the patients in Waldvogel's study (5–33 yrs) as well as in Boddaert's examination (14–23 yrs) were significantly younger.
When interpreting our results we have to consider that most of our patients were treated with idebenone. This treatment might have had an effect on iron levels. However, the effect should not be significant, because idebenone is a free-radical scavenger and antioxidant (Wilson et al., 2012; Parkinson et al., 2013; Soriano et al., 2013; Boddaert et al., 2007) and no chelator like deferiprone. Furthermore, Boddaert et al. (2007) found increased iron levels compared to controls although all patients were treated with idebenone. Further limitations of our study exist in a limited statistical power in consequence of the small sample size. Circumstances of UHF MRI (strict contraindications and difficult handling) reduced the number of suitable patients.
Are relaxometry and ultrasound adequate methods to assess the iron content? The increased relaxation rate and hyperechogenicity in previous studies might just as well be due to the atrophy of the DN. Neither method can differentiate between increased density and increased iron content. The methods might also detect shifts into a different state, e.g. ferritin (Koeppen et al., 2007). Copper and manganese are other paramagnetic ions that might affect relaxation rates, although the physiological concentrations might be too low (Schenck, 2003; Schenck and Zimmerman, 2004; Koeppen et al., 2012). There are limitations to transferring conclusions from relaxometry and sonography parameters to histological findings. Tissue for histopathological evaluation of regions of interest is available only post-mortem, whereas MRI measurements are performed in vivo, so the reliability of both methods within subjects cannot be assessed. However, strong correlation (R > 0.9) of non-heme iron concentrations and relaxation rates has been shown for various brain regions in a 3 T magnetic field study by Gelman et al. (1999) using iron concentrations assessed by Hallgren and Sourander in 1958. However, in other studies a correlation between R2 and iron content could not be found (Chen et al., 1989; Brooks et al., 1989). R2 is said not to be a specific indicator of iron levels, especially if abnormal tissue is involved, because other factors like tissue density, myelin content, and water content might contribute (Bartzokis et al., 1997). A more reliable factor is R2′ at high field strength, which is the difference between R2* and R2 (Gorell et al., 1995; Ordidge et al., 1994). R2′ is limited as a measure of iron as well because it can be influenced by magnetic field inhomogeneities. In our study great care was taken to measure iron content in voxels belonging to the dentate nuclei. White matter may have been included in other studies.
We expected to improve iron-related sensitivity by using 7 T field strength for the evaluation of iron content in the DN. The iron-related sensitivity increases with higher field strength, which means that smaller differences in iron content can be detected (Schenck, 1995). In vitro experiments showed a linear dependence of R2 with field strength (Vymazal et al., 1996). The increased relaxation rates at 7 T in our study confirmed the theory that the effect of iron magnetic susceptibility is higher in UHF MRI. Besides the advantages at UHF strength like increased signal-to-noise ratio to allow higher spatial resolutions, there are also many challenges. Most prominent at UHF is the transmit field inhomogeneity due to the decreased wavelength at 7 T compared to 1.5 T. Although it can be expected that resulting flip angle variations remain similar within the study population for brain scans using the same RF coil and transmit mode, this inaccuracy nevertheless represents a source of error and limitation in the presented study. The validity of our measurements is supported by the following results: We assessed relaxation rates for each patient at two magnetic field strengths to exclude shortcomings of UHF MRI. We confirmed that RR are increased at UHF MRI. Parameters were strongly correlated between both field strengths. Finally, we demonstrated increased parameters in the gray compared to the white matter, which was commonly observed in earlier studies. However, significant differences between groups were not observed at either field strength. In accordance, concentrations of iron in the DN did not differ between FA and controls in histochemical examinations (Koeppen et al., 2012). With this knowledge, in light of the low patient numbers and small absolute differences between groups, the results of earlier trials should be judged critically.
5. Conclusions
Our volumetric and relaxometric assessments demonstrate degeneration of the dentate nuclei in the presence of normal dentate iron content. We suggest a cautious handling of relaxation rates as a biomarker in trials concerning FA therapy.
The following are the supplementary data related to this article.
Supplementary Material: Validity of the method.
Relaxometry parameters were significantly correlated between both magnetic fields (1.5 T and 7 T). Parameters, at both fields and for all relaxation rates, were higher in gray (DN, GP) than in white matter.
Error bars representing 95% confidence interval. The ratio between 7 T and 1.5 T is higher in gray than in white matter and highest for R2′. R2 and R2′ values could not be assessed in GP and CCS (see next section).
Bland–Altman plot shows a proportional error. Presented are the difference vs. the average of RR at 7 T and 1.5 T. Higher RR (e.g. in gray matter) go along with larger differences of RR comparing 7 T and 1.5 T. Supplementary material: Late-onset FA. To exclude differences in the course of disease between patients with early and late- onset, we performed a t-test comparing both groups for all evaluated parameters. Dentate iron levels tended to be higher in early-onset compared to LOFA at 7 T (R2′, early-onset 80.6, late-onset 65.2, t(10) = 2.0, p = 0.079). The difference did not reach significance. No further differences were observed. Note that subgroups were small and statistical results need to be treated with caution.
Supplementary data related to this article can be foundonline at http://doi.dx.org/10.1016/j.nicl.2014.08.018.
Acknowledgements
We thank Beate Brol (BB) for help in the volumetric assessment of cerebellum and dentate nuclei. Partial funding provided by an IFORES grant of the University of Duisburg-Essen(D/D/107-40130/IFORES).
Footnotes
Cer: cerebellar white matter; GP: globus pallidus; CCS: splenium of the corpus callosum.
References
- Alper G., Narayanan V. Friedreich's ataxia. Pediatric Neurology. 2003;28(5):335–341. doi: 10.1016/s0887-8994(03)00004-3. 12878293 [DOI] [PubMed] [Google Scholar]
- Bartzokis G., Beckson M., Hance D.B., Marx P., Foster J.A., Marder S.R. MR evaluation of age-related increase of brain iron in young adult and older normal males. Magnetic Resonance Imaging. 1997;15(1):29–35. doi: 10.1016/s0730-725x(96)00234-2. 9084022 [DOI] [PubMed] [Google Scholar]
- Bland J.M., Altman D.G. Statistical methods for assessing agreement between two methods of clinical measurement. Lancet. 1986;1(8476):307–310. 2868172 [PubMed] [Google Scholar]
- Bhidayasiri R., Perlman S.L., Pulst S.-M., Geschwind D.H. Late-onset Friedreich ataxia: phenotypic analysis, magnetic resonance imaging findings, and review of the literature. Archives of Neurology. 2005;62(12):1865–1869. doi: 10.1001/archneur.62.12.1865. 16344344 [DOI] [PubMed] [Google Scholar]
- Boddaert N., Le Quan Sang K.H., Rötig A., Leroy-Willig A., Gallet S., Brunelle F. Selective iron chelation in Friedreich ataxia: biologic and clinical implications. Blood. 2007;110(1):401–408. doi: 10.1182/blood-2006-12-065433. 17379741 [DOI] [PubMed] [Google Scholar]
- Bonilha da Silva C., Bergo F.P., D'Abreu A., Cendes F., Lopes-Cendes I., França M.C., Jr. Dentate nuclei T2 relaxometry is a reliable neuroimaging marker in Friedreich's ataxia. European Journal of Neurology: the Official Journal of the European Federation of Neurological Societies. 2014;21:1131–1136. doi: 10.1111/ene.12448. 24779923 [DOI] [PubMed] [Google Scholar]
- Brooks D.J., Luthert P., Gadian D., Marsden C.D. Does signal-attenuation on high-field T2-weighted MRI of the brain reflect regional cerebral iron deposition? Observations on the relationship between regional cerebral water proton T2 values and iron levels. Journal of Neurology, Neurosurgery, and Psychiatry. 1989;52(1):108–111. doi: 10.1136/jnnp.52.1.108. 2709018 [DOI] [PMC free article] [PubMed] [Google Scholar]
- Campuzano V., Montermini L., Moltò M.D., Pianese L., Cossée M., Cavalcanti F. Friedreich's ataxia: autosomal recessive disease caused by an intronic GAA triplet repeat expansion. Science (New York, N.Y.) 1996;271(5254):1423–1427. doi: 10.1126/science.271.5254.1423. 8596916 [DOI] [PubMed] [Google Scholar]
- Cavadini P., O'Neill H.A., Benada O., Isaya G. Assembly and iron-binding properties of human frataxin, the protein deficient in Friedreich ataxia. Human Molecular Genetics. 2002;11(3):217–227. doi: 10.1093/hmg/11.3.217. 11823441 [DOI] [PubMed] [Google Scholar]
- Chen J.C., Hardy P.A., Clauberg M., Joshi J.G., Parravano J., Deck J.H. T2 values in the human brain: Comparison with quantitative assays of iron and ferritin. Radiology. 1989;173(2):521–526. doi: 10.1148/radiology.173.2.2798884. 2798884 [DOI] [PubMed] [Google Scholar]
- De Michele G., Di Salle F., Filla A., D'Alessio G., Ambrosio G., Viscardi L. Magnetic resonance imaging in “typical” and “late onset” Friedreich's disease and early onset cerebellar ataxia with retained tendon reflexes. Italian Journal of Neurological Sciences. 1995;16(5):303–308. doi: 10.1007/BF02249105. 8537218 [DOI] [PubMed] [Google Scholar]
- De Michele G., Filla A., Cavalcanti F., Di Maio L., Pianese L., Castaldo I. Late onset Friedreich's disease: clinical features and mapping of mutation to the FRDA locus. Journal of Neurology, Neurosurgery, and Psychiatry. 1994;57(8):977–979. doi: 10.1136/jnnp.57.8.977. 8057123 [DOI] [PMC free article] [PubMed] [Google Scholar]
- Deistung A., Schäfer A., Schweser F., Biedermann U., Turner R., Reichenbach J.R. Toward in vivo histology: a comparison of quantitative susceptibility mapping (QSM) with magnitude-, phase-, and R2*-imaging at ultra-high magnetic field strength. Neuroimage. 2013;65:299–314. doi: 10.1016/j.neuroimage.2012.09.055. 23036448 [DOI] [PubMed] [Google Scholar]
- Delatycki M.B., Camakaris J., Brooks H., Evans-Whipp T., Thorburn D.R., Williamson R. Direct evidence that mitochondrial iron accumulation occurs in Friedreich ataxia. Annals of Neurology. 1999;45(5):673–675. 10319894 [PubMed] [Google Scholar]
- Della Nave R., Ginestroni A., Giannelli M., Tessa C., Salvatore E., Salvi F. Brain structural damage in Friedreich's ataxia. Journal of Neurology, Neurosurgery, and Psychiatry. 2008;79(1):82–85. doi: 10.1136/jnnp.2007.124297. 17634216 [DOI] [PubMed] [Google Scholar]
- Della Nave R., Ginestroni A., Tessa C., Salvatore E., Bartolomei I., Salvi F. Brain white matter tracts degeneration in Friedreich ataxia. An in vivo MRI study using tract-based spatial statistics and voxel-based morphometry. Neuroimage. 2008;40(1):19–25. doi: 10.1016/j.neuroimage.2007.11.050. 18226551 [DOI] [PubMed] [Google Scholar]
- Diedrichsen J., Maderwald S., Küper M., Thürling M., Rabe K., Gizewski E.R. Imaging the deep cerebellar nuclei: a probabilistic atlas and normalization procedure. Neuroimage. 2011;54(3):1786–1794. doi: 10.1016/j.neuroimage.2010.10.035. 20965257 [DOI] [PubMed] [Google Scholar]
- Dimitrova A., Gerwig M., Brol B., Gizewski E.R., Forsting M., Beck A. Correlation of cerebellar volume with eyeblink conditioning in healthy subjects and in patients with cerebellar cortical degeneration. Brain Research. 2008;1198:73–84. doi: 10.1016/j.brainres.2008.01.034. [DOI] [PubMed] [Google Scholar]
- Epplen C., Epplen J.T., Frank G., Miterski B., Santos E.J., Schöls L. Differential stability of the (GAA)n tract in the Friedreich ataxia (STM7) gene. Human Genetics. 1997;99(6):834–836. doi: 10.1007/s004390050458. 9187683 [DOI] [PubMed] [Google Scholar]
- França M.C., Jr, D'Abreu A., Yasuda C.L., Bonadia L.C., Santos da Silva M., Nucci A. A combined voxel-based morphometry and 1H-MRS study in patients with Friedreich's ataxia. Journal of Neurology. 2009;256(7):1114–1120. doi: 10.1007/s00415-009-5079-5. 19280106 [DOI] [PubMed] [Google Scholar]
- Gakh O., Park S., Liu G., Macomber L., Imlay J.A., Ferreira G.C. Mitochondrial iron detoxification is a primary function of frataxin that limits oxidative damage and preserves cell longevity. Human Molecular Genetics. 2006;15(3):467–479. doi: 10.1093/hmg/ddi461. 16371422 [DOI] [PubMed] [Google Scholar]
- Gelman N., Gorell J.M., Barker P.B., Savage R.M., Spickler E.M., Windham J.P. MR imaging of human brain at 3.0 T: preliminary report on transverse relaxation rates and relation to estimated iron content. Radiology. 1999;210(3):759–767. doi: 10.1148/radiology.210.3.r99fe41759. 10207479 [DOI] [PubMed] [Google Scholar]
- Gorell J.M., Ordidge R.J., Brown G.G., Deniau J.C., Buderer N.M., Helpern J.A. Increased iron-related MRI contrast in the substantia nigra in Parkinson's disease. Neurology. 1995;45(6):1138–1143. doi: 10.1212/wnl.45.6.1138. 7783878 [DOI] [PubMed] [Google Scholar]
- Haacke E.M., Lai S., Yablonskiy D.A., Lin W. In vivo validation of the BOLD mechanism: a review of signal changes in gradient echo functional MRI in the presence of flow. International Journal of Imaging Systems and Technology. 1995;6:153–163. [Google Scholar]
- Hallgren B., Sourander P. The effect of age on the non-haemin iron in the human brain. Journal of Neurochemistry. 1958;3(1):41–51. doi: 10.1111/j.1471-4159.1958.tb12607.x. 13611557 [DOI] [PubMed] [Google Scholar]
- Harding A.E. Clinical features and classification of inherited ataxias. Advances in Neurology. 1993;61:1–14. 8421960 [PubMed] [Google Scholar]
- Huang M.L..-H., Becker E.M., Whitnall M., Suryo Rahmanto Y., Ponka P., Richardson D.R. Elucidation of the mechanism of mitochondrial iron loading in Friedreich's ataxia by analysis of a mouse mutant. Proceedings of the National Academy of Sciences of the United States of America. 2009;106(38):16381–16386. doi: 10.1073/pnas.0906784106. 19805308 [DOI] [PMC free article] [PubMed] [Google Scholar]
- Huang Y.P., Tuason M.Y., Wu T., Plaitakis A. MRI and CT features of cerebellar degeneration. Journal of the Formosan Medical Association = Taiwan Yi Zhi. 1993;92(6):494–508. 8106035 [PubMed] [Google Scholar]
- Koeppen A.H. Friedreich's ataxia: pathology, pathogenesis, and molecular genetics. Journal of the Neurological Sciences. 2011;303(1–2):1–12. doi: 10.1016/j.jns.2011.01.010. 21315377 [DOI] [PMC free article] [PubMed] [Google Scholar]
- Koeppen A.H., Mazurkiewicz J.E. Friedreich ataxia: Neuropathology revised. Journal of Neuropathology and Experimental Neurology. 2013;72(2):78–90. doi: 10.1097/NEN.0b013e31827e5762. 23334592 [DOI] [PMC free article] [PubMed] [Google Scholar]
- Koeppen A.H., Michael S.C., Knutson M.D., Haile D.J., Qian J., Levi S. The dentate nucleus in Friedreich's ataxia: the role of iron-responsive proteins. Acta Neuropathologica. 2007;114(2):163–173. doi: 10.1007/s00401-007-0220-y. 17443334 [DOI] [PubMed] [Google Scholar]
- Koeppen A.H., Morral J.A., Davis A.N., Qian J., Petrocine S.V., Knutson M.D. The dorsal root ganglion in Friedreich's ataxia. Acta Neuropathologica. 2009;118(6):763–776. doi: 10.1007/s00401-009-0589-x. 19727777 [DOI] [PubMed] [Google Scholar]
- Koeppen A.H., Ramirez R.L., Yu D., Collins S.E., Qian J., Parsons P.J. Friedreich's ataxia causes redistribution of iron, copper, and zinc in the dentate nucleus. Cerebellum (London, England) 2012;11(4):845–860. doi: 10.1007/s12311-012-0383-5. 22562713 [DOI] [PMC free article] [PubMed] [Google Scholar]
- Küper M., Thürling M., Maderwald S., Ladd M.E., Timmann D. Structural and functional magnetic resonance imaging of the human cerebellar nuclei. Cerebellum (London, England) 2012;11(2):314–324. doi: 10.1007/s12311-010-0194-5. 20665253 [DOI] [PubMed] [Google Scholar]
- Lamarche J.B., Côté M., Lemieux B. The cardiomyopathy of Friedreich's ataxia morphological observations in 3 cases. Canadian Journal of Neurological Sciences. le Journal Canadien des Sciences Neurologiques. 1980;7(4):389–396. doi: 10.1017/s0317167100022927. 6452194 [DOI] [PubMed] [Google Scholar]
- Li K., Besse E.K., Ha D., Kovtunovych G., Rouault T.A. Iron-dependent regulation of frataxin expression: implications for treatment of Friedreich ataxia. Human Molecular Genetics. 2008;17(15):2265–2273. doi: 10.1093/hmg/ddn127. 18424449 [DOI] [PMC free article] [PubMed] [Google Scholar]
- Maschke M., Weber J., Dimitrova A., Bonnet U., Bohrenkämper J., Sturm S. Age-related changes of the dentate nuclei in normal adults as revealed by 3D fast low angle shot (FLASH) echo sequence magnetic resonance imaging. Journal of Neurology. 2004;251(6):740–746. doi: 10.1007/s00415-004-0420-5. 15311352 [DOI] [PubMed] [Google Scholar]
- Michael S., Petrocine S.V., Qian J., Lamarche J.B., Knutson M.D., Garrick M.D. Iron and iron-responsive proteins in the cardiomyopathy of Friedreich's ataxia. Cerebellum (London, England) 2006;5(4):257–267. doi: 10.1080/14734220600913246. 17134988 [DOI] [PubMed] [Google Scholar]
- Ordidge R.J., Gorell J.M., Deniau J.C., Knight R.A., Helpern J.A. Assessment of relative brain iron concentrations using T2-weighted and T2*-weighted MRI at 3 Tesla. Magnetic Resonance in Medicine: Official Journal of the Society of Magnetic Resonance in Medicine / Society of Magnetic Resonance in Medicine. 1994;32(3):335–341. doi: 10.1002/mrm.1910320309. 7984066 [DOI] [PubMed] [Google Scholar]
- Ormerod I.E., Harding A.E., Miller D.H., Johnson G., MacManus D., du Boulay E.P. Magnetic resonance imaging in degenerative ataxic disorders. Journal of Neurology, Neurosurgery, and Psychiatry. 1994;57(1):51–57. doi: 10.1136/jnnp.57.1.51. 8301305 [DOI] [PMC free article] [PubMed] [Google Scholar]
- Pagani E., Ginestroni A., Della Nave R., Agosta F., Salvi F., De Michele G. Assessment of brain white matter fiber bundle atrophy in patients with Friedreich ataxia. Radiology. 2010;255(3):882–889. doi: 10.1148/radiol.10091742. 20501725 [DOI] [PubMed] [Google Scholar]
- Pandolfo M. Friedreich ataxia. Seminars in Pediatric Neurology. 2003;10(3):163–172. doi: 10.1016/s1071-9091(03)00025-1. 14653404 [DOI] [PubMed] [Google Scholar]
- Pandolfo M. Friedreich ataxia: the clinical picture. Journal of Neurology. 2009;256(Suppl. 1):3–8. doi: 10.1007/s00415-009-1002-3. 19283344 [DOI] [PubMed] [Google Scholar]
- Parkinson M.H., Schulz J.B., Giunti P. Co-enzyme Q10 and idebenone use in Friedreich's ataxia. Journal of Neurochemistry. 2013;126(Suppl. 1):125–141. doi: 10.1111/jnc.12322. 23859348 [DOI] [PubMed] [Google Scholar]
- Rabe K., Livne O., Gizewski E.R., Aurich V., Beck A., Timmann D. Adaptation to visuomotor rotation and force field perturbation is correlated to different brain areas in patients with cerebellar degeneration. Journal of Neurophysiology. 2009;101(4):1961–1971. doi: 10.1152/jn.91069.2008. 19176608 [DOI] [PubMed] [Google Scholar]
- Ramirez R.L., Qian J., Santambrogio P., Levi S., Koeppen A.H. Relation of cytosolic iron excess to cardiomyopathy of Friedreich's ataxia. American Journal of Cardiology. 2012;110(12):1820–1827. doi: 10.1016/j.amjcard.2012.08.018. 23000103 [DOI] [PMC free article] [PubMed] [Google Scholar]
- Rorden C., Karnath H.-O., Bonilha L. Improving lesion-symptom mapping. Journal of Cognitive Neuroscience. 2007;19(7):1081–1088. doi: 10.1162/jocn.2007.19.7.1081. 17583985 [DOI] [PubMed] [Google Scholar]
- Rötig A., de Lonlay P., Chretien D., Foury F., Koenig M., Sidi D. Aconitase and mitochondrial iron–sulphur protein deficiency in Friedreich ataxia. Nature Genetics. 1997;17(2):215–217. doi: 10.1038/ng1097-215. 9326946 [DOI] [PubMed] [Google Scholar]
- Rouault T.A. Biogenesis of iron–sulfur clusters in mammalian cells: new insights and relevance to human disease. Disease Models & Mechanisms. 2012;5(2):155–164. doi: 10.1242/dmm.009019. 22382365 [DOI] [PMC free article] [PubMed] [Google Scholar]
- Schenck J.F. Imaging of brain iron by magnetic resonance: T2 relaxation at different field strengths. Journal of the Neurological Sciences. 1995;134(Suppl.):10–18. doi: 10.1016/0022-510x(95)00203-e. 8847539 [DOI] [PubMed] [Google Scholar]
- Schenck J.F. Magnetic resonance imaging of brain iron. Journal of the Neurological Sciences. 2003;207(1–2):99–102. doi: 10.1016/s0022-510x(02)00431-8. 12614939 [DOI] [PubMed] [Google Scholar]
- Schenck J.F., Zimmerman E.A. High-field magnetic resonance imaging of brain iron: birth of a biomarker? NMR in Biomedicine. 2004;17(7):433–445. doi: 10.1002/nbm.922. 15523705 [DOI] [PubMed] [Google Scholar]
- Schmahmann J.D., Doyon J., McDonald D., Holmes C., Lavoie K.. MRI. Atlas of the Human Cerebellum. Academic Press; San Diego: 1999. [DOI] [PubMed] [Google Scholar]
- Schmitz-Hübsch T., du Montcel S.T., Baliko L., Berciano J., Boesch S., Depondt C. Scale for the assessment and rating of ataxia: development of a new clinical scale. Neurology. 2006;66(11):1717–1720. doi: 10.1212/01.wnl.0000219042.60538.92. 16769946 [DOI] [PubMed] [Google Scholar]
- Schols L., Amoiridis G., Przuntek H., Frank G., Epplen J.T., Epplen C. Friedreich's ataxia. Revision of the phenotype according to molecular genetics. Brain. 1997;120(12):2131–2140. doi: 10.1093/brain/120.12.2131. [DOI] [PubMed] [Google Scholar]
- Soriano S., Llorens J.V., Blanco-Sobero L., Gutiérrez L., Calap-Quintana P., Morales M.P. Deferiprone and idebenone rescue frataxin depletion phenotypes in a Drosophila model of Friedreich's ataxia. Gene. 2013;521(2):274–281. doi: 10.1016/j.gene.2013.02.049. 23542074 [DOI] [PubMed] [Google Scholar]
- Subramony S.H., May W., Lynch D., Gomez C., Fischbeck K., Hallett M. Measuring Friedreich ataxia: Interrater reliability of a neurologic rating scale. Neurology. 2005;64(7):1261–1262. doi: 10.1212/01.WNL.0000156802.15466.79. 15824358 [DOI] [PubMed] [Google Scholar]
- Synofzik M., Godau J., Lindig T., Schöls L., Berg D. Transcranial sonography reveals cerebellar, nigral, and forebrain abnormalities in Friedreich's ataxia. Neuro-Degenerative Diseases. 2011;8(6):470–475. doi: 10.1159/000327751. 21659723 [DOI] [PubMed] [Google Scholar]
- Urich H., Norman R.M., Lloyd O.C. Suprasegmental lesions in Friedreich's ataxia. Confinia Neurologica. 1957;17(6):360–371. doi: 10.1159/000105212. 13511951 [DOI] [PubMed] [Google Scholar]
- Velasco-Sánchez D., Aracil A., Montero R., Mas A., Jiménez L., O'Callaghan M. Combined therapy with idebenone and deferiprone in patients with Friedreich's ataxia. Cerebellum (London, England) 2011;10(1):1–8. doi: 10.1007/s12311-010-0212-7. 20865357 [DOI] [PubMed] [Google Scholar]
- Vymazal J., Brooks R.A., Baumgarner C., Tran V., Katz D., Bulte J.W. The relation between brain iron and NMR relaxation times: an in vitro study. Magnetic Resonance in Medicine: Official Journal of the Society of Magnetic Resonance in Medicine / Society of Magnetic Resonance in Medicine. 1996;35(1):56–61. doi: 10.1002/mrm.1910350108. 8771022 [DOI] [PubMed] [Google Scholar]
- Waldvogel D., van Gelderen P., Hallett M. Increased iron in the dentate nucleus of patients with Friedrich's ataxia. Annals of Neurology. 1999;46(1):123–125. doi: 10.1002/1531-8249(199907)46:1<123::aid-ana19>3.0.co;2-h. 10401790 [DOI] [PubMed] [Google Scholar]
- Weier K., Beck A., Magon S., Amann M., Naegelin Y., Penner I.K. Evaluation of a new approach for semi-automatic segmentation of the cerebellum in patients with multiple sclerosis. Journal of Neurology. 2012;259(12):2673–2680. doi: 10.1007/s00415-012-6569-4. 22711160 [DOI] [PubMed] [Google Scholar]
- Wilson R.B. Therapeutic developments in Friedreich ataxia. Journal of Child Neurology. 2012;27(9):1212–1216. doi: 10.1177/0883073812449691. 22791549 [DOI] [PMC free article] [PubMed] [Google Scholar]
- Wüllner U., Klockgether T., Petersen D., Naegele T., Dichgans J. Magnetic resonance imaging in hereditary and idiopathic ataxia. Neurology. 1993;43(2):318–325. doi: 10.1212/wnl.43.2.318. 8437696 [DOI] [PubMed] [Google Scholar]
Associated Data
This section collects any data citations, data availability statements, or supplementary materials included in this article.
Supplementary Materials
Supplementary Material: Validity of the method.
Relaxometry parameters were significantly correlated between both magnetic fields (1.5 T and 7 T). Parameters, at both fields and for all relaxation rates, were higher in gray (DN, GP) than in white matter.
Error bars representing 95% confidence interval. The ratio between 7 T and 1.5 T is higher in gray than in white matter and highest for R2′. R2 and R2′ values could not be assessed in GP and CCS (see next section).
Bland–Altman plot shows a proportional error. Presented are the difference vs. the average of RR at 7 T and 1.5 T. Higher RR (e.g. in gray matter) go along with larger differences of RR comparing 7 T and 1.5 T. Supplementary material: Late-onset FA. To exclude differences in the course of disease between patients with early and late- onset, we performed a t-test comparing both groups for all evaluated parameters. Dentate iron levels tended to be higher in early-onset compared to LOFA at 7 T (R2′, early-onset 80.6, late-onset 65.2, t(10) = 2.0, p = 0.079). The difference did not reach significance. No further differences were observed. Note that subgroups were small and statistical results need to be treated with caution.