

Abstract
Muscle sympathetic nerve activity (MSNA) is greatly elevated in patients with obstructive sleep apnoea (OSA) during daytime wakefulness, leading to hypertension, but the underlying mechanisms are poorly understood. By recording MSNA concurrently with functional Magnetic Resonance Imaging (fMRI) of the brain we aimed to identify the central processes responsible for the sympathoexcitation. Spontaneous fluctuations in MSNA were recorded via tungsten microelectrodes inserted percutaneously into the common peroneal nerve in 17 OSA patients and 15 healthy controls lying in a 3 T MRI scanner. Blood Oxygen Level Dependent (BOLD) contrast gradient echo, echo-planar images were continuously collected in a 4 s ON, 4 s OFF (200 volumes) sampling protocol. Fluctuations in BOLD signal intensity covaried with the intensity of the concurrently recorded bursts of MSNA. In both groups there was a positive correlation between MSNA and signal intensity in the left and right insulae, dorsolateral prefrontal cortex (dlPFC), dorsal precuneus, sensorimotor cortex and posterior temporal cortex, and the right mid-cingulate cortex and hypothalamus. In OSA the left and right dlPFC, medial PFC (mPFC), dorsal precuneus, anterior cingulate cortex, retrosplenial cortex and caudate nucleus showed augmented signal changes compared with controls, while the right hippocampus/parahippocampus signal intensity decreased in controls but did not change in the OSA subjects. In addition, there were significant increases in grey matter volume in the left mid-insula, the right insula, left and right primary motor cortices, left premotor cortex, left hippocampus and within the brainstem and cerebellum, and significant decreases in the mPFC, occipital lobe, right posterior cingulate cortex, left cerebellar cortex and the left and right amygdala in OSA, but there was no overlap between these structural changes and the functional changes in OSA. These data suggest that the elevated muscle vasoconstrictor drive in OSA may result from functional changes within these brain regions, which are known to be directly or indirectly involved in the modulation of sympathetic outflow via the brainstem. That there was no overlap in the structural and functional changes suggests that asphyxic damage due to repeated episodes of nocturnal obstructive apnoea is not the main cause of the sympathoexcitation.
Keywords: fMRI, Microneurography, Muscle sympathetic nerve activity, Obstructive sleep apnoea
Highlights
-
•
Obstructive sleep apnea increases muscle sympathetic nerve activity (MSNA).
-
•
fMRI was used to identify brain sites temporally coupled to the increase in MSNA.
-
•
Augmented BOLD signal intensity occurred in several cortical and subcortical sites.
-
•
The elevated MSNA in OSA may result from functional changes within these sites.
1. Introduction
Obstructive sleep apnoea (OSA) is characterized by repetitive complete or partial cessation of airflow during sleep, owing to collapse of the upper airway. OSA is associated with significantly increased muscle sympathetic nerve activity (MSNA; Hedner et al., 1988, 1995; Carlson et al., 1993, 1996; Somers et al., 1995; Narkiewicz et al., 1998; Narkiewicz & Somers, 2003; Elam et al., 2002; Imadojemu et al., 2007; Fatouleh et al., 2014), which leads to neurogenic hypertension, and it is thought that the repetitive episodes of intermittent hypoxia during sleep are largely responsible for this sustained sympathoexcitation during daytime wakefulness (Lanfranchi & Somers, 2001; Nieto et al., 2000; Peppard et al., 2000). However, despite the substantial negative effects of increased MSNA on health, little is known about the underlying mechanisms responsible for the increased MSNA in OSA.
Over the past decade, a number of investigations in humans have begun to describe both anatomical and functional brain changes associated with OSA. These studies have found that OSA is associated with significant functional and grey matter changes in a number of regions, including those that can modulate MSNA (Canessa et al., 2011; Harper et al., 2003, 2012; Macey et al., 2002, 2003; Morrell et al., 2010; Joo et al., 2010, 2013). Although these studies investigated neural substrates responsible for evoked changes in sympathetic drive, none have explored brain function in structures responsible for the increased MSNA at rest and the hypertension associated with OSA.
The aim of the current investigation was to identify brain sites potentially responsible for the increased MSNA associated with OSA. We used concurrent recordings of MSNA and functional Magnetic Resonance Imaging (fMRI) to assess brain activity associated with the pattern of an individual subject's MSNA, as described previously (James et al., 2013; Macefield and Henderson, 2010). Furthermore, we assessed regional grey matter changes using voxel-based morphometry (VBM) (Ashburner & Friston, 2000). We hypothesised that the increase in MSNA in OSA would be associated with altered function and anatomy in higher brain regions that modulate MSNA, including the cingulate cortex, prefrontal cortex, insula and hypothalamus.
2. Methods
2.1. Subjects
Seventeen subjects with obstructive sleep apnoea (15 males, mean ± SEM age 55 ± 3, range 35–69 years) and 15 healthy controls (12 males, age 53 ± 3, 35–68 years) were recruited. All OSA subjects were evaluated and diagnosed based on an overnight sleep study (polysomnography), which included both standard respiratory and SaO2 measurements, as well as electroencephalographic (EEG), electrooculographic (EOG) and electromyographic (EMG) measurements, at the sleep laboratory of Prince of Wales Hospital. All control subjects undertook an overnight assessment using an in-home device that monitored nasal airflow and oxygen saturation (ApneaLink™; ResMed, Sydney, Australia). All procedures were approved by the Human Research Ethics Committees of the University of Western Sydney and the University of New South Wales. Written consent was obtained from all subjects in accordance with the Declaration of Helsinki.
2.2. MRI and MSNA acquisition
Subjects lay supine on an MRI bed with their knees supported on a foam cushion. An insulated tungsten microelectrode was inserted percutaneously into a muscle fascicle of the common peroneal nerve to record multiunit muscle sympathetic nerve activity (MSNA). An uninsulated microelectrode was inserted nearby subdermally (1–2 cm) as a reference electrode. Neural activity was amplified (gain 100, band pass 0.1–5.0 kHz) using an MR compatible stainless steel isolated headstage (Neuro Amp EX ADInstruments, Australia) and further amplified and filtered (total gain 2 × 10⁴, band pass 0.3–5.0 kHz). Data were recorded using a computer-based data acquisition and analysis system (PowerLab 16S; ADInstruments, Australia).
In the laboratory continuous blood pressure (BP) was recorded using radial arterial tonometry (Colin 7000 NIBP; Colin Corp., Aichi, Japan), ECG (0.3–1.0 kHz) was recorded from the chest using Ag−AgCl surface electrodes, and respiration was monitored from a piezoelectric transducer around the abdomen (Pneumotrace, UFI). Spontaneous MSNA, heart rate and BP were recorded continuously for 10 min of undisturbed rest, of which the final 5 min was used for analysis. Following this period, the ECG electrodes were removed, the BP recording stopped and the subject wheeled to the scanner with the microelectrode in situ. During scanning heart rate was monitored via an MR-compatible piezoelectric pulse transducer on the fingerpad and respiration was monitored via the MR-compatible piezoelectric transducer around the abdomen.
With each subject relaxed and enclosed in a 32-channel SENSE head coil, a continuous series of 200 gradient echo echo-planar images, sensitive to the blood oxygen level dependent contrast were collected (46 axial slices, TR = 8 s, TE = 40 ms, flip angle 90°, raw voxel size = 1.5 mm3) using a 3 Tesla MRI whole body scanner (Achieva, Philips Medical Systems). A 4 s-ON, 4 s-OFF protocol was used, with MSNA measured during the 4 s-OFF period, and a whole-brain, 46 slice axial volume was collected during the subsequent 4 s-ON period. A high-resolution 3D T1-weighted anatomical image set was also collected (turbo field echo; TE = 2.5 ms, TR = 5600 ms; flip angle = 8°, voxel size = 0.8 mm3).
2.3. MSNA and fMRI processing
All MSNA signals were RMS-processed (root mean square, moving average, time constant 200 ms). MSNA during the pre-MRI recording period was quantified according to standard time-domain analysis of the RMS-processed signal as burst frequency (bursts min−1) and burst incidence (bursts per 100 heart beats). Analysis of variance, coupled with Tukey's multiple comparisons test, was used to assess statistical significance across each group (Prism 6.0, GraphPad Software, USA). All values are expressed as means and standard errors, and p < 0.05 was considered statistically significant.
During the fMRI scanning period, MSNA bursts were manually measured from RMS-processed nerve signal during the 4 s inter-scan OFF period. This period was divided into 4 × 1 s intervals and the number of MSNA burst for each 1 s epoch was determined.
Using SPM8 (Friston et al., 1995), fMRI images were realigned, spatially normalized to the Montreal Neurological Institute (MNI) template and intensity normalized to eliminate any slow drift in signal intensity. Scans were then smoothed by a 6 mm full-width at half-maximum (FWHM) Gaussian filter. Signal intensity changes were measured during the subsequent 4 s ON period corresponding to a measurement concurrent with the MSNA recording based on the ~5 s neurovascular coupling delay and the ~1 s required for conduction of the sympathetic bursts from the brain to the peripheral recording site. Brain images were collected in a caudal to rostral sequence, extending from the rostral midbrain to the vertex of the cerebral cortex. Given that we have previously performed brainstem-specific analyses, we focused this investigation on brain regions rostral to the midbrain (seconds 2, 3 and 4). Therefore, in each individual subject, the number of MSNA bursts during each of these 1 s periods was determined and a 200 time point model derived for each individual subject for the 2nd, 3rd and 4th second time periods. That is, for each brain volume, a value of the total number of MSNA bursts that occurred during the 2nd second of the 4 second TR was entered into a search model. The same analysis was then performed for the 3rd and 4th second periods.
Signal intensity changes that matched each individual subject's MSNA burst model were identified. Second-level analyses were then performed to determine in which brain regions signal intensity increased or decreased during each MSNA burst in both control and OSA subjects (random effects, p < 0.005, uncorrected, minimum cluster size 20 voxels). In addition, regions in which changes in signal intensity were significantly different between control and OSA subjects were determined (random effects, p < 0.005, uncorrected, minimum cluster size 20 voxels).
Since we were essentially correlating on-going signal intensity with spontaneous bursts of MSNA, and that these bursts were significantly more frequent in OSA subjects than controls, it is possible that differences in contrast values between OSA and controls may have been partially due to differences in search models. To ensure that this was not the case, for each significant cluster we extracted the raw signal intensity changes and compared signal intensity when bursts were present to signal intensity during periods where there were no bursts. Significant differences in signal intensity between controls and OSA subjects were then determined (p < 0.05, two sample t-test).
2.4. T1 image processing
T1-weighted images from each subject were bias corrected using SPM8 unified segmentation (Ashburner & Friston, 2005), and then segmented and spatially normalized using a second pass of the unified segmentation algorithm. The results of the segmentation and spatial normalization were whole-brain “maps” of grey matter probabilities, spatially normalized into the Montreal Neurological Institute (MNI) template space, and “modulated” by the volume changes due to the normalization. The normalized, modulated grey matter images were then smoothed using a 6 mm FWHM Gaussian filter, and analysed for group differences.
Significant differences in grey matter between OSA and control subjects were determined using random effects analysis with age, sex and total brain volume as nuisance variables (p < 0.0005, false discovery rate corrected for multiple comparisons, minimum cluster size 20 voxels). We also lowered the statistical threshold (p < 0.005, uncorrected, minimum cluster size 20 voxels) to explore less significant grey matter volume differences. Significant grey matter volume differences were then overlaid onto an individual's T1-weighted image. Finally, to determine if there were any brain regions in which OSA subjects displayed both significant differences in MSNA-related fMRI signal intensity and in grey matter volume, we created binary images of the statistical maps derived from these two analyses. The intersection of these two statistical maps was then calculated.
3. Results
Based on overnight polysomnography, all OSA subjects were diagnosed with mild to severe OSA. Based on apnoea–hypopnoea indices (AHIs: mild 5–15 events per hour, moderate 15–30, severe > 30), two subjects were diagnosed with mild, two with moderate and 13 with severe OSA (AHI 36 ± 4; range 7–62). In OSA subjects, the minimum SaO2 on the night of polysomnography was 83 ± 2% (range 67–93%), baseline SaO2 during wakefulness was 95 ± 1% (range 91–99%), and the baseline Epworth Sleep Scale score was 9 ± 1 (range 3–19). The mean AHI for the control subjects following an in-home overnight assessment of sleep patterns was 3.3 ± 1. Overnight monitoring of sleep was made at variable times after the scanning had been conducted, and revealed that, while the majority had an AHI of 1–3, two of the control subjects had an AHI of 8 and 10. Nevertheless, these subjects were otherwise healthy and did not identify as snorers or report being tired during the day; one subject reported drinking on the night of the test, which may well have affected his sleep patterns. Given the absent clinical history of sleep disorders, it was not deemed necessary to undertake a full polysomnographic assessment in these two individuals because they were symptom-free and normotensive. Although there was no significant difference in age between OSA and control subject groups (two sample t-test; p > 0.05), as expected there was a significant difference in body mass index (BMI: OSA 31 ± 2, controls 25 ± 1, p = 0.001).
3.1. Physiology
Resting mean BP was significantly higher in OSA subjects (OSA 99 ± 3 mm Hg, controls 86 ± 4 mm Hg; p = 0.008), but there were no significant differences in resting heart rate (OSA 69 ± 3 beats/min, controls 66 ± 3 beats/min, p = 0.5). As expected OSA subjects had a significantly elevated MSNA burst incidence (OSA 78 ± 5 bursts/100 heart beats, controls 40 ± 2 bursts/100 heart beats; p < 0.0001) and burst frequency (OSA 53 ± 3 bursts/min, controls 26 ± 2 bursts/min, p < 0.0001). Fig. 1A shows a recording of MSNA, together with heart rate and respiration, in a patient with severe OSA. Raw data from a healthy control subject are shown in Fig. 1B; MSNA was clearly elevated in the subject with OSA.
Fig. 1.
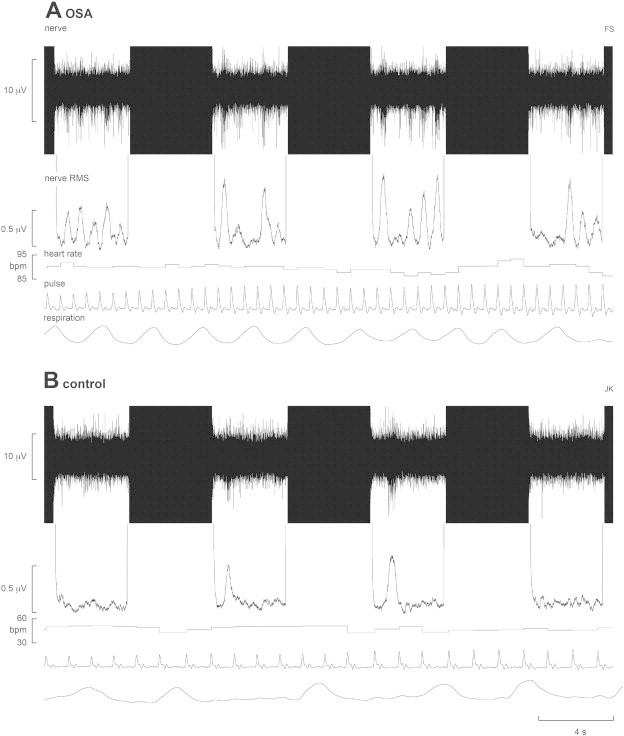
Multiunit recording of muscle sympathetic nerve activity (MSNA) from a 50-year-old male patient with obstructive sleep apnoea (OSA) and a 42 year-old male healthy control subject. The mean-voltage neurogram is shown in the nerve RMS (root mean square) trace; this was used to quantify the number of sympathetic bursts. Four consecutive sets of the 4 s-ON and 4 s-OFF scanning sequences are shown; the black areas represent the scanning artefacts. MSNA burst amplitudes were measured during the OFF periods. Heart rate was calculated from a piezoelectric pulse transducer on the fingerpad; respiration was monitored via a piezoelectric transducer around the abdomen. Note the higher level of MSNA in the OSA patient; the control subject was a fit individual with low resting heart and respiratory rates.
3.2. Changes in fMRI signal intensity
Analysis of MSNA-related changes in BOLD signal intensity revealed that in control subjects, significant increases occurred in the following regions: the left and right insulae, dorsolateral prefrontal cortex (dlPFC), dorsal precuneus, sensorimotor cortex and posterior temporal cortex, and the right mid-cingulate cortex (MCC) and hypothalamus (Fig. 2, Table 1) - areas we had previously shown were temporally coupled to bursts of MSNA in young control subjects (James et al., 2013).
Fig. 2.
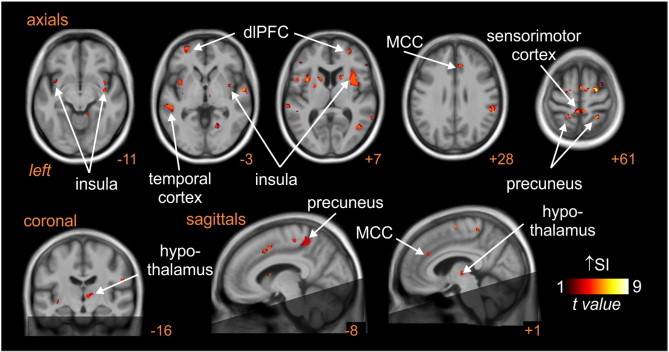
Brain regions in which BOLD signal intensity (SI) changes were significantly correlated to muscle sympathetic nerve activity (MSNA) pattern at rest. Hot colour scale represents regions in which signal intensity increased during MSNA bursts. Significant clusters are overlaid onto a mean T1-weighted anatomical template image. The dark shading indicates brain regions not included in the analysis. Slice location in Montreal Neurological Institute space is indicated at the lower right of each image. dlPFC: dorsolateral prefrontal cortex; MCC: mid-cingulate cortex.
Table 1.
Location, t-score and cluster size for regions showing significant signal intensity changes that were coupled to spontaneous muscle sympathetic nerve activity in control and subjects with obstructive sleep apnoea. Cluster locations are given in Montreal Neurological Institute (MNI) space.
| Brain regions | X | Y | Z | t-Score | Cluster size |
|---|---|---|---|---|---|
| Insula | |||||
| Right | 38 | –3 | –8 | 5.10 | 118 |
| 34 | 5 | 10 | 5.22 | 393 | |
| Left | –32 | 9 | –15 | 5.26 | 202 |
| –33 | 8 | 9 | 7.95 | 86 | |
| Dorsolateral prefrontal cortex | |||||
| Right | 51 | 32 | 3 | 5.47 | 62 |
| Left | –42 | 33 | 3 | 5.78 | 85 |
| Dorsal precuneus | |||||
| Right | 18 | –43 | 66 | 5.16 | 28 |
| Left | –17 | –45 | 64 | 4.58 | 73 |
| Right mid-cingulate cortex | –8 | 8 | 46 | 3.91 | 61 |
| Posterior temporal cortex | |||||
| Right | 45 | –42 | 18 | 6.03 | 743 |
| Left | –60 | –45 | 16 | 3.81 | 65 |
| Sensorimotor cortex | –5 | –40 | 60 | 5.02 | 166 |
| Right hypothalamus | 8 | –16 | 1 | 3.85 | 30 |
Analysis of MSNA-related changes in signal intensity in OSA compared with control subjects revealed a number of brain regions in which signal intensity changes were significantly greater in OSA subjects. When bursts of spontaneous MSNA were present, signal intensity in the left and right dlPFC, medial PFC (mPFC), dorsal precuneus, anterior cingulate cortex (ACC), retrosplenial cortex and caudate nucleus increased significantly in OSA subjects, but either did not increase or decreased in controls (Fig. 3, Table 2). The mean (±SEM) percentage changes were as follows: signal intensity was higher in OSA than controls in the dlPFC (controls vs OSA: left: −0.02 ± 0.03 vs 0.10 ± 0.04, p = 0.01; right: 0.01 ± 0.03 vs 0.140 ± 0.034, p = 0.005); mPFC (left: −0.10 ± 0.04 vs 0.11 ± 0.04, p = 0.0004; right: −0.12 ± 0.04 vs 0.10 ± 0.04, p = 0.0001); ACC (−0.05 ± 0.04 vs 0.11 ± 0.03, p = 0.0005); retrosplenial cortex (left: −0.07 ± 0.05 vs 0.14 ± 0.04, p = 0.0004; right: −0.04 ± 0.04 vs 0.15 ± 0.04, p = 0.002) and in the dorsal precuneus (left: −0.08 ± 0.07 vs 0.30 ± 0.08, p = 0.001; right: −0.02 ± 0.04 vs 0.22 ± 0.04, p = 0.0001). Data are represented graphically in Fig. 4. Within the right hippocampus/parahippocampus, signal intensity decreased significantly in controls but did not change in the OSA subjects (−0.12 ± 0.03 vs 0.04 ± 0.03, p = 0.0005). In no brain region was fMRI signal intensity greater in controls compared with OSA subjects.
Fig. 3.
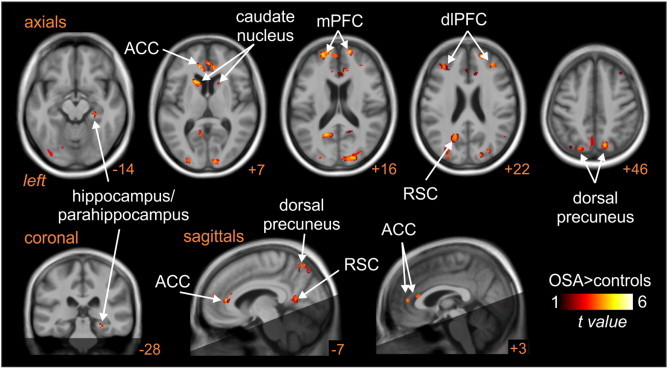
Brain regions in which BOLD signal intensity changes correlated to muscle sympathetic nerve activity (MSNA) were significantly different in controls compared with subjects with obstructive sleep apnoea (OSA). Hot colour scale indicates regions in which signal intensity changes were greater in OSA subjects compared with controls. Significant clusters are overlaid onto a T1-weighted anatomical template image. The dark shading indicates brain regions not included in the analysis. Slice location in Montreal Neurological Institute space is indicated at the lower right of each image. ACC: anterior cingulate cortex, dlPFC: dorsolateral prefrontal cortex; mPFC: medial prefrontal cortex; RSC: retrosplenial cortex.
Table 2.
Location, t-score and cluster size for regions showing significant differences in the signal intensity changes that were coupled to spontaneous muscle sympathetic nerve activity in control compared with obstructive sleep apnoea (OSA) subjects. Cluster locations are given in Montreal Neurological Institute (MNI) space.
| Brain regions |
X |
Y |
Z |
t-Score |
Cluster size |
|---|---|---|---|---|---|
| OSA > controls | |||||
| Right hippocampus/parahippocampus | 27 | –30 | –17 | 4.30 | 29 |
| Anterior cingulate cortex | –11 | 38 | 7 | 4.74 | 327 |
| Dorsolateral prefrontal cortex | |||||
| Right | 34 | 41 | 22 | 3.76 | 112 |
| Left | –33 | 36 | 21 | 3.70 | 112 |
| Medial prefrontal cortex | |||||
| Right | 21 | 53 | 21 | 4.46 | 283 |
| Left | –20 | 56 | 15 | 4.34 | 187 |
| Dorsal precuneus | |||||
| Right | 14 | –72 | 46 | 3.71 | 195 |
| Left | –11 | –70 | 57 | 3.92 | 206 |
| Retrosplenial cortex | |||||
| Right | 20 | –52 | 12 | 3.44 | 96 |
| Left | –18 | –58 | 19 | 4.01 | 352 |
| Caudate nucleus | |||||
| Right | 17 | 14 | 10 | 3.02 | 21 |
| Left | –17 | 17 | 6 | 4.29 | 106 |
Fig. 4.
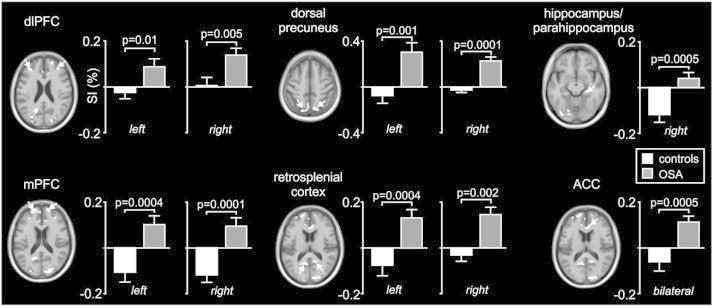
Plots of percentage change in BOLD signal intensity during periods of MSNA compared with periods of no MSNA in brain regions identified as being significantly different in subjects with obstructive sleep apnoea (OSA) compared with controls. Note that in all regions except for the hippocampus, signal intensity increased in OSA subjects (grey bars) and did not change or decreased modestly in controls (white bars). In the hippocampus, signal intensity decreased dramatically in controls and did not change in OSA subjects. ACC: anterior cingulate cortex, dlPFC: dorsolateral prefrontal cortex, mPFC: medial prefrontal cortex.
3.3. Changes in grey matter volume
Voxel-based morphomtery (VBM) revealed that OSA is associated with significant regional changes in grey matter volume (Fig. 5, Table 3). At a p < 0.05 corrected threshold, increases in grey matter volume occurred in a cluster encompassing the medulla/pons and cerebellum in OSA vs controls (probability × volume: 0.35 ± 0.006 vs 0.31 ± 0.006, p = 0.00005), as well as in the left mid-insula (0.51 ± 0.01 vs 0.48 ± 0.01, p = 0.008), right insula (0.37 ± 0.01 vs 0.35 ± 0.01, p = 0.015), right primary motor cortex (0.43 ± 0.01 vs 0.36 ± 0.01, p = 0003), left primary motor cortex (0.43 ± 0.01 vs 0.38 ± 0.01, p = 0.00006), left premotor cortex (0.43 ± 0.01 vs 0.36 ± 0.01, p = 0.0003) and left hippocampus (0.58 ± 0.02 vs 0.53 ± 0.01, p = 0.019). At a corrected statistical threshold, none of these regions displayed significantly lower grey matter volume in OSA subjects compared with controls. However, lowering the statistical threshold to an uncorrected level revealed a number of regions in which grey matter volume was lower in OSA subjects. These included the mPFC, occipital lobe, and the left and right amygdala, right posterior cingulate and left cerebellar cortices. Surprisingly, even using this lower statistical threshold, no brain region displayed both a significant difference in grey matter volume and a significant difference in MSNA-related fMRI signal intensity change in OSA compared with control subjects.
Fig. 5.
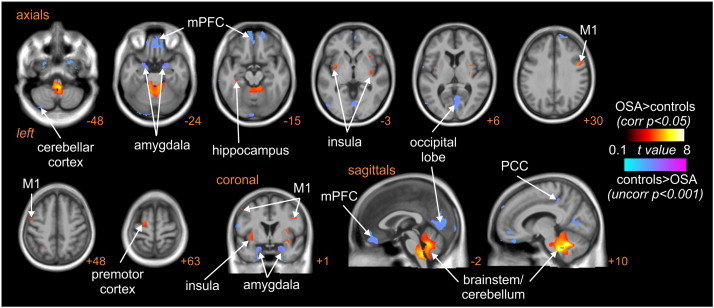
Brain regions in which grey matter volume (GM) was significantly different in subjects with obstructive sleep apnoea (OSA) compared with controls. Hot colour scale indicates increases in grey matter volume in OSA subjects compared with controls at a corrected statistical threshold (p < 0.05). Cool colour scale indicates decreases in grey matter volume in OSA subjects compared with controls at a more liberal uncorrected statistical threshold (p < 0.001). Significant clusters are overlaid onto a T1-weighted anatomical template image. Slice location in Montreal Neurological Institute space is indicated at the lower right of each image. M1: primary motor cortex; mPFC: medial prefrontal cortex; PCC: posterior cingulate cortex.
Table 3.
Location, t-score and cluster size for regions showing significant grey matter volume differences in OSA subject compared with controls. Cluster locations are given in Montreal Neurological Institute space.
| X |
Y |
Z |
t-Score |
Cluster size |
|
|---|---|---|---|---|---|
| OSA > controls (p < 0.05 corrected) | |||||
| Medulla/pons/cerebellum | 8 | –54 | –30 | 7.64 | 9412 |
| Left mid-insula | –35 | –5 | –12 | 4.95 | 419 |
| Right insula | 35 | –3 | –12 | 5.40 | 940 |
| Right primary motor cortex | 44 | 0 | 29 | 4.70 | 232 |
| Left primary motor cortex | –53 | 3 | 48 | 4.07 | 137 |
| Left hippocampus | –35 | –27 | –15 | 3.68 | 88 |
| Left premotor cortex | –20 | –8 | 66 | 4.23 | 235 |
| Controls > OSA (p < 0.005 uncorrected) | |||||
| Amygdala | |||||
| Left | –23 | 8 | –27 | 5.01 | 1210 |
| Right | 20 | 6 | –27 | 5.60 | 2290 |
| Medial prefrontal cortex | –9 | 65 | –11 | 4.05 | 3591 |
| Occipital lobe | –8 | –95 | –18 | 3.99 | 759 |
| Right posterior cingulate cortex | 9 | –36 | 45 | 3.94 | 102 |
| Left cerebellar cortex | –33 | –78 | –53 | 3.61 | 265 |
3.4. Functional and structural overlap
To confirm that those regions displaying significant functional changes in OSA did not display structural changes, we compared grey matter volumes in these regions in OSA and control subjects. Confirming the voxel-by-voxel analysis, we found no significant differences in grey matter volumes between controls and OSA subjects in any brain region: the ACC (0.49 ± 0.080 vs 0.52 ± 0.096, p = 0.08), dlPFC (0.50 ± 0.081 vs 0.51 ± 0.098, p = 0.40), left insula (0.53 ± 0.069 vs 0.54 ± 0.063, p = 0.23), right hippocampus (0.51 ± 0.057 vs 0.50 ± 0.073, p = 0.29) and right precuneus (0.47 ± 0.060 vs 0.48 ± 0.055, p = 0.35).
4. Discussion
Consistent with previous studies, we found that OSA is associated with significant increases in muscle sympathetic nerve activity (MSNA) (Carlson et al., 1993, 1996; Hedner et al., 1988, 1995; Narkiewicz et al., 1999; Somers et al., 1995; Fatouleh et al., 2014) and elevated blood pressure (Pepperell et al., 2002). Furthermore, we have previously argued, on the basis of single-unit recordings obtained in patients with OSA and in otherwise healthy obese individuals, that this elevated MSNA in OSA is largely independent of any elevated BMI (Macefield, 2012). The elevated muscle vasoconstrictor drive was associated with significant changes in signal intensity within a number of brain regions, including the dorsolateral and medial prefrontal cortices (dlPFC, mPFC), dorsal precuneus, anterior cingulate (ACC) and retrosplenial cortices, caudate nucleus as well as the right hippocampus/parahippocampus. Surprisingly, none of the regions displayed significant anatomical changes. These data suggest that the elevated muscle vasoconstrictor drive that occurs in individuals with OSA may be driven by changes in activity in higher cortical regions, possibly through influences on brainstem regulatory nuclei.
We have previously used concurrent recording of MSNA and fMRI to determine brainstem and cortical sites underlying spontaneous changes in MSNA in healthy controls (James et al., 2013). The results from the current study show similar patterns, with spontaneous bursts of MSNA associated with functional changes within the insula, dorsal precuneus, right hypothalamus, dorsolateral prefrontal, posterior temporal, mid-cingulate and sensorimotor cortices. However, in addition, a number of brain regions displayed significant activity increases or decreases during each MSNA burst in OSA subjects but not healthy controls. Within the left and right mPFC, dlPFC, dorsal precuneus, ACC, retrosplenial cortex and caudate nucleus, signal intensity increased significantly during each MSNA burst in OSA subjects but not in controls. In contrast, within the right hippocampus and parahippocampus, signal intensity decreased significantly during each MSNA burst in healthy controls, but did not change in OSA subjects. Thus, the MSNA-related neural activity in higher brain regions differs in OSA patients relative to controls.
A number of investigations have explored the neural basis of evoked changes in blood pressure and heart rate in both controls and OSA subjects during cardiorespiratory challenges such as the Valsalva manoeuvre, cold pressor test, sustained hand grip and inspiratory and expiratory loading (Harper et al., 2003, 2012; Macey et al., 2003, 2013). In general, these studies have shown that OSA subjects display aberrant cardiovascular responses which are associated with altered activity in regions such as the hypothalamus, amygdala, hippocampus, and insular, cingulate and prefrontal cortices (Harper et al., 2003; Henderson et al., 2003; Woo et al., 2005, 2007). Furthermore, many of these areas of altered function overlapped with regions of grey matter loss (Macey et al., 2003, 2006). Although these previous studies are valuable, the brain activation patterns evoked during such challenges are complicated by behavioural changes, including alterations in motor drive, volution, sensory input and cognition. In contrast, we determined the activation patterns associated with spontaneous bursts of MSNA while the subject was relaxed and at rest, i.e. in the absence of any manoeuvre.
We found an increase in signal intensity in mPFC, which covaried with MSNA, in OSA subjects. The mPFC is known to send projections to specific nuclei in the brainstem related to control of muscle sympathetic outflow, such as the nucleus tractus solitarius (NTS) and rostral ventrolateral medulla (RVLM) (Sica et al., 2000a; Weisz et al., 2001). Although mPFC lesions do not affect resting mean blood pressure and heart rate, they do reduce baroreceptor reflex gain (Verberne et al., 1987). Baroreceptor sensitivity is reduced in OSA (Carlson et al., 1996; Ryan et al., 2007), but this reduction is unrelated to the overall increase in muscle sympathetic outflow (Carlson et al., 1993). Furthermore, electrical stimulation of the mPFC reduces the discharge of sympathoexcitatory neurons in RVLM, and microinjection of glutamate into the mPFC reduces sympathetic vasoconstrictor drive and blood pressure (Verberne, 1996). Moreover, an animal model of OSA, the chronic intermittent hypoxia (CIH) model, is associated with a sustained increase in sympathetic vasoconstrictor drive and increased c-fos expression in mPFC, implicating this structure in the sympathoexcitation (Sica et al., 2000b). It is likely that any changes in mPFC operate via changes in RVLM, which in turn result in increased spontaneous MSNA.
In addition to the functional changes in mPFC, OSA subjects displayed MSNA-related changes in other cortical areas which differed from healthy controls, including the precuneus, retrosplenial cortex and dlPFC. Although cardiovascular- related function of the precuneus has received little attention, we have previously shown that this region, along with the dlPFC, displays MSNA-related activity (James et al., 2013). Furthermore, precuneus activity declines during deep sleep (Maquet, 2000), when MSNA and blood pressure also fall, suggesting that this region provides a resting drive to MSNA during wakefulness. Moreover, the precuneus and dlPFC are functionally coupled to the RVLM at rest in healthy controls, which suggests that the activity within these cortical regions can influence activity within the RVLM (James et al., 2013).
Unlike the precuneus, there is considerable interest in the role of the ACC in sympathetic control (Beissner et al., 2013; Critchley et al., 2003; Kimmerly et al., 2013). Pyramidal neurons within the ACC project directly and indirectly to subcortical brain regions associated with homeostasis and autonomic control, including the hypothalamus (Ongür et al., 1998). Electrical stimulation of the ACC in experimental animals evokes autonomic responses affecting heart rate and blood pressure (Ward, 1948) and in humans, ACC stimulation causes prompt and usually complete arrest of respiration, bradycardia and a gradual increase in blood pressure (Pool & Ransohoff, 1949). In addition, in humans, ACC lesions are associated with disrupted sympathetic cardiovascular regulation and impaired generation of cardiovascular arousals during cognitive efforts (Critchley et al., 2003). Furthermore, it has been shown during manoeuvres that evoke significant increases in blood pressure and heart rate that OSA subjects display aberrant cardiovascular responses that are associated with altered activity changes in regions that include the ACC and retrosplenial cortex (Macey et al., 2013; Harper et al., 2003). In experimental animals, 30 days of CIH exposure evokes c-fos expression in the cingulate cortex (Sica et al., 2000b). Consistent with our findings, orthostatic stressors, such as lower-body negative pressure, and inspiratory-capacity apnoea, which unload baroreceptors and increase MSNA, are associated with increased ACC signal activity (Goswami et al., 2012; Macefield et al., 2006), and heart rate variability is associated with changes in activity within both the ACC and retrosplenial cortex (Critchley et al., 2003). The combined evidence demonstrates a key role for the ACC and retrosplenial cortex in the autonomic circuitry, and hence the present findings of altered activity in OSA raise the possibility that dysfunction in these brain regions contributes to the sympathoexcitation in OSA.
In contrast to the regional differences described above, within the hippocampus/parahippocampus subjects with OSA displayed no signal intensity changes that covaried with MSNA, whereas controls displayed decreases in signal intensity. The hippocampus contains neurons that discharge with the respiratory and cardiac cycles, and electrical stimulation within the hippocampus evokes dramatic changes in blood pressure (Harper et al., 2013). Moreover, direct chemical stimulation of the hippocampus evokes marked decreases in arterial pressure and heart rate (Ruit & Neafsey, 1988). It has been suggested that this brain region may play a modulatory role, as hippocampal blockade in animals does not affect resting arterial pressure and heart rate (Wang & Ingenito, 1992). During the cold-pressor test, OSA and control subjects showed significant differences in heart rate and respiratory responses, which supports the reduced modulatory role of the hippocampus in OSA (Harper et al., 2003; Macey et al., 2013).
Strikingly, we found no voxels displaying both an MSNA-related difference in signal intensity in OSA and a significant change in grey matter volume. This finding was unexpected, since numerous investigations, including this study, have shown that OSA is associated with significant changes in grey matter volume in areas involved in autonomic control, which in theory would be expected to affect the normal functioning of those structures. Our OSA subjects displayed increases in grey matter volume in the medulla/pons and cerebellum, left mid-insula, right insula, bilateral primary motor cortex, left premotor cortex and left hippocampus, with decreases in the mPFC, occipital lobe, and left and right amygdala. Previous studies have revealed changes in grey matter volume in areas such as the hippocampus, parahippocampal gyrus, fronto-parietal cortices, temporal lobe, anterior cingulate and cerebellum (Joo et al., 2010; Macey et al., 2008; Torelli et al., 2011; Zimmerman & Aloia, 2006). Given the presumed detrimental effects of hypoxia on brain structure, we hypothesised that changes in MSNA-related brain activity in OSA would be associated with changes in grey matter volume resulting from hypoxi-related damage. However, our data strongly suggests that cortical changes in signal intensity associated with increased MSNA do not result from localized structural changes that may occur as a result of the repeated hypoxic events that occur in individuals with OSA.
5. Conclusions
Using concurrent microneurography and fMRI we have shown, for the first time, that the elevated levels of spontaneous muscle sympathetic nerve activity seen in subjects with obstructive sleep apnoea are related to functional changes in the activity of several discrete cortical and subcortical regions. Moreover, that these functional changes did not match the structural changes indicates that the increase in MSNA in OSA may well be independent of the loss of grey matter associated with OSA. These findings are bringing us closer to understanding how increases in MSNA are brought about in OSA, but we do need to know how the nocturnal episodes of hypoxemia translate into the changes we observe and to understand what happens to the brain following treatment. Indeed, it remains to be seen whether these functional and structural changes can be reversed by treatment with continuous positive airway pressure. Nevertheless, we are confident that the provision of this mechanistic data may lead to the development of novel treatment strategies to improve the health of patients with OSA.
Acknowledgements
This work was supported by the National Health & Research Council of Australia (project grant 1007557).
References
- Ashburner J., Friston K.J. Voxel-based morphometry — the methods. Neuroimage. 2000;11:805–821. doi: 10.1006/nimg.2000.0582. 10860804 [DOI] [PubMed] [Google Scholar]
- Ashburner J., Friston K.J. Unified segmentation. Neuroimage. 2005;26:839–851. doi: 10.1016/j.neuroimage.2005.02.018. 15955494 [DOI] [PubMed] [Google Scholar]
- Beissner F., Meissner K., Bär K.-J., Napadow V. The autonomic brain: an activation likelihood estimation meta-analysis for central processing of autonomic function. Journal of Neuroscience: the Official Journal of the Society for Neuroscience. 2013;33:10503–10511. doi: 10.1523/JNEUROSCI.1103-13.2013. 23785162 [DOI] [PMC free article] [PubMed] [Google Scholar]
- Canessa N., Castronovo V., Cappa S.F., Aloia M.S., Marelli S., Falini A., Alemanno F., Ferini-Strambi L. Obstructive sleep apnea: brain structural changes and neurocognitive function before and after treatment. American Journal of Respiratory and Critical Care Medicine. 2011;183:1419–1426. doi: 10.1164/rccm.201005-0693OC. 21037021 [DOI] [PubMed] [Google Scholar]
- Carlson J.T., Hedner J.A., Sellgren J., Elam M., Wallin B.G. Depressed baroreflex sensitivity in patients with obstructive sleep apnea. American Journal of Respiratory and Critical Care Medicine. 1996;154:1490–1496. doi: 10.1164/ajrccm.154.5.8912770. 8912770 [DOI] [PubMed] [Google Scholar]
- Carlson J.T., Hedner J., Elam M., Ejnell H., Sellgren J., Wallin B.G. Augmented resting sympathetic activity in awake patients with obstructive sleep apnea. Chest. 1993;103:1763–1768. doi: 10.1378/chest.103.6.1763. 8404098 [DOI] [PubMed] [Google Scholar]
- Critchley H.D., Mathias C.J., Josephs O., O'Doherty J., Zanini S., Dewar B.K., Cipolotti L, Shallice T, Dolan R.J. Human cingulate cortex and autonomic control: converging neuroimaging and clinical evidence. Brain: A Journal of Neurology. 2003;126:2139–2152. doi: 10.1093/brain/awg216. 12821513 [DOI] [PubMed] [Google Scholar]
- Elam M., McKenzie D., Macefield V. Mechanisms of sympatho-excitation: single-unit analysis of muscle vasoconstrictor neurons in awake OSAS subjects. Journal of Applied Physiology. 2002;93:297–303. doi: 10.1152/japplphysiol.00899.2001. [DOI] [PubMed] [Google Scholar]
- Fatouleh R., McKenzie D.K., Macefield V.G. Respiratory modulation of muscle sympathetic nerve activity in obstructive sleep apnoea. Experimental Physiology. 2014 doi: 10.1113/expphysiol.2013.077511. 24887112 In press. [DOI] [PubMed] [Google Scholar]
- Friston K.J., Holmes A.P., Poline J.B., Grasby P.J., Williams S.C., Frackowiak R.S., Turner R. Analysis of fMRI time-series revisited. Neuroimage. 1995;2:45–53. doi: 10.1006/nimg.1995.1007. 9343589 [DOI] [PubMed] [Google Scholar]
- Goswami R., Frances M.F., Steinback C.D., Shoemaker J.K. Forebrain organization representing baroreceptor gating of somatosensory afferents within the cortical autonomic network. Journal of Neurophysiology. 2012;108:453–466. doi: 10.1152/jn.00764.2011. 22514285 [DOI] [PubMed] [Google Scholar]
- Harper R.M., Kumar R., Macey P.M., Ogren J.A., Richardson H.L. Functional neuroanatomy and sleep-disordered breathing: implications for autonomic regulation. Anatomical Record (Hoboken, N.J.: 2007) 2012;295:1385–1395. doi: 10.1002/ar.22514. 22851218 [DOI] [PubMed] [Google Scholar]
- Harper R.M., Kumar R., Ogren J.A., Macey P.M. Sleep-disordered breathing: effects on brain structure and function. Respiratory Physiology & Neurobiology. 2013;188:383–391. doi: 10.1016/j.resp.2013.04.021. 23643610 [DOI] [PMC free article] [PubMed] [Google Scholar]
- Harper R.M., Macey P.M., Henderson L.A., Woo M.A., Macey K.E., Frysinger R.C., Alger J.R., Nguyen K.P., Yan-Go F.L. fMRI responses to cold pressor challenges in control and obstructive sleep apnea subjects. Journal of Applied Physiology (Bethesda, Md.: 1985) 2003;94:1583–1595. doi: 10.1152/japplphysiol.00881.2002. 12514164 [DOI] [PubMed] [Google Scholar]
- Hedner J., Darpö B., Ejnell H., Carlson J., Caidahl K. Reduction in sympathetic activity after long-term CPAP treatment in sleep apnoea: cardiovascular implications. European Respiratory Journal. 1995;8:222–229. doi: 10.1183/09031936.95.08020222. 7758555 [DOI] [PubMed] [Google Scholar]
- Hedner J., Ejnell H., Sellgren J., Hedner T., Wallin G. Is high and fluctuating muscle nerve sympathetic activity in the sleep apnoea syndrome of pathogenetic importance for the development of hypertension? Journal of Hypertension. Supplement: Official Journal of the International Society of Hypertension. 1988;6:S529–S531. doi: 10.1097/00004872-198812040-00166. 3241251 [DOI] [PubMed] [Google Scholar]
- Henderson L.A., Woo M.A., Macey P.M., Macey K.E., Frysinger R.C., Alger J.R., Yan-Go F., Harper R.M. Neural responses during valsalva maneuvers in obstructive sleep apnea syndrome. Journal of Applied Physiology (Bethesda, Md.: 1985) 2003;94:1063–1074. doi: 10.1152/japplphysiol.00702.2002. 12433858 [DOI] [PubMed] [Google Scholar]
- Imadojemu V.A., Mawji Z., Kunselman A., Gray K.S., Hogeman C.S., Leuenberger U.A. Sympathetic chemoreflex responses in obstructive sleep apnea and effects of continuous positive airway pressure therapy. Chest. 2007;131:1406–1413. doi: 10.1378/chest.06-2580. [DOI] [PubMed] [Google Scholar]
- James C., Macefield V.G., Henderson L.A. Real-time imaging of cortical and subcortical control of muscle sympathetic nerve activity in awake human subjects. Neuroimage. 2013;70:59–65. doi: 10.1016/j.neuroimage.2012.12.047. 23287526 [DOI] [PubMed] [Google Scholar]
- Joo E.Y., Jeon S., Kim S.T., Lee J.M., Hong S.B. Localized cortical thinning in patients with obstructive sleep apnea syndrome. Sleep. 2013;36:1153–1162. doi: 10.5665/sleep.2876. 23904675 [DOI] [PMC free article] [PubMed] [Google Scholar]
- Joo E.Y., Tae W.S., Lee M.J., Kang J.W., Park H.S., Lee J.Y., Suh M., Hong S.B. Reduced brain gray matter concentration in patients with obstructive sleep apnea syndrome. Sleep. 2010;33:235–241. doi: 10.1093/sleep/33.2.235. 20175407 [DOI] [PMC free article] [PubMed] [Google Scholar]
- Kimmerly D.S., Morris B.L., Floras J.S. Apnea-induced cortical BOLD-fMRI and peripheral sympathoneural firing response patterns of awake healthy humans. PloS One. 2013;8:e82525. doi: 10.1371/journal.pone.0082525. 24358198 [DOI] [PMC free article] [PubMed] [Google Scholar]
- Lanfranchi P., Somers V.K. Obstructive sleep apnea and vascular disease. Respiratory Research. 2001;2:315–319. doi: 10.1186/rr79. 11737928 [DOI] [PMC free article] [PubMed] [Google Scholar]
- Macefield V.G. Firing patterns of muscle vasoconstrictor neurons in respiratory disease. Frontiers in Physiology. 2012;3:153. doi: 10.3389/fphys.2012.00153. 22654767 [DOI] [PMC free article] [PubMed] [Google Scholar]
- Macefield V.G., Gandevia S.C., Henderson L.A. Neural sites involved in the sustained increase in muscle sympathetic nerve activity induced by inspiratory capacity apnea: a fMRI study. Journal of Applied Physiology (Bethesda, Md.: 1985) 2006;100:266–273. doi: 10.1152/japplphysiol.00588.2005. 16123207 [DOI] [PubMed] [Google Scholar]
- Macefield V.G., Henderson L.A. Real-time imaging of the medullary circuitry involved in the generation of spontaneous muscle sympathetic nerve activity in awake subjects. Human Brain Mapping. 2010;31:539–549. doi: 10.1002/hbm.20885. 19777579 [DOI] [PMC free article] [PubMed] [Google Scholar]
- Macey K.E., Macey P.M., Woo M.A., Henderson L.A., Frysinger R.C., Harper R.K., Alger J.R., Yan-Go F., Harper R.M. Inspiratory loading elicits aberrant fMRI signal changes in obstructive sleep apnea. Respiratory Physiology & Neurobiology. 2006;151:44–60. doi: 10.1016/j.resp.2005.05.024. 15993658 [DOI] [PubMed] [Google Scholar]
- Macey P.M., Henderson L.A., Macey K.E., Alger J.R., Frysinger R.C., Woo M.A., Harper R.K., Yan-Go F.L., Harper R.M. Brain morphology associated with obstructive sleep apnea. American Journal of Respiratory and Critical Care Medicine. 2002;166:1382–1387. doi: 10.1164/rccm.200201-050OC. 12421746 [DOI] [PubMed] [Google Scholar]
- Macey P.M., Kumar R., Woo M.A., Valladares E.M., Yan-Go F.L., Harper R.M. Brain structural changes in obstructive sleep apnea. Sleep. 2008;31:967–977. 18652092 [PMC free article] [PubMed] [Google Scholar]
- Macey P.M., Kumar R., Woo M.A., Yan-Go F.L., Harper R.M. Heart rate responses to autonomic challenges in obstructive sleep apnea. PloS One. 2013;8:e76631. doi: 10.1371/journal.pone.0076631. 24194842 [DOI] [PMC free article] [PubMed] [Google Scholar]
- Macey P.M., Macey K.E., Henderson L.A., Alger J.R., Frysinger R.C., Woo M.A., Yan-Go F, Harper R.M. Functional magnetic resonance imaging responses to expiratory loading in obstructive sleep apnea. Respiratory Physiology & Neurobiology. 2003;138:275–290. doi: 10.1016/j.resp.2003.09.002. 14609516 [DOI] [PubMed] [Google Scholar]
- Maquet P. Functional neuroimaging of normal human sleep by positron emission tomography. Journal of Sleep Research. 2000;9:207–231. doi: 10.1046/j.1365-2869.2000.00214.x. 11012860 [DOI] [PubMed] [Google Scholar]
- Morrell M.J., Jackson M.L., Twigg G.L., Ghiassi R., McRobbie D.W., Quest R.A., Pardoe H., Pell G.S., Abbott D.F., Rochford P.D., Jackson G.D., Pierce R.J., O’Donoghue F.J., Corfield D.R. Changes in brain morphology in patients with obstructive sleep apnoea. Thorax. 2010;65:908–914. doi: 10.1136/thx.2009.126730. 20861295 [DOI] [PubMed] [Google Scholar]
- Narkiewicz K., Pesek C.A., Kato M., Phillips B.G., Davison D.E., Somers V.K. Baroreflexcontrol of sympathetic nerve activity and heart rate in obstructive sleep apnea. Hypertension. 1998;32:1039–1043. doi: 10.1161/01.hyp.32.6.1039. [DOI] [PubMed] [Google Scholar]
- Narkiewicz K., van de Borne P.J.H., Pesek C.A., Dyken M.E., Montano N., Somers V.K. Selective potentiation of peripheral chemoreflex sensitivity in obstructive sleep apnea. Circulation. 1999;99:1183–1189. doi: 10.1161/01.cir.99.9.1183. 10069786 [DOI] [PubMed] [Google Scholar]
- Narkiewicz K., Somers V.K. Sympathetic nerve activity in obstructive sleep apnoea. Acta Physiologica Scandinavica. 2003;177:385–390. doi: 10.1046/j.1365-201X.2003.01091.x. [DOI] [PubMed] [Google Scholar]
- Nieto F.J., Young T.B., Lind B.K., Shahar E., Samet J.M., Redline S., D'Agostino R.B., Newman A.B., Lebowitz M.D., Pickering T.G. Association of sleep-disordered breathing, sleep apnea, and hypertension in a large community-based study. Sleep Heart Health Study. JAMA: the Journal of the American Medical Association. 2000;283:1829–1836. doi: 10.1001/jama.283.14.1829. 10770144 [DOI] [PubMed] [Google Scholar]
- Ongür D., An X., Price J.L. Prefrontal cortical projections to the hypothalamus in macaque monkeys. The Journal of Comparative Neurology. 1998;401:480–505. 9826274 [PubMed] [Google Scholar]
- Peppard P.E., Young T., Palta M., Skatrud J. Prospective study of the association between sleep-disordered breathing and hypertension. New England Journal of Medicine. 2000;342:1378–1384. doi: 10.1056/NEJM200005113421901. 10805822 [DOI] [PubMed] [Google Scholar]
- Pepperell J.C., Ramdassingh-Dow S., Crosthwaite N., Mullins R., Jenkinson C., Stradling J.R., Davies R.J. Ambulatory blood pressure after therapeutic and subtherapeutic nasal continuous positive airway pressure for obstructive sleep apnoea: a randomised parallel trial. Lancet. 2002;359:204–210. doi: 10.1016/S0140-6736(02)07445-7. 11812555 [DOI] [PubMed] [Google Scholar]
- Pool J.L., Ransohoff J. Autonomic effects on stimulating rostral portion of cingulate gyri in Man. Journal of Neurophysiology. 1949;12:385–392. doi: 10.1152/jn.1949.12.6.385. 15408005 [DOI] [PubMed] [Google Scholar]
- Ruit K.G., Neafsey E.J. Cardiovascular and respiratory responses to electrical and chemical stimulation of the hippocampus in anesthetized and awake rats. Brain Research. 1988;457:310–321. doi: 10.1016/0006-8993(88)90701-9. 2905918 [DOI] [PubMed] [Google Scholar]
- Ryan S., Ward S., Heneghan C., McNicholas W.T. Predictors of decreased spontaneous baroreflex sensitivity in obstructive sleep apnea syndrome. Chest. 2007;131:1100–1107. doi: 10.1378/chest.06-2165. 17426215 [DOI] [PubMed] [Google Scholar]
- Sica A.L., Greenberg H.E., Ruggiero D.A., Scharf S.M. Chronic-intermittent hypoxia: a model of sympathetic activation in the rat. Respiration Physiology. 2000;121:173–184. doi: 10.1016/s0034-5687(00)00126-2. 10963773 [DOI] [PubMed] [Google Scholar]
- Sica A.L., Greenberg H.E., Scharf S.M., Ruggiero D.A. Immediate-early gene expression in cerebral cortex following exposure to chronic-intermittent hypoxia. Brain Research. 2000;870:204–210. doi: 10.1016/s0006-8993(00)02170-3. 10869520 [DOI] [PubMed] [Google Scholar]
- Somers V.K., Dyken M.E., Clary M.P., Abboud F.M. Sympathetic neural mechanisms in obstructive sleep apnea. Journal of Clinical Investigation. 1995;96:1897–1904. doi: 10.1172/JCI118235. 7560081 [DOI] [PMC free article] [PubMed] [Google Scholar]
- Torelli F., Moscufo N., Garreffa G., Placidi F., Romigi A., Zannino S., Bozzali M., Fasano F., Giulietti G., Djonlagic I., Malhotra A., Marciani M.G., Guttmann C.R. Cognitive profile and brain morphological changes in obstructive sleep apnea. Neuroimage. 2011;54:787–793. doi: 10.1016/j.neuroimage.2010.09.065. 20888921 [DOI] [PMC free article] [PubMed] [Google Scholar]
- Verberne A.J. Medullary sympathoexcitatory neurons are inhibited by activation of the medial prefrontal cortex in the rat. American Journal of Physiology. 1996;270:R713–R719. doi: 10.1152/ajpregu.1996.270.4.R713. 8967398 [DOI] [PubMed] [Google Scholar]
- Verberne A.J., Lewis S.J., Worland P.J., Beart P.M., Jarrott B., Christie M.J., Louis W.J. Medial prefrontal cortical lesions modulate baroreflex sensitivity in the rat. Brain Research. 1987;426:243–249. doi: 10.1016/0006-8993(87)90878-x. 3319045 [DOI] [PubMed] [Google Scholar]
- Wang J.Q., Ingenito A.J. Centrally mediated cardiovascular actions of dynorphin A(1-8) on rat hippocampal formation. Journal of Pharmacology and Experimental Therapeutics. 1992;261:678–685. 1349645 [PubMed] [Google Scholar]
- Ward A.A. The cingular gyrus, area 24. Journal of neurophysiology. 1948;11:13–23. doi: 10.1152/jn.1948.11.1.13. 18921401 [DOI] [PubMed] [Google Scholar]
- Weisz J., Emri M., Fent J., Lengyel Z., Márián T., Horváth G., Bogner P., Trón L., Adám G. Right prefrontal activation produced by arterial baroreceptor stimulation: a PET study. Neuroreport. 2001;12:3233–3238. doi: 10.1097/00001756-200110290-00018. 11711862 [DOI] [PubMed] [Google Scholar]
- Woo M.A., Macey P.M., Keens P.T., Kumar R., Fonarow G.C., Hamilton M.A., Harper R.M. Functional abnormalities in brain areas that mediate autonomic nervous system control in advanced heart failure. Journal of Cardiac Failure. 2005;11:437–446. doi: 10.1016/j.cardfail.2005.02.003. 16105635 [DOI] [PubMed] [Google Scholar]
- Woo M.A., Macey P.M., Keens P.T., Kumar R., Fonarow G.C., Hamilton M.A., Harper R.M. Aberrant central nervous system responses to the valsalva maneuver in heart failure. Congestive Heart Failure (Greenwich, Conn.) 2007;13:29–35. doi: 10.1111/j.1527-5299.2007.05856.x. 17272960 [DOI] [PubMed] [Google Scholar]
- Zimmerman M.E., Aloia M.S. A review of neuroimaging in obstructive sleep apnea. Journal of Clinical Sleep Medicine: JCSM: Official Publication of the American Academy of Sleep Medicine. 2006;2:461–471. 17557478 [PubMed] [Google Scholar]