Abstract
Background:
India's National Family Welfare Programme is dominated by sterilization, particularly tubectomy. Sterilization, being a terminal method of contraception, decides the final number of children for that couple. Many studies have shown the declining trend in the average number of living children at the time of sterilization over a short period of time. So this study was planned to do time series analysis of the average children at the time of terminal contraception, to do forecasting till 2020 for the same and to compare the rates of change in various subgroups of the population.
Materials and Methods:
Data was preprocessed in MS Access 2007 by creating and running SQL queries. After testing stationarity of every series with augmented Dickey-Fuller test, time series analysis and forecasting was done using best-fit Box-Jenkins ARIMA (p, d, q) nonseasonal model. To compare the rates of change of average children in various subgroups, at sterilization, analysis of covariance (ANCOVA) was applied.
Results:
Forecasting showed that the replacement level of 2.1 total fertility rate (TFR) will be achieved in 2018 for couples opting for sterilization. The same will be achieved in 2020, 2016, 2018, and 2019 for rural area, urban area, Hindu couples, and Buddhist couples, respectively. It will not be achieved till 2020 in Muslim couples.
Conclusion:
Every stratum of population showed the declining trend. The decline for male children and in rural area was significantly faster than the decline for female children and in urban area, respectively. The decline was not significantly different in Hindu, Muslim, and Buddhist couples.
Keywords: Demography, family size at sterilization, sterilization, time series
Introduction
India was the first country to launch National Family Planning Programme in 1952 and adopt National population policy. The program was renamed as National Family Welfare Programme in 1979. Since its launch a lot of efforts were made to reduce birth rates and stabilize the population. In India, the family planning services are mainly concentrated on preventing births rather than improving other factors. Secondly, birth prevention services are dominated by sterilization operations, particularly tubectomy. National Family Health Survey (NFHS)-3 Maharashtra data shows that 66.9% eligible couples were using any method of contraception, of that 51.1 % was contributed by female sterilization and 15.8% contribution was of other methods such as vasectomy, intrauterine devices (IUDs), pills, condoms, and traditional methods.(1) Corresponding figures for India were 56.3% for contraception by any method, 37.3% for tubectomy, and 19% for other methods.(2)
Sterilization, being a terminal method of contraception, decides the final number of children for that couple. So in India, whose National Family Welfare Programme is largely dominated by sterilizations, number of living children at the time of sterilization procedure is the one of the major determinants of fertility rates. Many studies have shown the declining trend in the average number of living children at the time of sterilization over a short-term period.(3,4,5) But no study has done long-term time series analysis and had done forecasting for the same. Also, no study has compared the rates of decline of the same in various strata of the population. So this study was conducted with following aims.
Aims
To study the trends of average number of living children at the time of terminal contraception from 1986 to 2012.
To do time series analysis of the same using ARIMA (p, d, q) nonseasonal model.
To do forecasting till 2020 for the average number of living children at the time of terminal contraception using best-fit ARIMA (p, d, q) model.
To compare the rates of change of average number of living children at the time of terminal contraception in various subgroups/strata of the population.
Materials and Methods
The study was conducted at Civil Hospital, Nashik (urban area) and Primary Health Centre, Mohadi (rural area). Operational feasibility was the sole purpose of selecting these centers.
Data collection
All the terminal contraception operations conducted in these centers from 1986 to 2012 were included in the study. R3 registers in these centers for the corresponding years were used for data generation (secondary data). Relevant information of the individual who underwent these procedures was recorded in a Microsoft Access 2007 sheet.
Year-wise average numbers of living children at the time of terminal contraception were calculated by creating and running SQL queries in MS Access. Similarly, year-wise and then area-wise and religion-wise average number of children at the time of terminal contraception were calculated. Thus, time series data corresponding to all these parameters was constructed. This preprocessed data was then imported in Statistical Package for Social Sciences (SPSS)-16 and statistical analysis was done.
Statistical analysis
Every series was tested for the stationarity using augmented Dickey-Fuller test for unit root.(6) Box-Jenkins ARIMA (p, d, q); autoregressive integrated moving averages; nonseasonal models were used for the analysis. If the series was found to be nonstationary, as interpreted by augmented Dickey-Fuller test, the series was analyzed with d ≥ 1.
Results of the different models were compared using fit measures like R-square, stationary R-square, mean absolute percentage error, maximum absolute percentage error, and normalized Bayesian Information Criteria. Using these parameters, best-fit model was identified for each group. The best-fit model was confirmed using expert modeler in SPSS. Adequacy of the best-fit model was tested by examining autocorrelation function of the residuals. Ljung-Box test statistics was used for the same. The model was ignored, if the Ljung-Box Q statistics gave significant P-value. The best-fit ARIMA (p, d, q) model was used to forecast the average number of children at the time of terminal contraception in each group, till 2020.
Analysis of covariance (ANCOVA) was used to test whether trends in average children at the time of contraception were significantly different in various subgroups. Generalized linear models for each subgroup were developed to test two different hypotheses. First, whether the slopes of the lines were significantly different (whether the rates of change of average number living of children at the time of contraception in various subgroups were significantly different). If not, second hypothesis was tested-whether the Y-intercepts of the lines were significantly different.(7)
Results
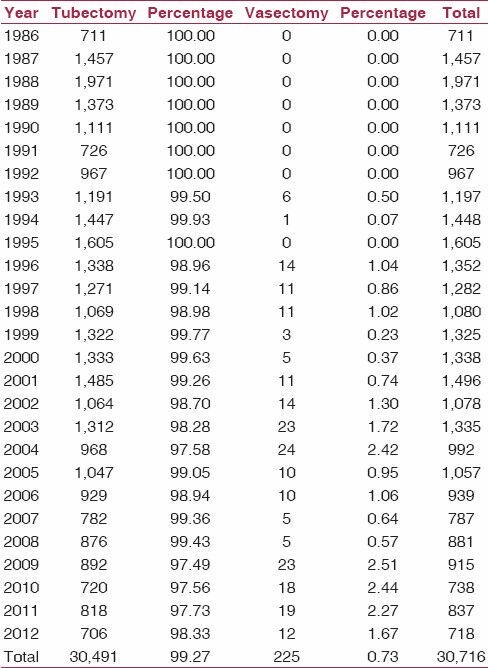
A total of 30,716 procedures were done during 1986-2012, of these 30,491 (99.27%) were tubectomies and only 225 (0.73%) were vasectomies [Table 1].
Table 1.
Year-wise tubectomy and vasectomy procedures from 1986 to 2012
The mean number of total living children per couple at the time of terminal contraception decreased from 3.42 ± 1.05 in 1986 to 2.35 ± 0.71 in 2012 [Table 2 and Figure 1]. Similarly [Figures 2 and 3] shows the sex-wise, area-wise, and religion-wise average living children at the time of terminal contraception, respectively.
Table 2.
Year-wise average number of living children per couple at the time of terminal contraception
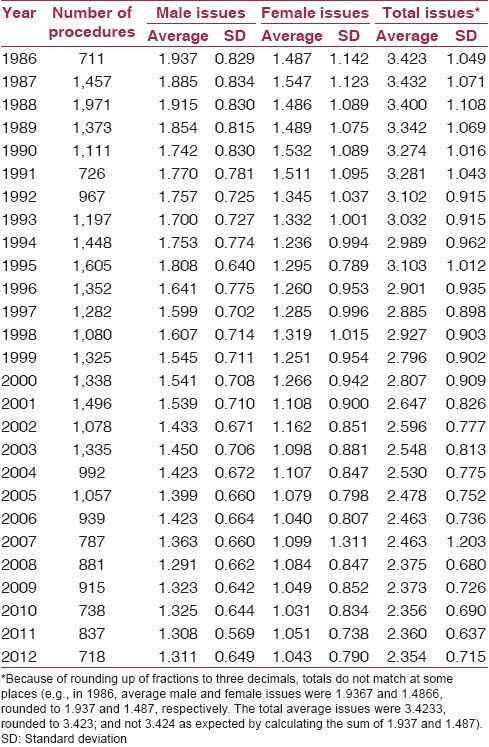
Figure 1.
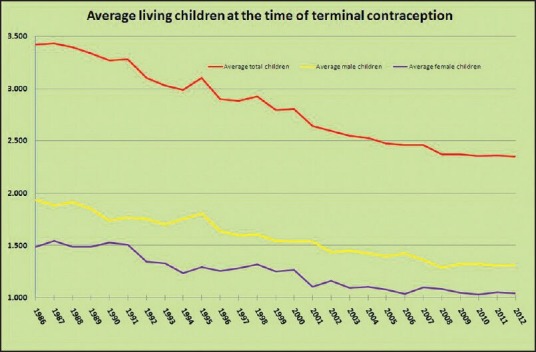
Average living children at the time of sterilization, from 1986 to 2012
Figure 2.
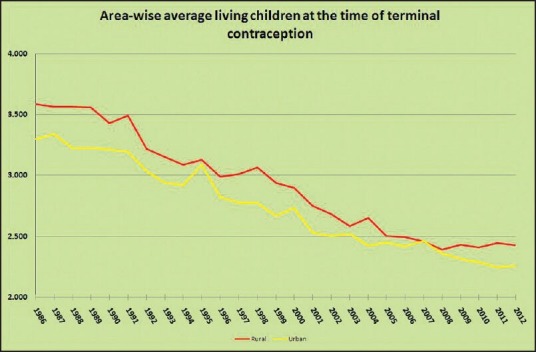
Urban- and rural-wise average living children at the time of sterilization, from 1986 to 2012
Figure 3.
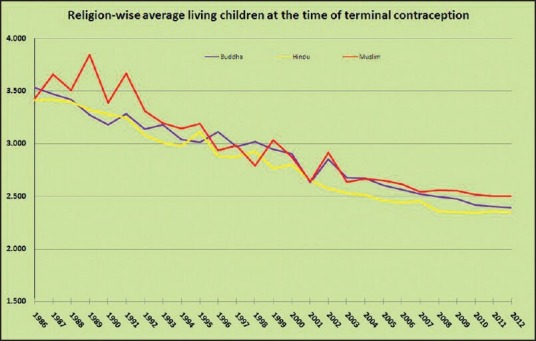
Religion-wise average living children at the time of sterilization, from 1986 to 2012
Augmented Dickey-Fuller test for unit root showed that all of these time series were nonstationary [Table 3]. So it was decided that every time series needed differencing and ARIMA (p, d, q) analysis was done with d ≥ 1. Table 4 shows the best-fit model selected using ARIMA (p, d, q) and corresponding model fit parameters. Table 4 also shows the Ljung-Box Q statistics and its P-value. The model for predicting average male children was having significant P-value as shown by the Ljung-Box Q statistics, so it was ignored and not used for forecasting. In other groups, forecasting was done using the best model selected till 2020.
Table 3.
Results of the augmented Dickey-Fuller (ADF) test
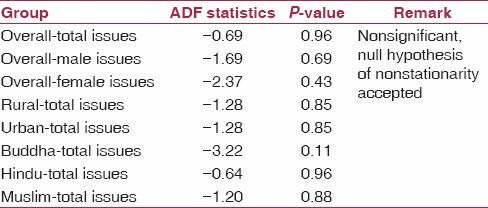
Table 4.
Best-fit models and their model-fit parameters

It can be concluded, that the replacement level of 2.1 children per couple can be achieved in 2018, for couple opting for terminal contraception. The same will be achieved in 2020 for rural area and in 2016 for urban area. For Hindu and Buddhist couples, the same will be achieved in 2018 and 2019, respectively. For Muslim couples, the forecasting has shown that, it will not be achieved till 2020 [Table 5].
Table 5.
Year-wise forecasts for average number of living children at the time of terminal contraception, provided by the best-fit ARIMA models

To test the difference in the rates of change of average living children at the time of terminal contraception in various subgroups, ANCOVA test was applied, assuming mean children as dependent variable and year as a covariate. It showed that the slopes of best-fit linear lines for average male and female children were significantly different. It also showed the significant difference in slopes for average total children in rural and urban area. But it showed that there was no significant difference in the slopes of the lines corresponding to three different religions. In other words it can be concluded that the decline in average number of males was faster than that for average number of females over the study period of 1986-2012. Similarly, decline in average number of total children in rural area was faster than that in urban area. But religion-wise decline was the same.
Second hypothesis in ANCOVA applied for religion-wise data showed the significant difference in the Y-intercepts. Post hoc test with Bonferroni correction showed the significant difference in Y-intercepts of all three religions. Corresponding P-values were 0.008, 0.022, and <0.001 for Hindu-Buddhist, Buddhist-Muslim, and Hindu-Muslim, respectively. Thus, we can conclude that though the rates of decline in these religions were same, there is significant difference in the average number of children at the time of terminal contraception in these religions [Table 6].
Table 6.
Results of analysis of variance (ANCOVA)

Proportion of couples opting for terminal contraception without a male child increased from 2.10% in 1986 to 5.15% in 2012. This proportion for couples without a female child ranged between 15.80 in 1989 and 26.42% in 2012.
Though the Muslim population in the study area was approximately 20%, the sterilizations by Muslim couples were only 4.37%.
Average age of women at tubectomy remained somewhat constant in this time series, ranging from 26.34 to 28.62 years.
Discussion
This time series analysis was conducted to forecast the average number of living children at the time of terminal contraception till 2020. The differences in trends in various subgroups were also studied in this analysis.
This study has proved the overwhelming contribution of tubectomy (99.27%) in sterilization. Male sterilization, that is, vasectomy only contributed for 0.73% of the total sterilizations. The proportion of male sterilization in the study population ranged from 0 to 2.51% during the study period. This finding, of very low contribution from vasectomy, was comparable with the NFHS-3 data. According to the National Family Health Survey (NFHS), the proportion of male sterilization in India ranged from 2.7 to 5.9% from 2006-2007 to 2008-2009.(8)
This time series has shown that the average number of living children at the time of contraception declined from 3.423 in 1986 to 2.354 in 2012. Many other studies have shown comparable results, though over a short period of time.(3,4,5)
Forecasting using best-fit ARIMA (p, d, q) nonseasonal model has shown that the replacement level of 2.1 children per couple can be achieved by 2018, for couples opting for terminal contraception. Except Muslims, this will be achieved in between 2016 and 2020 for various strata. This result shows that, though Maharashtra has already achieved replacement level of 2.1 total fertility rate (TFR),(9) the couples opting for terminal contraception have not yet achieved that target. It was expected because TFR depends on other factors such as age at marriage, number of sterilizations, couple protection rate, infertility prevalence, etc.
ANCOVA showed that the decline was faster for male children. This is contrary to the belief because sex ratio in Maharashtra is worsened during the last few years.(10,11,12) This could be explained in two ways. Firstly, in 1980s, only 30.73% couples opted for terminal contraception after single male child. This increased to 58.29 and 58.89% in 1990s and after 2000, respectively. On the contrary, percentage of couples opting for terminal contraception after single female child improved marginally from 56.64% in 1980s to 72.41% in 1990s and to 73.53% after 2000. Thus, proportion of couples opting for terminal contraception with only one male child increased significantly over this period, resulting in faster decline in the average male children at the time of terminal contraception. Secondly, significant decrease in infant mortality could have played its role in the couples' decision of opting terminal contraception with single male child.
ANCOVA showed that the decline was faster in rural area than in urban area. This is also contrary to the belief that the fertility is more in rural area than that in urban area. Here, faster decline in rural area could be explained on the basis of much higher average in early years of the time series and almost catching the urban average at the end of the time series.
The rates of decline in Hindu, Muslim, and Buddhist were not significantly different. But, ANCOVA showed that the intercepts were significantly different. It means the averages were significantly different at starting years of the time series. This is contrary to the belief that the decline in average number of children at the time of terminal contraception in Muslims is much slower than that in Hindus.
Few limitations of the study must be mentioned. Firstly, all the limitations of ARIMA (p, d, q) modeling were invariably present in the study. ARIMA models cannot judge increasing resistance as the series approaches a particular point. In this time series we will expect more and more resistance, as the average reaches around 2. Secondly, it is not possible to judge the fertility rates from this study; neither have we tried to do so. Finally, it should be remembered that the forecasting is applicable only to this group, that is, couples opting for terminal contraception and not for entire population.
Footnotes
Source of Support: Nil
Conflict of Interest: None declared.
References
- 1.International Institute for Population Sciences. National Family Health Survey, India. NFHS-3 fact sheets for key indicators based on final data (INDIA & 29 states) [Retrieved on 2014 Mar 01]. Available from: http://www.rchiips.org/nfhs/pdf/Maharashtra.pdf .
- 2.International Institute for Population Sciences. National Family Health Survey, India. NFHS-3 fact sheets for key indicators based on final data (INDIA & 29 states) [Retrieved on 2014 Mar 01]. Available from: http://www.rchiips.org/nfhs/pdf/India.pdf .
- 3.Saha SP. Trend of socio-demographic characteristics of tubectomy acceptors in a rural area of West Bengal (Singur) Indian J Public Health. 1981;25:102–10. [PubMed] [Google Scholar]
- 4.Mehta DC, Shah MH, Khatri TD. Demographic characteristics of tubectomy acceptors in Kaira district. J Fam Welfare. 1975;22:32–40. [Google Scholar]
- 5.Dutta PK, Vaz LS, Singh H. Socio-demographic profile of tubectomy acceptors - an Army experience. J Fam Welfare. 1990;36:56–60. [Google Scholar]
- 6.Dickey DA, Fuller WA. Distribution of the estimators for autoregressive time series with a unit root. J Am Stat Assoc. 1979;74:427–31. [Google Scholar]
- 7.McDonald JH. Department of Biological Sciences, University of Delware. Handbook of Biological Statistics. Analysis of Covariance. [Retrieved on 2013 Aug 01]. Available from: http://udel.edu/~mcdonald/statancova.html .
- 8.Family Welfare Statistics in India 2011, Statistics Division, Ministry of Health and Family Welfare, Government of India. [Retrieved on 2013 Dec 1]. Available from: http://mohfw.nic.in/WriteReadData/l892s/972971120FW%20Statistics%202011%20Revised%2031%2010%2011.pdf .
- 9.Maternal and Child Mortality and Total Fertility Rates, Sample Registration System (SRS), Office of Registrar General, India. Published on 7th July 2011. [Retrived on 2013 Dec 1]. Available from: http://censusindia.gov.in/vital_statistics/SRS_Bulletins/MMR_release_070711.pdf .
- 10.Halder A. A Skewed sex ratio in India. Indian J Med Res. 2006;124:583–4. [PubMed] [Google Scholar]
- 11.Jha P, Kumar R, Vasa P, Dhingra N, Thiruchellvum D, Moineddin R. Low female [corrected]-to-male [corrected] sex ratio of children born in India: National survey of 1.1 million households. Lancet. 2006;367:211–8. doi: 10.1016/S0140-6736(06)67930-0. [DOI] [PubMed] [Google Scholar]
- 12.Subramoney S, Gupta PC. Worsening sex ration in India--some evidence from Mumbai. Indian J Med Res. 2007;125:592–4. [PubMed] [Google Scholar]


