

Abstract
Idiopathic Parkinson's disease (IPD) is the second most common neurodegenerative disease, yet effective disease modifying treatments are still lacking. Neurodegeneration involves multiple interacting pathological pathways. The extent to which neurovascular mechanisms are involved is not well defined in IPD. We aimed to determine whether novel magnetic resonance imaging (MRI) techniques, including arterial spin labelling (ASL) quantification of cerebral perfusion, can reveal altered neurovascular status (NVS) in IPD.
Fourteen participants with IPD (mean ± SD age 65.1 ± 5.9 years) and 14 age and cardiovascular risk factor matched control participants (mean ± SD age 64.6 ± 4.2 years) underwent a 3T MRI scan protocol. ASL images were collected before, during and after a 6 minute hypercapnic challenge. FLAIR images were used to determine white matter lesion score. Quantitative images of cerebral blood flow (CBF) and arterial arrival time (AAT) were calculated from the ASL data both at rest and during hypercapnia. Cerebrovascular reactivity (CVR) images were calculated, depicting the change in CBF and AAT relative to the change in end-tidal CO2.
A significant (p = 0.005) increase in whole brain averaged baseline AAT was observed in IPD participants (mean ± SD age 1532 ± 138 ms) compared to controls (mean ± SD age 1335 ± 165 ms). Voxel-wise analysis revealed this to be widespread across the brain. However, there were no statistically significant differences in white matter lesion score, CBF, or CVR between patients and controls. Regional CBF, but not AAT, in the IPD group was found to correlate positively with Montreal cognitive assessment (MoCA) scores. These findings provide further evidence of alterations in NVS in IPD.
Keywords: Arterial spin labelling, Arterial arrival time, Cerebral blood flow, Idiopathic Parkinson's disease, Cerebrovascular reactivity, MoCA
Abbreviations: ASL, arterial spin labelling; AAT, arterial arrival time; AD, Alzheimer’s disease; CBF, cerebral blood flow; CO2, carbon dioxide; CV, cerebrovascular; CVD, cerebrovascular disease; CVR, cerebrovascular reactivity; CVRAAT, cerebrovascular reactivity measures of arterial arrival time; CVRCBF, cerebrovascular reactivity measures of cerebral blood flow; DS, digit span; DSST, digit symbol substitution test; DWMH, deep white matter hyperintensity; EPI, echo planar imaging; ETCO2, end-tidal carbon dioxide; FAS, (verbal) fluency assessment scale; FLAIR, fluid attenuation inversion recovery; fMRI, functional magnetic resonance imaging; FWE, family-wise error; HAM-D, Hamilton depression rating scale; IPD, idiopathic Parkinson's disease; LARS, Lille apathy rating scale; L-dopa, levodopa; LEDD, levodopa equivalent daily dose; MCI, mild cognitive impairment; MoCA, Montreal cognitive assessment; MRI, magnetic resonance imaging; NPI, neuropsychiatric inventory; NVU, Neurovascular unit; O2−, oxygen; PET, positron emission tomography; PIGD, Postural instability and gait disorder; PL, parietal lobe; PVH, periventricular hyperintensity; ROI, region of interest; SPECT, single positron emission computed tomography; SPM, statistical parametric mapping; STAR, signal targeting with alternating radiofrequency; TD, tremor dominant; TE, echo time; 3T, 3 Tesla; TI, inversion time; TL, temporal lobe; TMT-B, trail making test B; TR, repetition time; UKPDS BB, United Kingdom Parkinson's Disease Society Brain Bank; UPDRS, Unified Parkinson's disease Rating Scale; WAIS-R, Wechsler adult intelligence scale-revised; WML, white matter lesion
Highlights
-
•
Investigation of neurovascular status (NVS) in IPD using arterial spin labelling
-
•
Diffuse prolonged arterial arrival time in IPD compared to controls
-
•
Reduced regional CBF in the IPD group correlated with cognitive impairment.
-
•
Clinical evidence of altered NVS in IPD warrants further research.
1. Introduction
Idiopathic Parkinson's disease (IPD) is the second most common neurodegenerative disorder, affecting 1–2% of the population over the age of 65, with the incidence increasing steeply with age (Van Den Eeden et al., 2003). Progression is variable and difficult to predict, but IPD is often associated with significant disability. Treatment remains symptomatic, with an absence of effective disease modifying or neuroprotective agents.
Alterations in neurovascular status (NVS) – including measures of cerebral hemodynamic function as well as more conventional clinical and radiological measures of cerebrovascular disease (CVD) – might be expected in IPD for two principal reasons. Firstly, neurodegeneration is considered to comprise multiple interacting pathological pathways (Collins et al., 2012). Recently there has been considerable interest in the disturbance of neurovascular unit (NVU) function and the ‘neurovascular model’ of neurodegeneration (Grammas et al., 2011; Zlokovic, 2008). The NVU is a complex, metabolically active system of endothelial cells and glial cells in close proximity to a neuron. Whether altered NVU function is primary or secondary to neurodegeneration, or even attributable to the effect of pharmacotherapy, remains unclear. Secondly, as IPD is strongly associated with ageing, an increased burden of comorbid CVD might be expected, but the evidence is somewhat conflicted probably on account of varying study designs and endpoints (Morley and Duda, 2012). Currently, the extent to which NVS is altered in IPD is poorly defined.
There is also substantial heterogeneity within IPD with respect to clinical phenotype, including motor and non-motor features and it is possible that differences in NVS might be influential in these differing phenotypes (Lee et al., 2009). Tremor dominant (TD) and postural instability and gait disorder (PIGD) phenotypes are recognised, based on the predominant motor features (Jankovic et al., 1990). Non-motor features (in particular neuropsychiatric and cognitive dysfunction) have been reported in a significant proportion of IPD patients; with cognitive decline being associated with worse motor and non-motor features (Aarsland et al., 1999; Hu et al., 2014). Studies suggest distinct clinical courses and even variable involvement of the dopaminergic system and other pathways between phenotypes (Eggers et al., 2012; Mito et al., 2006).
Magnetic resonance imaging (MRI) can provide valuable measures of NVS, such as white matter lesion (WML) burden and cerebral blood flow (CBF). Arterial spin labelling (ASL) employs magnetically labelled endogenous arterial blood water to quantify cerebral perfusion. ASL can also measure arterial arrival time (AAT), the time taken for blood to travel from the labelling slab to the tissue of interest (Wang et al., 2003; Zappe et al., 2007). AAT is longest in distal branches, especially in border zone (or watershed) areas (Hendrikse et al., 2008; Petersen et al., 2006). Alterations in resting state AAT are considered likely to reflect chronic arteriolar vasodilation or collateral flow (Derdeyn et al., 2002; Farkas and Luiten, 2001). Cerebrovascular reactivity (CVR) can be measured by combining ASL with a hypercapnic challenge. CVR reflects the capacity of the blood vessels to dilate in response to a hypercapnic challenge and can be used as a measure of brain vascular reserve (Hajjar et al., 2010).
We hypothesise that NVS is altered in IPD. This was tested by comparing MRI measurements of NVS between a group of people with IPD and age and cardiovascular risk matched controls. In addition MRI images were correlated against cognitive and neuropsychiatric scores to determine any association between NVS measurements and such non-motor features of IPD.
2. Methods
2.1. Participants
Relevant approvals were obtained including ethics (North West — Preston Research Ethics Committee), research governance and local university approvals. Eligibility criteria for IPD participants were a clinical diagnosis of IPD fulfilling the UK Parkinson's Disease Society (UKPDS) Brain Bank (BB) criteria (http://www.ncbi.nlm.nih.gov/projects/gap/cgi-bin/GetPdf.cgi?id=phd000042) without known clinical CVD (no history of transient ischaemic attack or stroke) or dementia (Emre et al., 2007) or radiological evidence of large vessel cortical/subcortical infarct >1.5 cm. Control participants (without IPD or above exclusion criteria) were matched for age and cardiovascular risk factors. All participants were required to provide written informed consent and had the capacity to do so. All underwent a scan protocol on a 3T Philips Achieva MRI system using an 8 channel head coil at Salford Royal Hospital. Involuntary movements in participants were minimised using padding within the head coil. All participants were scanned ‘ON’ their medications. IPD phenotype was assessed using the Unified Parkinson's Disease Rating Scale (UPDRS) (http://www.etas.ee/wp-content/uploads/2013/10/updrs.pdf) during the scan visit. Participants were further classified into three subtypes (TD, PIGD, and intermediate) by Jankovic's method (Jankovic et al., 1990). Disease severity was measured using the Hoehn and Yahr rating scale (Hoehn and Yahr, 1967). No alterations were made to the participants' medications for the study protocol. Routine clinical baseline data were also recorded and the levodopa equivalent doses (LEDD) calculated (Tomlinson et al., 2010). A battery of clinical scales was administered, including the Montreal Cognitive Assessment (MoCA) (http://www.MoCAtest.org), the O'Sullivan brief cognitive assessment for participants with cerebral small vessel disease (O'Sullivan et al., 2005), the Lille apathy rating scale (LARS) (Sockeel et al., 2006), the Hamilton depression scale (HAM-D) (Muller and Dragicevic, 2003) and the neuropsychiatric inventory (NPI) psychosis subscale (Fernandez et al., 2008). Demographics and clinical data were compared between IPD and control participants using the unpaired Student t-test with p-value set at <0.05.
2.2. MRI protocol
A T2-weighted FLAIR image was acquired with the following parameters: TR 11 s, TI 2.8 s, TE 120 ms, in-plane resolution of 0.45 mm, 30 axial slices of 4 mm thickness with 1 mm gap covering the whole brain. A Look-Locker ASL sequence was used (Gunther et al., 2001), with STAR labelling (Edelman et al., 1994) and 4 readout times of 800, 1400, 2000, and 2600 ms, TR: 3500 ms; TE 22 ms; flip angle 40°; 3.5 × 3.5 × 6 mm voxels with a 1 mm gap between slices; 15 slices covering the cerebrum but not the cerebellum with bipolar ‘vascular crusher’ gradients added to dephase fast flowing spins and so remove large vessel signal. The labelling slab was 15 cm with a 10 mm gap between the labelling and imaging regions. 112 pairs of labelled and control images were collected, with scan duration approximately 13 min. To allow quantification of CBF an additional scan was acquired with TR = 10 s and 15 read-out times (from 800 to 9200 ms) in order to estimate the equilibrium magnetisation of the brain. An additional echo planar image (EPI) was collected with the same slice positioning and the same voxel dimensions but with TE = 35 ms to give typical fMRI contrast for registration and normalisation purposes. A 3D T1-weighted image with 1 mm isotropic resolution was also collected.
During the ASL acquisition a CO2 (hypercapnic) challenge was carried out. After 5 min of breathing room air (from which the baseline perfusion images were extracted) there followed 6 min of hypercapnia, administered using a non-rebreathing circuit using the Fenn and Craig technique (Fenn and Craig, 1963) and a final 2 min of return to room air. This method involves a thin stream of gas (79% CO2 balanced with 21% O2) being delivered through larger tubing allowing it to mix with room air. This mixture then passes through a 3-way valve which directs it to a filter and a mouth piece (Vidyasagar et al., 2013). End-tidal CO2 (ETCO2) and O2 were continuously monitored using Powerlab (LabChart7 V7.2.1, 2011) and the CO2 flow-rate was altered to ensure all participants reached an increased end tidal level approximately 1% above their baseline ETCO2. Prior to each scanning session the gas analysers were calibrated using a canister of gas with known concentrations of 5.03% CO2 and 21.0% O2, each participant also had a trial session of inhaled gas to allow them to become accustomed to the apparatus, this also provided an opportunity to assess an appropriate flow rate required to induce a 1% change in ETCO2.
2.3. Data analysis
WML burden was assessed semi-quantitatively using visual rating scales (Fazekas et al., 1993; Wahlund et al., 2001). Between group comparisons were made using Student's unpaired t test analysis. ASL data were analysed using in-house MATLAB (Mathworks, MA, USA) routines using a single blood compartment model, adapted for Look-Locker readout (Parkes L.M., 2012). Further details of the ASL modeling are given in the appendix.
Baseline CBF and AAT maps were calculated using the first 5 min of ASL data, during breathing of air. CVR maps were calculated using subtraction images of CBF and AAT between periods of air (5 min) and hypercapnia (last 5 min, omitting the first minute of hypercapnia to allow equilibrium to be reached) and dividing these by the value of ΔETCO2 on an individual basis. Whole brain values for CBF, AAT, CVRCBF (% CBF change/ΔETCO2) and CVRAAT (∆AAT/ΔETCO2) were calculated using a simple threshold mask based on the ASL control images on an individual basis. Differences between IPD and control participants for CBF, AAT and all CVR measures were tested using Student's t-tests in Excel. Differences between IPD and control participants for WML burden as measured by the visual rating scales were tested using Fisher's exact test in SPSS, taking into account the non-parametric nature of the scales and small sample sizes. Linear regression was used to assess whether WML burden could predict CBF and AAT using WML burden as a categorical variable in regression.
Voxel-wise analysis was also performed using the SPM8 PET toolbox (http://www.fil.ion.ucl.ac.uk/spm/) to compare CBF, AAT and CVR maps between IPD and control participants (phenotype specific differences were not analysed due to the small sample sizes). Image pre-processing in SPM included (1) motion correction, (2) registration and normalisation of the EPI image to the EPI template within SPM, and application of this procedure to the perfusion maps, and (3) spatial smoothing of the normalised images using a 12 mm full-width-half-maximum kernel. CBF maps were corrected for atrophy using the same method as Johnson et al. (2005) according to the proportion of gray matter and white matter in each voxel, obtained from the segmented T1-weighted image. Voxel-wise comparisons of CBF, AAT, CVRCBF, and CVRAAT between the IPD and control groups were carried out using a two-sample unpaired t-test (unequal variances). Regions were considered significant at a p value of <0.001 uncorrected, with a minimum cluster size of 100 voxels (at the re-sampled voxel size of 2 mm isotropic), which was felt sufficient to avoid type II errors in view of the exploratory nature of the study (Lieberman and Cunningham, 2009). Further analysis using family-wise error (FWE) correction for multiple comparisons at the cluster level was performed (using Gaussian Radom Field Theory as employed in SPM8). In addition, voxel wise regression of CBF and AAT against MoCA and HAM-D scores was performed within both the IPD and control groups separately.
3. Results
3.1. Participants
Fourteen IPD participants (mean ± SD age 65.1 ± 5.9 years) and 14 control participants (mean ± SD age 64.6 ± 4.2 years) were enrolled into the study. Six IPD participants were assigned to the PIGD subgroup and 6 to the TD subgroup and 2 were intermediate (Table 1 and 2). Thirteen IPD and all 14 control participants completed the full scanning protocol (ASL data were lacking for 1 IPD participant due to difficulties in tolerating the set-up of the gas apparatus in the scanner). All participants showed the expected increase in CBF and reduction in AAT with the hypercapnic challenge due to induced cerebrovasodilation (Hajjar et al., 2010). Two further IPD and 2 control participants were excluded from CVR analysis as the ΔETCO2 gas response was outside the expected limits (4–12 mm Hg). Twelve IPD (6 PIGD, 5 TD) and 13 control participants completed the clinical scales.
Table 1.
Demographics and clinical characteristics of the study group.
| Controls (n = 14) |
IPD (n = 14) |
p value (IPD vs control) | PIGD (n = 6) | Tremor (n = 6) | |
|---|---|---|---|---|---|
| N (female: male) | 4:10 | 6:9 | n/a | 4:2 | 0:6 |
| Age, years: mean (± SD); [range] | 64.6 (4.2); [58-71] | 65.1 (5.9); [54-75] | 0.7 | 65.5 (4.6); [61-72] | 66.2 (0.6); [54-75] |
| No. of cardiovascular risk factors: mean (SD) | 0.9 (1.0) | 1.4 (1.4) | 0.3 | 0.8 (1.0) | 2 (1.5) |
| No. of other comorbidites: mean (SD) | 0.43 (0.65) | 0.9 (1.03) | 0.2 | 1 (0.9) | 0.8 (1.3) |
| Disease duration, years: mean (SD) | n/a | 9.2 (6.0) | n/a | 10.8 (4.8) | 5.2 (3.0) |
| Hoehn and Yahr stage ON: mean (SD) | n/a | 2.5 (1.1) | n/a | 3.2 (1.1) | 1.8 (0.6) |
| LEDD score: mean (SD) | n/a | 638 (353) | n/a | 750 (453) | 488 (347) |
Table 2.
Key measurement items from the UPDRS. Scores: bradykinesia (0–36), tremor (0–32), rigidity (0–20), PIGD (0–20).
| UPDRS item | PIGD sub-score | TD sub-score |
|---|---|---|
| Bradykinesia Mean (SD) |
6.2 (3.7) | 6.1 (0.2) |
| Tremor Mean (SD) |
1.8 (2.1) | 11.5 (4.7) |
| Rigidity Mean (SD) |
8.5 (3.8) | 8.2 (5.4) |
| PIGD Mean (SD) |
12.5 (3.9) | 1.5 (1.0) |
3.2. Baseline CBF and AAT
Whole brain baseline CBF did not differ between the IPD and control groups (Table 3a). The voxel-wise analysis did reveal one region of lower CBF in patients compared to controls (at p < 0.001 minimum cluster size 100 voxels) in the right parietal lobe supramarginal gyrus near the angular gyrus (Talairach coordinates [16 −80 34], cluster size 231 voxels, peak t-value 3.8, peak p-value 0.0004). There were no regions of significant hyperperfusion in the IPD group compared to controls.
Table 3a.
Whole brain CBF, AAT and CVR measurements.
| Control group (n = 14) mean ± SD | IPD group (n = 13) mean ± SD | p value (IPD vs controls) | |
|---|---|---|---|
| Baseline CBF (ml/min/100 ml) | 38.0 ± 9.3 | 35.3 ± 5.8 | 0.5 |
| Baseline AAT (ms) | 1335 ± 165 | 1532 ± 138 | 0.005 |
| CVR_CBF (%/Δmm Hg) | 2.2 ± 2.9 | 4.0 ± 2.9 (n = 13) | 0.2 |
| CVR_AAT (Δms/Δmm Hg) | −21.5 ± 7.1 | −15.3 ± 11.2 (n = 13) | 0.2 |
Whole brain baseline AAT was significantly prolonged in IPD participants compared to controls (Table 3a). Voxel-wise analysis revealed widespread regions of significantly increased baseline AAT in the IPD group compared to controls, particularly in the frontal and temporal regions at p < 0.001 minimum cluster threshold 100 voxels (Fig. 1b and Table 4). Two of these regions survive FWE correction (Fig. 1c). There were no regions in the brain where AAT was significantly shorter in the IPD group than in the control group. A mean difference map of AAT between patients and controls was created to further shed light on the distribution of the prolonged AAT; this revealed bilateral, diffuse increases in AAT in the IPD group compared to controls (Fig. 1a).
Fig. 1.
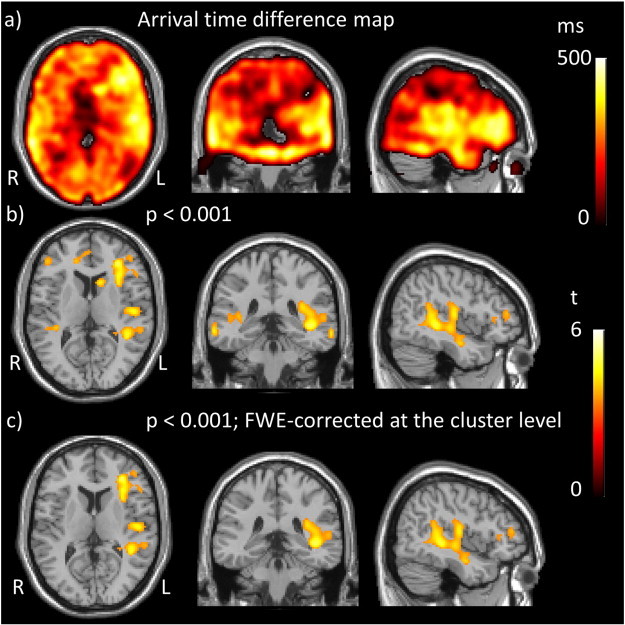
Regions of prolonged arrival time in IPD compared to controls. a) Arrival time difference map created by subtraction of mean AAT in controls from mean AAT in patients. b) t statistic map obtained by comparison of AAT between the IPD group and controls thresholded to p < 0.001 uncorrected, minimum cluster size 100 voxels and c) t statistic map thresholded at p < 0.001 FWE-corrected with minimum cluster size 100 voxels. Thus displaying positive t values, representing increased AAT in the IPD group compared to controls (there were no regions of decreased AAT).
Table 4.
Regions of significantly longer AAT in the IPD group compared to controls at p < 0.001, cluster size 100.
| Region | Cluster size | Cluster p (FWE-cor) | Peak t value | Peak p (uncor) | Peak MNI coordinates |
|---|---|---|---|---|---|
| L inferior frontal gyrus extending to sub-gyral region | 839 | 0.02 |
5.2 |
<0.0001 | −32 38 10 |
| 4.7 | <0.0001 | −34 24 8 | |||
| 4.4 | <0.0001 | −32 16 14 | |||
| L middle TL extending to large sub gyral region | 2327 | <0.0001 | 5.1 | <0.0001 | −42 −36 −2 |
| 4.7 | <0.0001 | −42 −46 6 | |||
| 4.7 | <0.0001 | −58 −6 −6 | |||
| R middle temporal gyrus | 110 | 0.8 | 4.6 | <0.0001 | 64 −38 −8 |
| L TL middle temporal gyrus | 104 | 0.8 | 4.5 | <0.0001 | −66 −34 −12 |
| L caudate body | 101 | 0.8 | 4.5 | <0.0001 | −14 16 12 |
| L cerebrum middle frontal gyrus | 140 | 0.7 | 4.4 | <0.0001 | −32 56 −8 |
| 3.9 | 0.0004 | −40 52 −6 | |||
| R inferior frontal gyrus | 100 | 0.8 | 4.1 | 0.0002 | −46 40 6 |
| R TL superior to transverse gyrus | 119 | 0.8 | 4.0 | 0.0002 | 36 −34 10 |
| 3.7 | 0.0005 | 50 −38 16 | |||
| 3.7 | 0.0005 | 46 −34 6 | |||
| R anterior cingulate | 153 | 0.7 | 3.9 | 0.0003 | 14 40 10 |
| 3.9 | 0.0003 | 8 46 6 |
3.3. CVR measures
Whole brain measures of CVRCBF or CVRAAT did not differ between IPD and control participants. Voxel-wise analysis did not reveal any regions of statistically significant differences in these measurements between the groups.
3.4. WML burden
To test for differences in WML score Fisher’s exact test was used, combining scores into categories (0–1) and 2 where appropriate since the majority of patients scored 1 or 2. The results showed no association between any of the WML scores and whether a participant has IPD, with p-values as given in Table 3b. There were no statistically significant correlations between the WML burden (Wahlund scale) and CBF or AAT.
Table 3b.
WML rating scales. PVH, periventricular hyperintensity; DWMH, deep white matter hyperintensity.
| Score | Control group (n = 14) number (%) | IPD group (n = 14) number (%) | p value (IPD vs controls) | |
|---|---|---|---|---|
| Wahlund | 0 or 1 | 12 (85.7%) | 8 (57.1%) | 0.2 |
| 2 | 2 (14.3%) | 6 (42.9%) | ||
| Fazekas PVH | 1 | 11 (78.6%) | 10 (71.4%) | 1.0 |
| 2 | 3 (21.4%) | 4 (28.6%) | ||
| Fazekas DWMH | 0 or 1 | 12 (85.7%) | 9 (65.3%) | 0.4 |
| 2 | 2 (14.3%) | 5 (35.7%) |
3.5. Clinical scales
Results of the clinical scales are shown in Table 5. The IPD group (mean ± SD, score 8.5 ± 2.5) scored significantly lower than the control group (mean ± SD score 10.8 ± 2.7, p = 0.03) in the digit symbol substitution test (DSST). Six IPD participants (4 PIGD, 2 TD) but only one control participant met criteria for mild cognitive impairment as reflected by a score of ≤25 on the MoCA tool. Three IPD participants (2 PIGD, 1 intermediate) met the cut-off for ‘mild depression’ as measured by the Ham-D scale, whereas all control participants fell within the ‘not depressed’ range on this scale. All participants completed the trail making test part B (TMT-B) except for one IPD (PIGD group) and one control participant. Neither group exhibited significant apathy or any features of psychosis as per the clinical scales.
Table 5.
Clinical scales and scores.
| Controls (n = 13) | IPD (n = 12) | p value (IPD vs control) | PIGD (n = 6) | Tremor (n = 5) | |
|---|---|---|---|---|---|
| HAM-D: mean (SD) | 2.6 (2.4) | 5.3 (5.4) | 0.1 | 6.4 (4.2) | 3.6 (7.0) |
| LARS: mean (SD) | −26.3 (5.2) | −25.3 (3.3) | 0.6 | −24.3 (3.7) | −26.8 (1.8) |
| DS: mean (SD) | 9.5 (2.8) | 11.4 (2.9) | 0.1 | 10 (2.9) | 13.4 (1.5) |
| DSST: mean (SD) | 20.8 (2.7) | 8.5 (2.5) | 0.03 | 7.4 (1.6) | 2.8 (0.6) |
| FAS VF: mean (SD) | 52.3 (33.2) | 49.0 (25.3) | 0.8 | 39.7 (24.2) | 62.0 (22.8) |
| TMT-B: mean (SD) | 96.7 (40.8) | 103.9 (40.8) | 0.7 | 119.3 (43.7) | 85.4 (31.4) |
| MoCA: mean (SD) | 28.3 (3.0) | 26.3 (3.0) | 0.1 | 26.0 (3.3) | 26.6 (2.7) |
HAM-D, Hamilton depression scale; LARS, Lille apathy rating scale; DS, digit span; DSST, digit symbol substitution test; FAS VF, verbal fluency; TMT-B, trial making test B; MoCA, Montreal cognitive assessment.
Voxel-wise analysis using linear regression was performed to identify potential regional correlations between MOCA and HAM-D scores, with both CBF and AAT. Reduced CBF mainly in the parietal regions was found to correlate with reduced MoCA score (Table 6, Fig. 2) in the IPD group only. To help verify the statistical threshold used, MoCA scores of the IPD participants were shuffled randomly and the voxel-wise regression analysis was repeated. No regions of significant correlation were found, confirming the validity of our findings. There were no regions of significant correlation of MoCA score and AAT in either of the two study groups. In addition HAM-D scores did not correlate with either CBF or AAT in either the IPD or control group.
Table 6.
Regions of significant correlation between CBF and MoCA scores in the IPD group, thresholded to p < 0.001 uncorrected and minimum cluster size 100 voxels.
| Region | Cluster size | Cluster p (FWE-cor) | Peak t value | Peak p value uncorrected | Peak MNI coordinates |
|---|---|---|---|---|---|
| Left superior parietal lobe extending into precuneus and angular gyrus | 464 | 0.09 | 6.1 | <0.0001 | −30 −76 44 |
| 5.7 | <0.0001 | −40 −70 42 | |||
| 5.4 | <0.0001 | −48 −70 34 | |||
| Left precuneus | 112 | 0.6 | 5.7 | <0.0001 | −12 −72 48 |
Fig. 2.
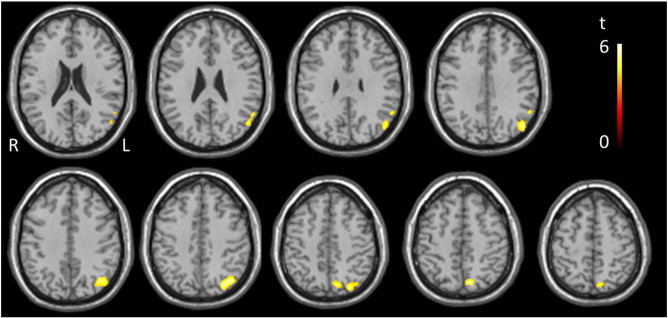
Regions of significant correlation between CBF and MoCA scores for the IPD group, thresholded to p < 0.001 uncorrected and minimum cluster size 100 voxels.
4. Discussion
We hypothesised that NVS is altered in IPD, which may be a reflection of the neurodegenerative process or due to comorbid CVD. The two key findings of this study support this notion. We revealed diffuse AAT prolongation in the IPD group compared to healthy control participants and significant regional correlations between MoCA scores and CBF in the IPD group only.
To our knowledge, the prolonged AAT in the IPD group compared to controls has not been previously reported. Although the differences appear predominantly in the right hemisphere the mean difference maps suggest prolonged AAT is more diffuse (Fig. 1). It is possible to attribute prolonged AAT to any factor which increases path length or decreases the velocity of flow i.e. diameter and resistance of vessels and characteristics of the circulating blood (Liu et al., 2012). Several other studies have reported on AAT in non-PD populations with various reasons proposed. For example, prolonged AAT has been noted in studies of ageing (Liu et al., 2012), presumably related to age driven structural cerebrovascular changes such as increased vessel tortuosity, increased rarefaction and arteriolar wall damage (Chen et al., 2012; Wolk and Detre, 2012). AAT prolongation in multiple sclerosis has been attributed to widespread inflammation or chronic vasodilation of the resistance vessels (Paling et al., 2014). A study in AD revealed prolonged AAT and hypoperfusion in the left inferior frontal and middle cingulate gyri (Mak et al., 2012). Lastly, stroke and TIA studies have attributed AAT prolongation to the recruitment of collateral pathways in large artery stenosis with, in some cases, preserved perfusion (Chalela et al., 2000; MacIntosh et al., 2010b; Zaharchuk, 2011).
We did not find differences in CBF between the IPD group and controls at the p < 0.001, minimum cluster size 100 voxels, yet at the more lenient threshold of p < 0.005, regions of hypoperfusion in the left cuneus in the IPD group were revealed. This perfusion deficit is in keeping with both ASL and positron emission tomography (PET) studies in IPD which have found a similar pattern of hypoperfusion and hypometabolism in IPD patients compared to healthy controls with significant correlation between PET and ASL perfusion patterns (Borghammer et al., 2010; Fernandez-Seara et al., 2012; Kamagata et al., 2011; Ma et al., 2010; Melzer et al., 2011). These studies consistently revealed bilateral hypoperfusion in the occipital lobe (including the cuneus) as well as the posterior parietal regions, with variable patterns in the frontal lobe. Hypoperfusion in neurodegenerative states has previously been attributed to direct tissue loss or the result of loss of functional connectivity (Borghammer et al., 2010; Yoshiura et al., 2009). We feel that the small sample size may mean important differences between the 2 groups (such as hypoperfusion) which may be under-represented in this study. Our results show that AAT is a more sensitive marker of changes in NVS in IPD than CBF, and may be important to consider in future studies using ASL.
Despite diffuse baseline AAT prolongation in the IPD group, the global response of AAT and CBF to the hypercapnic challenge (CVRAAT and CVRCBF) did not differ significantly between the groups, suggesting vascular responsiveness is generally preserved. If the prolonged baseline AAT is indicative of chronic vasodilation then the AAT and CBF response in the IPD group would be expected to be reduced (reduced capacity for further dilation). However, the variability of both CVRAAT and CVRCBF is large, so greater participant numbers are probably required to reliably test for these differences.
This study also revealed a positive correlation between CBF predominantly in the posterior regions and total MoCA scores in the IPD group. This could mean that hypoperfusion in these regions contributes to cognitive impairment in IPD. Similarly cognitive scores including the mini mental state examination (MMSE) scores and MoCA have been noted to correlate with hypoperfusion in IPD and other diseases affecting cognition, with specific patterns of hypoperfusion dependent on the disease state (Chao et al., 2010; Firbank et al., 2003; Nobili et al., 2008; Yoon et al., 2012). However any potential causal relationship would need further study. We recognise that the relatively small sample size may potentially account for differences in other non-motor features not reaching statistical significance (Table 5) and further exploration of their pathophysiological underpinnings is warranted.
This study did not reveal differences in WML burden between the IPD group and controls; larger sample sizes would be needed to consider phenotype-specific differences.
Certain limitations of this exploratory study must be acknowledged. In particular, we used only 4 post-labelling time-points for the ASL acquisition, which was necessary in order to cover the cerebrum with vascular crushing gradients enabled. More time points may have increased the precision of the AAT measurements. Due to the exploratory nature of the study, uncorrected p-values have been displayed alongside FWE values, so a larger data set with FWE correction is required to verify the results. It is possible that differences in NVS might be influential in differing clinical phenotypes of IPD (Lee et al., 2009), however the small sample size in this study meant that phenotype-specific differences could not be explored. LED scores differed between participants, which may confound the results as previous studies have revealed regional blood flow increases with levodopa (Hershey et al., 2003; Kobari et al., 1995).
5. Conclusion
This exploratory work used MRI perfusion and structural measures to investigate NVS in IPD. In IPD we have identified prolonged baseline AAT, as well as regional posterior hypoperfusion with correlations with impaired cognition. Alterations in neurovascular parameters in IPD and their associations with clinical features and treatment, as well as the potential identification of targets for intervention, warrant further study.
6. Appendix
ASL data were analysed using a single blood compartment model, adapted for Look–Locker readout (Parkes L.M., 2012). This model assumes that labelled water remains in the blood and that no labelled water leaves the voxel, an approach that has been shown to be reasonably accurate (Parkes and Tofts, 2002). With these assumptions, the signal in the difference image (control – label), ΔM, can be described by:
| (1) |
where R1 is the apparent R1 of blood during the Look–Locker readout and f is CBF. For STAR labelling the magnetisation of arterial blood, ma, is given by:
| (2) |
and ma = 0 at all other times. Here, ta is the arrival time and τ is the bolus width. Ma0 is the equilibrium magnetisation of arterial blood, α is the inversion efficiency (assumed to equal 1) and R1b is the true R1 of blood. According to Gunther et al. (2001) R1=R1b − ln(cosθ)/TI2 where θ is the flip angle and TI2 the spacing of the Look–Locker readout. The solution for ΔM is:
| (3) |
where ΔR = R1 − R1b. The mean difference signal ΔM was fit on a voxel-wise basis to Eq. 3, extracting values for the 2 free parameters f (CBF) and ta (AAT), with fixed values for τ = 1000 ms (MacIntosh et al., 2010a), T1b = 1600 ms (Lu et al., 2004) (note R1b = 1/T1b), and M0. The calibration images were fit on a voxel-wise basis to a saturation recovery curve, producing maps of T1 and M0. Ma0 was estimated from a whole brain estimate of M0 divided by the blood–brain partition coefficient λ = 0.9 (Roberts et al., 1996).
Acknowledgements
We would like to sincerely thank all the participants for their kind participation in the study. In addition, the radiographers at Salford Royal for their support and expertise and Mr Matthew Wright for his support and input whilst performing the scans. We'd also like to thank the University of Manchester's MRI facility (MRIF) for their financial contribution towards the scanning costs and the Biomedical Imaging Institute (BII) for their support and financial contribution towards analysis and writing.
References
- Aarsland D., Larsen J.P., Lim N.G., Janvin C., Karlsen K., Tandberg E., Cummings J.L. Range of neuropsychiatric disturbances in patients with Parkinson's disease. Journal of Neurology, Neurosurgery, and Psychiatry. 1999;67:492–496. doi: 10.1136/jnnp.67.4.492. 10486397 [DOI] [PMC free article] [PubMed] [Google Scholar]
- Borghammer P., Chakravarty M., Jonsdottir K.Y., Sato N., Matsuda H., Ito K., Arahata Y., Kato T., Gjedde A. Cortical hypometabolism and hypoperfusion in Parkinson's disease is extensive: probably even at early disease stages. Brain Structure & Function. 2010;214:303–317. doi: 10.1007/s00429-010-0246-0. 20361208 [DOI] [PubMed] [Google Scholar]
- Chalela J.A., Alsop D.C., Gonzalez-Atavales J.B., Maldjian J.A., Kasner S.E., Detre J.A. Magnetic resonance perfusion imaging in acute ischemic stroke using continuous arterial spin labeling. Stroke; a Journal of Cerebral Circulation. 2000;31:680–687. doi: 10.1161/01.str.31.3.680. 10700504 [DOI] [PubMed] [Google Scholar]
- Chao L.L., Buckley S.T., Kornak J., Schuff N., Madison C., Yaffe K., Miller B.L., Kramer J.H., Weiner M.W. ASL perfusion MRI predicts cognitive decline and conversion from MCI to dementia. Alzheimer Disease and Associated Disorders. 2010;24:19–27. doi: 10.1097/WAD.0b013e3181b4f736. 20220321 [DOI] [PMC free article] [PubMed] [Google Scholar]
- Chen Y., Wang D.J., Detre J.A. Comparison of arterial transit times estimated using arterial spin labeling. Magma (New York, N.Y.) 2012;25:135–144. doi: 10.1007/s10334-011-0276-5. 21863374 [DOI] [PubMed] [Google Scholar]
- Collins L.M., Toulouse A., Connor T.J., Nolan Y.M. Contributions of central and systemic inflammation to the pathophysiology of Parkinson's disease. Neuropharmacology. 2012;62:2154–2168. doi: 10.1016/j.neuropharm.2012.01.028. [DOI] [PubMed] [Google Scholar]
- Derdeyn C.P., Videen T.O., Yundt K.D., Fritsch S.M., Carpenter D.A., Grubb R.L., Powers W.J. Variability of cerebral blood volume and oxygen extraction: stages of cerebral haemodynamic impairment revisited. Brain: A Journal of Neurology. 2002;125:595–607. doi: 10.1093/brain/awf047. 11872616 [DOI] [PubMed] [Google Scholar]
- Edelman R.R., Siewert B., Darby D.G., Thangaraj V., Nobre A.C., Mesulam M.M., Warach S. Qualitative mapping of cerebral blood flow and functional localization with echo-planar MR imaging and signal targeting with alternating radio frequency. Radiology. 1994;192:513–520. doi: 10.1148/radiology.192.2.8029425. 8029425 [DOI] [PubMed] [Google Scholar]
- Eggers C., Pedrosa D.J., Kahraman D., Maier F., Lewis C.J., Fink G.R., Schmidt M., Timmermann L. Parkinson subtypes progress differently in clinical course and imaging pattern. PloS One. 2012;7:e46813. doi: 10.1371/journal.pone.0046813. 23056463 [DOI] [PMC free article] [PubMed] [Google Scholar]
- Emre M., Aarsland D., Brown R., Burn D.J., Duyckaerts C., Mizuno Y., Broe G.A., Cummings J., Dickson D.W., Gauthier S., Goldman J., Goetz C., Korczyn A., Lees A., Levy R., Litvan I., McKeith I., Olanow W., Poewe W., Quinn N., Sampaio C., Tolosa E., Dubois B. Clinical diagnostic criteria for dementia associated with Parkinson's disease. Movement Disorders: Official Journal of the Movement Disorder Society. 2007;22:1689–1707. doi: 10.1002/mds.21507. 17542011 Quiz 1837. [DOI] [PubMed] [Google Scholar]
- Farkas E., Luiten P.G. Cerebral microvascular pathology in aging and Alzheimer's disease. Progress in Neurobiology. 2001;64:575–611. doi: 10.1016/s0301-0082(00)00068-x. 11311463 [DOI] [PubMed] [Google Scholar]
- Fazekas F., Kleinert R., Offenbacher H., Schmidt R., Kleinert G., Payer F., Radner H., Lechner H. Pathologic correlates of incidental MRI white matter signal hyperintensities. Neurology. 1993;43:1683–1689. doi: 10.1212/wnl.43.9.1683. 8414012 [DOI] [PubMed] [Google Scholar]
- Fenn W.O., Craig A.B., Jr. Effect of CO2 on respiration using a new method of administering CO2. Journal of Applied Physiology. 1963;18:1023–1024. doi: 10.1152/jappl.1963.18.5.1023. 14063243 [DOI] [PubMed] [Google Scholar]
- Fernández-Seara M.A., Mengual E., Vidorreta M., Aznárez-Sanado M., Loayza F.R., Villagra F., Irigoyen J., Pastor M.A. Cortical hypoperfusion in Parkinson's disease assessed using arterial spin labeled perfusion MRI. Neuroimage. 2012;59:2743–2750. doi: 10.1016/j.neuroimage.2011.10.033. 22032942 [DOI] [PubMed] [Google Scholar]
- Fernandez H.H., Aarsland D., Fénelon G., Friedman J.H., Marsh L., Tröster A.I., Poewe W., Rascol O., Sampaio C., Stebbins G.T., Goetz C.G. Scales to assess psychosis in Parkinson's disease: critique and recommendations. Movement Disorders: Official Journal of the Movement Disorder Society. 2008;23:484–500. doi: 10.1002/mds.21875. 18175343 [DOI] [PubMed] [Google Scholar]
- Firbank M.J., Colloby S.J., Burn D.J., McKeith I.G., O’Brien J.T. Regional cerebral blood flow in Parkinson's disease with and without dementia. Neuroimage. 2003;20:1309–1319. doi: 10.1016/S1053-8119(03)00364-1. 14568499 [DOI] [PubMed] [Google Scholar]
- Grammas P., Martinez J., Miller B. Cerebral microvascular endothelium and the pathogenesis of neurodegenerative diseases. Expert Reviews in Molecular Medicine. 2011;13:e19. doi: 10.1017/S1462399411001918. 21676288 [DOI] [PubMed] [Google Scholar]
- Günther M., Bock M., Schad L.R. Arterial spin labeling in combination with a look-locker sampling strategy: inflow turbo-sampling Epi-FAIR (ITS-FAIR) Magnetic Resonance in Medicine: Official Journal of the Society of Magnetic Resonance in Medicine / Society of Magnetic Resonance in Medicine. 2001;46:974–984. doi: 10.1002/mrm.1284. 11675650 [DOI] [PubMed] [Google Scholar]
- Hajjar I., Zhao P., Alsop D., Novak V. Hypertension and cerebral vasoreactivity: a continuous arterial spin labeling magnetic resonance imaging study. Hypertension. 2010;56:859–864. doi: 10.1161/HYPERTENSIONAHA.110.160002. 20876450 [DOI] [PMC free article] [PubMed] [Google Scholar]
- Hendrikse J., Petersen E.T., van Laar P.J., Golay X. Cerebral border zones between distal end branches of intracranial arteries: MR imaging. Radiology. 2008;246:572–580. doi: 10.1148/radiol.2461062100. 18055872 [DOI] [PubMed] [Google Scholar]
- Hershey T., Black K.J., Carl J.L., McGee-Minnich L., Snyder A.Z., Perlmutter J.S. Long term treatment and disease severity change brain responses to levodopa in Parkinson's disease. Journal of Neurology, Neurosurgery, and Psychiatry. 2003;74:844–851. doi: 10.1136/jnnp.74.7.844. 12810765 [DOI] [PMC free article] [PubMed] [Google Scholar]
- Hoehn M.M., Yahr M.D. Parkinsonism: onset, progression and mortality. Neurology. 1967;17:427–442. doi: 10.1212/wnl.17.5.427. 6067254 [DOI] [PubMed] [Google Scholar]
- Hu M.T., Szewczyk-Królikowski K., Tomlinson P., Nithi K., Rolinski M., Murray C., Talbot K., Ebmeier K.P., Mackay C.E., Ben-Shlomo Y. Predictors of cognitive impairment in an early stage Parkinson's disease cohort. Movement Disorders: Official Journal of the Movement Disorder Society. 2014;29(3):351–359. doi: 10.1002/mds.25748. 24395708 [DOI] [PMC free article] [PubMed] [Google Scholar]
- Jankovic J., McDermott M., Carter J., Gauthier S., Goetz C., Golbe L., Huber S., Koller W., Olanow C., Shoulson I. Variable expression of Parkinson's disease: a base-line analysis of the DATATOP cohort. The Parkinson Study Group. Neurology. 1990;40:1529–1534. doi: 10.1212/wnl.40.10.1529. 2215943 [DOI] [PubMed] [Google Scholar]
- Johnson N.A., Jahng G.H., Weiner M.W., Miller B.L., Chui H.C., Jagust W.J., Gorno-Tempini M.L., Schuff N. Pattern of cerebral hypoperfusion in Alzheimer disease and mild cognitive impairment measured with arterial spin-labeling MR imaging: initial experience. Radiology. 2005;234:851–859. doi: 10.1148/radiol.2343040197. 15734937 [DOI] [PMC free article] [PubMed] [Google Scholar]
- Kamagata K., Motoi Y., Hori M., Suzuki M., Nakanishi A., Shimoji K., Kyougoku S., Kuwatsuru R., Sasai K., Abe O., Mizuno Y., Aoki S., Hattori N. Posterior hypoperfusion in Parkinson's disease with and without dementia measured with arterial spin labeling MRI. Journal of Magnetic Resonance Imaging: JMRI. 2011;33:803–807. doi: 10.1002/jmri.22515. 21448943 [DOI] [PubMed] [Google Scholar]
- Kobari M., Fukuuchi Y., Shinohara T., Obara K., Nogawa S. Levodopa-induced local cerebral blood flow changes in Parkinson's disease and related disorders. Journal of the Neurological Sciences. 1995;128:212–218. doi: 10.1016/0022-510x(94)00237-i. 7738597 [DOI] [PubMed] [Google Scholar]
- Lee S.J., Kim J.S., Lee K.S., An J.Y., Kim W., Kim Y.I., Kim B.S., Jung S.L. The severity of leukoaraiosis correlates with the clinical phenotype of Parkinson's disease. Archives of Gerontology and Geriatrics. 2009;49:255–259. doi: 10.1016/j.archger.2008.09.005. 18977043 [DOI] [PubMed] [Google Scholar]
- Lieberman M.D., Cunningham W.A. Type I and Type II error concerns in fMRI research: re-balancing the scale. Social Cognitive and Affective Neuroscience. 2009;4:423–428. doi: 10.1093/scan/nsp052. 20035017 [DOI] [PMC free article] [PubMed] [Google Scholar]
- Liu Y., Zhu X., Feinberg D., Guenther M., Gregori J., Weiner M.W., Schuff N. Arterial spin labeling MRI study of age and gender effects on brain perfusion hemodynamics. Magnetic Resonance in Medicine: Official Journal of the Society of Magnetic Resonance in Medicine / Society of Magnetic Resonance in Medicine. 2012;68:912–922. doi: 10.1002/mrm.23286. 22139957 [DOI] [PubMed] [Google Scholar]
- Lu H.Z., Clingman C., Golay X., van Zijl P.C.M. Determining the longitudinal relaxation time (T1) of blood at 3.0 Tesla. Magnetic Resonance in Medicine: Official Journal of the Society of Magnetic Resonance in Medicine / Society of Magnetic Resonance in Medicine. 2004;52:679–682. doi: 10.1002/mrm.20178. 15334591 [DOI] [PubMed] [Google Scholar]
- Ma Y., Huang C., Dyke J.P., Pan H., Alsop D., Feigin A., Eidelberg D. Parkinson's disease spatial covariance pattern: noninvasive quantification with perfusion MRI. Journal of Cerebral Blood Flow and Metabolism: Official Journal of the International Society of Cerebral Blood Flow and Metabolism. 2010;30:505–509. doi: 10.1038/jcbfm.2009.256. 20051975 [DOI] [PMC free article] [PubMed] [Google Scholar]
- MacIntosh B.J., Filippini N., Chappell M.A., Woolrich M.W., Mackay C.E., Jezzard P. Assessment of arterial arrival times derived from multiple inversion time pulsed arterial spin labeling MRI. Magnetic Resonance in Medicine: Official Journal of the Society of Magnetic Resonance in Medicine / Society of Magnetic Resonance in Medicine. 2010;63:641–647. doi: 10.1002/mrm.22256. 20146233 [DOI] [PubMed] [Google Scholar]
- MacIntosh B.J., Lindsay A.C., Kylintireas I., Kuker W., Günther M., Robson M.D., Kennedy J., Choudhury R.P., Jezzard P. Multiple inflow pulsed arterial spin-labeling reveals delays in the arterial arrival time in minor stroke and transient ischemic attack. AJNR. American Journal of Neuroradiology. 2010;31:1892–1894. doi: 10.3174/ajnr.A2008. 20110375 [DOI] [PMC free article] [PubMed] [Google Scholar]
- Mak H.K., Chan Q., Zhang Z., Petersen E.T., Qiu D., Zhang L., Yau K.K., Chu L.W., Golay X. Quantitative assessment of cerebral hemodynamic parameters by QUASAR arterial spin labeling in Alzheimer's disease and cognitively normal elderly adults at 3-tesla. Journal of Alzheimer’s Disease: JAD. 2012;31:33–44. doi: 10.3233/JAD-2012-111877. 22504315 [DOI] [PubMed] [Google Scholar]
- Melzer T.R., Watts R., MacAskill M.R., Pearson J.F., Rüeger S., Pitcher T.L., Livingston L., Graham C., Keenan R., Shankaranarayanan A., Alsop D.C., Dalrymple-Alford J.C., Anderson T.J. Arterial spin labelling reveals an abnormal cerebral perfusion pattern in Parkinson's disease. Brain: A Journal of Neurology. 2011;134:845–855. doi: 10.1093/brain/awq377. 21310726 [DOI] [PMC free article] [PubMed] [Google Scholar]
- Mito Y., Yoshida K., Yabe I., Makino K., Tashiro K., Kikuchi S., Sasaki H. Brain SPECT analysis by 3D-SSP and phenotype of Parkinson's disease. Journal of the Neurological Sciences. 2006;241:67–72. doi: 10.1016/j.jns.2005.10.017. 16352310 [DOI] [PubMed] [Google Scholar]
- Morley J.F., Duda J.E. Parkinson's disease and the risk of cerebrovascular pathology. Movement Disorders: Official Journal of the Movement Disorder Society. 2012;27:1471–1472. doi: 10.1002/mds.25179. 23033113 [DOI] [PubMed] [Google Scholar]
- Müller M.J., Dragicevic A. Standardized rater training for the Hamilton Depression Rating Scale (HAMD-17) in psychiatric novices. Journal of Affective Disorders. 2003;77:65–69. doi: 10.1016/s0165-0327(02)00097-6. 14550936 [DOI] [PubMed] [Google Scholar]
- Nobili F., Frisoni G.B., Portet F., Verhey F., Rodriguez G., Caroli A., Touchon J., Calvini P., Morbelli S., De Carli F., Guerra U.P., Van de Pol L.A., Visser P.-J. Brain SPECT in subtypes of mild cognitive impairment. Findings from the DESCRIPA multicenter study. Journal of Neurology. 2008;255:1344–1353. doi: 10.1007/s00415-008-0897-4. 18958573 [DOI] [PubMed] [Google Scholar]
- O'Sullivan M., Morris R.G., Markus H.S. Brief cognitive assessment for patients with cerebral small vessel disease. Journal of Neurology, Neurosurgery, and Psychiatry. 2005;76:1140–1145. doi: 10.1136/jnnp.2004.045963. 16024894 [DOI] [PMC free article] [PubMed] [Google Scholar]
- Paling D., Thade Petersen E., Tozer D.J., Altmann D.R., Wheeler-Kingshott C.A., Kapoor R., Miller D.H., Golay X. Cerebral arterial bolus arrival time is prolonged in multiple sclerosis and associated with disability. Journal of Cerebral Blood Flow and Metabolism: Official Journal of the International Society of Cerebral Blood Flow and Metabolism. 2014;34:34–42. doi: 10.1038/jcbfm.2013.161. 24045400 [DOI] [PMC free article] [PubMed] [Google Scholar]
- Parkes L.M., [!(%xInRef|ce:surname)!] B.H., Abernethy L.. CBF. Quantification in Infants Using Look-Locker ASL and a Single Blood Compartment Model. Proceedings of the International Society of Magnetic Resonance in Medicine (ISMRM) annual meeting; Melbourne: 2012. [Google Scholar]
- Parkes L.M., Tofts P.S. Improved accuracy of human cerebral blood perfusion measurements using arterial spin labeling: accounting for capillary water permeability. Magnetic Resonance in Medicine: Official Journal of the Society of Magnetic Resonance in Medicine / Society of Magnetic Resonance in Medicine. 2002;48:27–41. doi: 10.1002/mrm.10180. 12111929 [DOI] [PubMed] [Google Scholar]
- Petersen E.T., Zimine I., Ho Y.C., Golay X. Non-invasive measurement of perfusion: a critical review of arterial spin labelling techniques. British Journal of Radiology. 2006;79:688–701. doi: 10.1259/bjr/67705974. 16861326 [DOI] [PubMed] [Google Scholar]
- Roberts D.A., Rizi R., Lenkinski R.E., Leigh J.S. Magnetic resonance imaging of the brain:blood partition coefficient for water: application to spin-tagging measurement of perfusion. Journal of Magnetic Resonance Imaging: JMRI. 1996;6:363–366. doi: 10.1002/jmri.1880060217. 9132103 [DOI] [PubMed] [Google Scholar]
- Sockeel P., Dujardin K., Devos D., Denève C., Destée A., Defebvre L. The Lille apathy rating scale (LARS), a new instrument for detecting and quantifying apathy: validation in Parkinson's disease. Journal of Neurology, Neurosurgery, and Psychiatry. 2006;77:579–584. doi: 10.1136/jnnp.2005.075929. 16614016 [DOI] [PMC free article] [PubMed] [Google Scholar]
- Tomlinson C.L., Stowe R., Patel S., Rick C., Gray R., Clarke C.E. Systematic review of levodopa dose equivalency reporting in Parkinson's disease. Movement Disorders: Official Journal of the Movement Disorder Society. 2010;25:2649–2653. doi: 10.1002/mds.23429. 21069833 [DOI] [PubMed] [Google Scholar]
- Van Den Eeden S.K., Tanner C.M., Bernstein A.L., Fross R.D., Leimpeter A., Bloch D.A., Nelson L.M. Incidence of Parkinson's disease: variation by age, gender, and race/ethnicity. American Journal of Epidemiology. 2003;157:1015–1022. doi: 10.1093/aje/kwg068. 12777365 [DOI] [PubMed] [Google Scholar]
- Vidyasagar R., Greyling A., Draijer R., Corfield D.R., Parkes L.M. The effect of black tea and caffeine on regional cerebral blood flow measured with arterial spin labeling. Journal of Cerebral Blood Flow and Metabolism: Official Journal of the International Society of Cerebral Blood Flow and Metabolism. 2013;33:963–968. doi: 10.1038/jcbfm.2013.40. 23486295 [DOI] [PMC free article] [PubMed] [Google Scholar]
- Wahlund L.O., Barkhof F., Fazekas F., Bronge L., Augustin M., Sjögren M., Wallin A., Ader H., Leys D., Pantoni L., Pasquier F., Erkinjuntti T., Scheltens P. A new rating scale for age-related white matter changes applicable to MRI and CT. Stroke; a Journal of Cerebral Circulation. 2001;32:1318–1322. doi: 10.1161/01.str.32.6.1318. 11387493 [DOI] [PubMed] [Google Scholar]
- Wang J., Alsop D.C., Song H.K., Maldjian J.A., Tang K., Salvucci A.E., Detre J.A. Arterial transit time imaging with flow encoding arterial spin tagging (FEAST) Magnetic Resonance in Medicine: Official Journal of the Society of Magnetic Resonance in Medicine / Society of Magnetic Resonance in Medicine. 2003;50:599–607. doi: 10.1002/mrm.10559. 12939768 [DOI] [PubMed] [Google Scholar]
- Wolk D.A., Detre J.A. Arterial spin labeling MRI: an emerging biomarker for Alzheimer's disease and other neurodegenerative conditions. Current Opinion in Neurology. 2012;25:421–428. doi: 10.1097/WCO.0b013e328354ff0a. 22610458 [DOI] [PMC free article] [PubMed] [Google Scholar]
- Yoon H.J., Park K.W., Jeong Y.J., Kang D.Y. Correlation between neuropsychological tests and hypoperfusion in MCI patients: anatomical labeling using xjView and Talairach daemon software. Annals of Nuclear Medicine. 2012;26:656–664. doi: 10.1007/s12149-012-0625-0. 22777857 [DOI] [PubMed] [Google Scholar]
- Yoshiura T., Hiwatashi A., Noguchi T., Yamashita K., Ohyagi Y., Monji A., Nagao E., Kamano H., Togao O., Honda H. Arterial spin labelling at 3−T MR imaging for detection of individuals with Alzheimer’s disease. European Radiology. 2009;19(12):2819–2825. doi: 10.1007/s00330-009-1511-6. [DOI] [PubMed] [Google Scholar]
- Zaharchuk G. Arterial spin label imaging of acute ischemic stroke and transient ischemic attackNeuroimaging Clinics of North America. 2011;21:285–301. doi: 10.1016/j.nic.2011.01.003. 21640300 [DOI] [PMC free article] [PubMed] [Google Scholar]
- Zappe A.C., Reichold J., Burger C., Weber B., Buck A., Pfeuffer J., Logothetis N.K. Quantification of cerebral blood flow in nonhuman primates using arterial spin labeling and a two-compartment model. Magnetic Resonance Imaging. 2007;25:775–783. doi: 10.1016/j.mri.2006.11.028. 17490842 [DOI] [PubMed] [Google Scholar]
- Zlokovic B.V. The blood–brain barrier in health and chronic neurodegenerative disorders. Neuron. 2008;57:178–201. doi: 10.1016/j.neuron.2008.01.003. 18215617 [DOI] [PubMed] [Google Scholar]