

Abstract
Background
Functional imaging and lesion studies have associated willed behavior with the anterior cingulate cortex (ACC). Abulia is a syndrome characterized by apathy and deficiency of motivated behavior. Abulia is most frequently associated with ACC damage, but also occurs following damage to subcortical nuclei (striatum, globus pallidus, thalamic nuclei). We present resting state functional connectivity MRI (fcMRI) data from an individual who suffered a stroke leading to abulia. We hypothesized that, although structural imaging revealed no damage to the patient's ACC, fcMRI would uncover aberrant function in this region and in the relevant cortical networks.
Methods
Resting state correlations in the patient's gray matter were compared to those of age-matched controls. Using a novel method to identify abnormal patterns of functional connectivity in single subjects, we identified areas and networks with aberrant connectivity.
Results
Networks associated with memory (default mode network) and executive function (cingulo-opercular network) were abnormal. The patient's anterior cingulate was among the areas showing aberrant functional connectivity. In a rescan 3 years later, deficits remained stable and fcMRI findings were replicated.
Conclusions
These findings suggest that the aberrant functional connectivity mapping approach described may be useful for linking stroke symptoms to disrupted network connectivity.
Keywords: Abulia, Executive function, Anterior cingulate, Functional connectivity, fMRI, apathy
Highlights
-
•
A method for single subject functional connectivity analysis is proposed.
-
•
In a case study, resting state fcMRI identifies reproducible disruption that corresponds to clinical deficit.
-
•
Damage to the anterior thalamus results in disrupted functional connectivity in the cingulate cortex.
-
•
Abulia without frontal lesion shows disrupted functional connectivity in the cingulo-opercular and default mode networks.
1. Introduction
Historically, neurologists have struggled to reconcile the principle of functional localization and the observation that the relationship between behavioral deficits and anatomical damage is only partial. A more modern view is that functionality is represented in distributed functional systems and their internal connections. And a growing body of evidence demonstrates that remote dysfunction can occur in regions functionally connected to – but outside of – the area of lesion. Resting state functional connectivity magnetic resonance imaging (fcMRI) can measure widely distributed brain networks and offers a promising avenue of investigation into ways in which injury and disease affect the connectivity of the brain. Numerous studies have found a correspondence between behavioral measures and brain connectivity (Vaidya and Gordon, 2013). Moreover, previous stroke research has shown that deficits within attention networks are predictive of spatial neglect and that deficits in motor networks are predictive of motor deficits (He, 2007; Carter, 2010; Van Meer, 2010). In the present case study of a patient with abulia following stroke, we employ fcMRI to map functional abnormalities by comparison with age-matched controls.
Abulia is characterized by the lack of spontaneous, goal-directed behavior. Clinically, it falls between apathy and akinetic mutism on a continuum of disorders of drive and motivation (Barris and Schuman, 1953). Abulia is most commonly associated with lesions of the anterior cingulate cortex (ACC) (Cohen, 1999). This association is consistent with neuroimaging evidence linking the ACC to the initiation of goal-directed behavior (Carter et al., 1999). However, abulia or some degree of apathy is also caused by subcortical lesions of the anterior thalamus, caudate nucleus, globus pallidus, and internal capsule (for a review of abulia see Vijayaraghavan et al., 2002; Ghoshal et al., 2011; Jorge et al., 2010). It is therefore likely that a more accurate functional localization of abulia, and related deficits of willed behavior, involves a network-level dysfunction. A number of networks (fronto-parietal, cingulo-opercular, ventral attention network) have been recently described in relation to executive control (Corbetta et al., 2008; Dosenbach, 2007; Seeley, 2007; Vincent et al., 2008).
This report describes findings in a patient who developed abulia, anterograde amnesia, and left-sided weakness following multiple small embolic infarcts. The patient sustained small infarcts in various brain regions, but not the ACC. We investigated the neural correlates of abulia in this patient using fcMRI and a novel analytic strategy designed to identify atypical functional connectivity both at specific locations and across brain networks. The method compares observed functional connectivity in individuals against an aged-matched reference group. We hypothesized that this tool would identify atypical functionality in abulia-associated cortical areas that were structurally intact.
2. Case history
A 38-year-old right-handed male lawyer (CS02) presented in the emergency room in December of 2005 with febrile illness and progressive unresponsiveness. The patient was hypoxemic and in septic shock secondary to infectious endocarditis of the aortic and mitral valves. CT and MRI revealed multiple small embolic strokes as well as a left subdural hematoma. CS02 remained in a vegetative state for several weeks. He underwent aortic and mitral valve replacement 6 weeks post-onset, and acute inpatient rehabilitation at the Rehabilitation Institute of St. Louis for about 3 weeks. He continued to show improvements in cognitive function over the subsequent 3 months. FLAIR MRI images taken about 3 months post-onset showed areas of hyper-intensity in the left hippocampal formation, anterior thalamus, and inferior parietal lobe. Other lesions were present in the right occipital lobe, bilateral basal ganglia, right motor cortex, and right cerebellum.
Subsequent evaluations indicated that the patient's residual deficits included abulia, anterograde amnesia, left motor weakness and left homonymous upper quadrantanopia. This clinical picture was stable from May 2006 through the dates of functional imaging and neuropsychological assessment in October 2009 and again in December 2012.
Before the illness, CS02 was a highly intelligent, successful district attorney, with an active social life. He was passionate about history, baseball, and was an excellent golfer. After his illness, he was unable to return to the practice of law or live independently. He currently lives with his parents, manages his own finances, and spends his time reading and watching television. He still enjoys playing golf and remains a skilled golfer. He likes to exercise and will participate in cardio-vascular training if brought to a gymnasium. He is well groomed and socially appropriate, but rarely speaks spontaneously. When addressed, he answers tersely and concretely. His emotional range is restricted with absent or minimal positive or negative affect. He will engage in a game of catch as long as balls are thrown to him. He retains an excellent memory for past events, facts, and pictures, but he has trouble learning new verbal information. He retains an interest in baseball statistics, which he continues to acquire.
For the last 7 years (2006–2013), CS02 has been seen twice a year in the Cognitive Neurology Clinic (Dr. Corbetta). CSO2 has been tried on multiple medications in isolation or combination including dopaminergic agonists (L-Dopa; amantadine); stimulants (methylphenidate; nicotine); a cholinergic agent (donepezil); and, a nootropic agent (piracetam) with no significant change in his behavior.
3. Methods
3.1. Subjects and MRI acquisition and preprocessing
CS02, and 23 control subjects within 10 years of age of the patient and without any neurologic or psychiatric history were studied. All participants provided informed consent in accordance with the Declaration of Helsinki. All study procedures were approved by the Washington University School of Medicine (WUSM) Institutional Review Board. CS02, as well as 14 of the 23 control subjects, underwent a comprehensive neuropsychological and behavioral evaluation in the domains of language, memory, attention, and motor function at the time of the fMRI. CS02 additionally underwent campimetry to identify visual field cuts. All structural and resting state scans were acquired on a Siemens Tim-Trio 3 T Scanner. Scanning parameters were identical for both of the patient's visits and for all controls. Following atlas transformation of all fMRI data, functional connectivity was assessed in CS02 and all controls within a mask that included gray matter voxels and excluded areas of lesion (see Supplementary methods).
3.2. Aberrant functional connectivity
Aberrant functional connectivity (AFC) mapping is a novel approach that compares an individual (i.e., the patient) to healthy controls (see Supplementary methods and Fig. 1 for a detailed description of this approach). Voxel-wise correlation matrices were computed by correlating the time series within each gray-matter voxel (excluding those lesioned in the patient) against all other gray-matter voxels. For each voxel in the patient, the correlation map was compared to that of each control subject using spatial correlation. This comparison generated a t-statistic map representing the degree to which the patient differed from the reference population. To evaluate statistical significance, the same analysis was performed on the controls, treating each of the control subjects as a surrogate patient. The resulting AFC maps were explored using a 1) seed-based analysis and 2) a network-based analysis. In both cases, a t-score threshold (t = 4.8) was chosen to define ‘AFC+’ voxels based on significance after multiple comparisons correction (p = 1.3e−6).
Fig. 1.
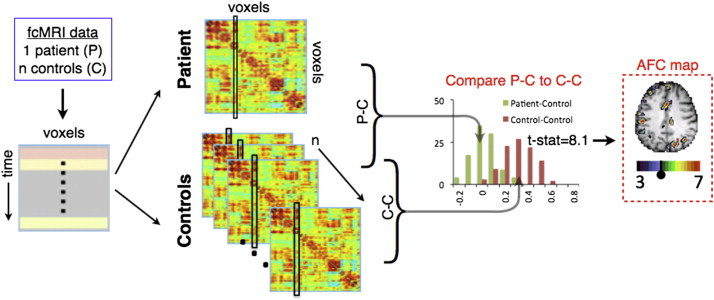
AFC methodology schematic. fcMRI data are acquired, preprocessed, and registered to atlas space. For each subject, a correlation matrix is produced comparing every gray matter voxel to every other gray matter voxel. Each column of the matrix represents one voxel's full connectivity map. Next, every correlation matrix is compared to every other correlation matrix, column-by-column using spatial correlations, producing an (n + 1) × (n + 1) similarity matrix for each gray matter voxel. For each voxel, a Student t-test is computed to determine if 23 P−C similarity values (green) fell outside of the distribution of the n(n − 1) / 2 or 253 C−C similarity values (brown). Finally, the resultant image is overlaid on the patient's anatomical image, creating an aberrant functional connectivity (AFC) map.
The Yeo (2011) seven-network cortical map was used to define networks (Yeo, 2011). Six sub-networks were included: the default mode network (DMN), cingulo-opercular network (CON), motor network, dorsal attention network (DAN), fronto-parietal network (FPN), and visual network. The seventh network was excluded as it is comprised of ventral areas affected by susceptibility inhomogeneity artifact (Ojemann, 1997). The AFC map was thresholded and voxels were tallied according to network affiliation. In the region-based analysis, a peak finding algorithm was applied to the AFC map to define spherical regions of interest (ROIs) that showed significant difference from controls (high AFC scores). ROIs were then used to generate correlation maps. Seed-based correlation maps enabled qualitative inspection of FC abnormalities.
A number of follow-up experiments were run to validate the AFC results. CS02 was brought back for additional functional imaging and neuropsychological testing evaluation 3 years after the initial scan. After masking out non-brain and lesioned voxels, spatial correlation between pairs of AFC maps was computed. Both fcMRI scans were split in half and within-scan correlation (between AFC maps generated with data from halves of the scan) and between-scan (between AFC maps generated 3 years apart) correlations were computed. Additionally, A 2-flourodeoxy-D-glucose (FDG) positron emission tomography (PET) scan of CS02 was obtained using a Siemens EXACT 962 HR+ scanner while the patient was resting with his eyes closed.
4. Results
4.1. Neuropsychological evaluation identified abulia and anterograde amnesia
The patient showed low scores on standardized measures of executive functions, as well as anterograde verbal memory and left-sided motor deficits (Table 1). The patient self-reported mild elevations in apathy and executive dysfunction, but collateral sources reported far more significant apathy. On the basis of these results and clinical evaluation, a diagnosis was made of abulia and moderate anterograde amnesia.
Table 1.
Neuropsychological data. Normalized scores are based on an age and demographic adjusted population with a mean of 50 and a standard deviation of 10. In rows in which two scores are given, the first is performance at scan 1 (2009) and the second is performance at scan 2 (2012). In all other rows, data were only available from 2012. Indices for which the patient fell outside the confidence interval of healthy controls are highlighted. D-KEFS = Delis−Kaplan executive function system; BVMT = brief visuospatial memory test; HVLT = Hopkins verbal learning test.
| Patient score | ||
|---|---|---|
| Self-rating | Apathy | 68 |
| Disinhibition | 58 | |
| Executive dysfunction | 67 | |
| Total Score | 67 | |
| Family rating | Apathy | 110 |
| Disinhibition | 55 | |
| Executive dysfunction | 75 | |
| Total score | 85 | |
| Executive function | Animal naming | 21, 33 |
| WISC-III mazes | 48 | |
| Iowa gambling test | 41 | |
| D-KEFS word context | 47 | |
| D-KEFS tower test | 37 | |
| D-KEFS letter fluency | 33 | |
| Category fluency | 20 | |
| Category switching | 27 | |
| Memory | BVMT total immediate recall | 53, 55 |
| BVMT learning | 60, 47 | |
| BVMT delayed recall | 61, 57 | |
| HVLT learning | 33, 46 | |
| HVLT total immediate recall | 32, 29 | |
| HVLT delayed recall | 13, 18 | |
| HVLT recognition hits | −14, 17 | |
| Spatial span forward | 44, 49 | |
| Spatial span backward | 65, 45 | |
| Motor | Grip strength L hand (kg) | 40, 41 |
| Grip strength R hand (kg) | 56, 46 | |
| 9-Hole peg L (pegs/second) | 28, 21 | |
| 9-Hole peg R (pegs/second) | 63, 61 | |
| Motricity index left leg | −88, −97 | |
| Motricity index right leg | 53, 53 | |
| Combined index FIM walk + timed walk | 15, 15 | |
| Language | Word comprehension | 59, 48 |
| Commands | 53, 53 | |
| Complex ideational material | 60, 2 | |
| Boston naming test | 53, 53 | |
| Oral reading of sentences | 57, 57 | |
| Comprehension of oral reading of sentences | 53, 15 | |
| Nonword reading | 57, 57 | |
| Stem completion | 60, 60 | |
| Attention | Mesulam total misses | 59, 45 |
| Posner RT | 56, 55 | |
| Posner accuracy | 55, 55 | |
| Posner RT VF effect | 56, 57 | |
| Posner RT validity effect | 65, 67 | |
| Social cognition | Affect naming | 50 |
| Prosody comprehension | 57 | |
| Pairs comprehension | 50 | |
| Faces immediate recognition | 33 | |
| Faces delayed recognition | 43 |
4.2. Aberrant functional connectivity (AFC)
Quality control metrics confirmed that atlas registration, fMRI signal properties, subject head motion, and brain-wide functional connectivity were within the range of the 23 controls (Table S1). The ‘patient’ correlation matrix was then compared to ‘control’ correlation matrices (Fig. 1). The patient was individually compared to every control on a column-by-column basis using spatial correlation, thereby producing a patient-to-control (P−C) similarity image (1 × 34,428). The same comparison was computed between every pair of controls, producing n ⋅ (n − 1) / 2 control-to-control C−C similarity images. For each of the 34,428 voxels, a Student t-test was computed comparing P−C values to C−C values. The t-test was chosen after both groups were shown to have normally distributed data (not shown). An image of t-scores throughout the brain could then be overlaid on the patient's anatomical image, creating an aberrant functional connectivity map (AFC map). A t-score threshold (t = 4.8) was chosen to define ‘AFC+’ voxels by calculating significance after multiple comparisons (p = 1.3e−6).
Table S1.
Quality controls. The Abulia patient falls within the normal range of controls for all quality control metrics tested. The atlas registration figure is the spatial correlation between the patients atlas-registered MP-RAGE and the atlas target image. Framewise displacement, DVAR, and SD1 (Power et al., 2014) were calculated after high motion frames were removed.
| Controls (SD) |
Patient visit1, visit2 |
|
|---|---|---|
| Age | 44.8 (8.2) | 43, 46 |
| Atlas Registration | 0.985 (0.004) | 0.984, 0.983 |
| Framewise displacement | 0.159 (0.036) | 0.132, 0.126 |
| DVAR (%) | 2.14 (0.28) | 2.26, 2.20 |
| SD1 | 3.3 (0.69) | 3.0, 3.2 |
| Frames | 530 (219) | 603, 766 |
| RMS Correlation | 0.127 (0.027) | 0.089, 0.127 |
Quality control metrics confirmed that atlas registration, fMRI signal properties, subject head motion, and brain-wide functional connectivity were within the range of the 23 controls (Table S1). The ‘patient’ correlation matrix was then compared to ‘control’ correlation matrices (Fig. 1). The patient was individually compared to every control on a column-by-column basis using spatial correlation, thereby producing a patient-to-control (P−C) similarity image (1 × 34,428). The same comparison was computed between every pair of controls, producing n ⋅ (n − 1) / 2 control-to-control C−C similarity images. For each of the 34,428 voxels, a Student t-test was computed comparing P−C values to C−C values. The t-test was chosen after both groups were shown to have normally distributed data (not shown). An image of t-scores throughout the brain could then be overlaid on the patient's anatomical image, creating an aberrant functional connectivity map (AFC map). A t-score threshold (t = 4.8) was chosen to define ‘AFC+’ voxels by calculating significance after multiple comparisons (p = 1.3e−6).
Inline Supplementary Table S1.
Inline Supplementary Table S1 can be found online at http://dx.doi.org/10.1016/j.nicl.2014.09.012.
Fig. 2B shows the patient's AFC t-score map. Overall, the patient showed greater number of AFC+ voxels than 22 out of the 23 controls (Fig. S1B). Areas of aberrant functional connectivity (AFC+) were observed near as well as distant to structural lesions. Regions showing aberrant functional connectivity included the left hippocampus, left thalamus surrounding the thalamic lesion, left inferior parietal lobule, and anterior cingulate cortex.
Fig. 2.
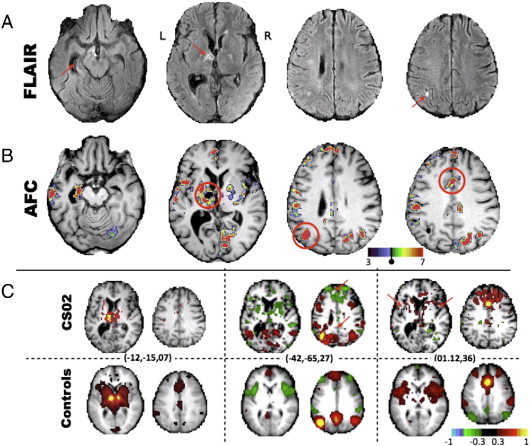
FLAIR, aberrant functional connectivity (AFC) map, and correlation maps demonstrate lesion−dysfunction relationship and functional connectivity changes. A) FLAIR images with red arrows highlighting a lesion in the left anterior thalamus and micro-infarcts elsewhere. Atrophy of the left hippocampus is also evident. B) AFC map, produced using the aberrant functional connectivity method, demonstrates multiple foci of abnormality. Voxels masked out due to structural damage are shown in black (i.e., the left anterior thalamus). C) Correlation maps demonstrate aberrant functional connectivity. Peaks in the AFC map (circled in B) are used as seeds to generate whole-brain connectivity maps (no lesion mask) for CS02 (top) and average connectivity maps for the 23 controls (bottom). Talairach coordinates for each correlation map are given in parenthesis. Left: a correlation map placed at the center of the lesion in controls illustrates ACC connectivity. CS02 demonstrates the expected absence of functional connectivity. Middle and right: red arrows highlight areas of connectivity dropout in the patient.
Fig. S1.
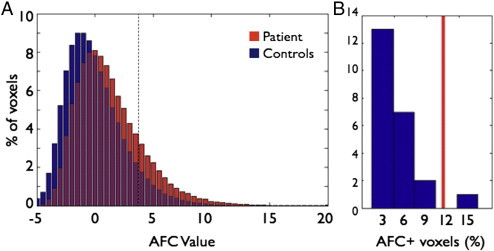
AFC t-value distribution in CS02 and in the 23 controls. Both figures use CS02's AFC scores averaged between the initial scan and revisit. A) Negative values indicate that the patient−control difference is less than the control–control difference and thus are essentially meaningless. Positive values above t = 4.8 indicate voxels for which the patient−control difference is significantly greater than the control–control difference. As expected we see a skew to the right. A test that CS02's AFC distribution showed a greater degree of rightward skewness than controls trended towards significance (p = 0.0565, df = 23). B) Histogram of the total percent of voxels that surpass t = 4.8 (indicated by the dashed line in A) in the 23 controls and in CS02 (red line). CS02 has a greater number of AFC+ voxels than 22 of the 23 controls.
Fig. 2B shows the patient's AFC t-score map. Overall, the patient showed greater number of AFC+ voxels than 22 out of the 23 controls (Fig. S1B). Areas of aberrant functional connectivity (AFC+) were observed near as well as distant to structural lesions. Regions showing aberrant functional connectivity included the left hippocampus, left thalamus surrounding the thalamic lesion, left inferior parietal lobule, and anterior cingulate cortex.
4.3. Seed-based correlation mapping
A subset of AFC+ regions (red circles in Fig. 2B) was selected to represent resting state networks that, in subsequent analyses, were shown to be especially aberrant in this patient. These regions were used to generate correlations maps to elucidate changes to functional connectivity patterns in AFC+ regions (Fig. 2C). The left panel in Fig. 2C shows the correlation map corresponding to a seed in the lesioned left thalamus. The result obtained in the controls demonstrates functional connectivity with the anterior cingulate cortex in addition to the homotopic thalamus. By comparison, the result obtained in CS02 demonstrates the expected absence of functional connectivity. The middle panel shows maps obtained with a seed in the inferior parietal lobule. Controls show a well-defined DMN including anticorrelations with the cingulo-opercular network (CON). CS02 shows a less well-defined DMN with abnormal anticorrelation between the IPL and the frontal pole. The right panel shows maps obtained with a seed in the ACC. Controls show a well-defined CON, with strong bilateral anterior insula functional connectivity with the dorsal ACC. None of these features are evident in CS02. Instead, CS02 shows diffuse connectivity with anterior portions of the frontal lobe. For comparison, some single control subject correlation maps are shown in Fig. S3. Fig. S3 additionally shows connectivity from the AFC+ left anterior thalamus is disrupted for CS02 relative controls.
Fig. S3.
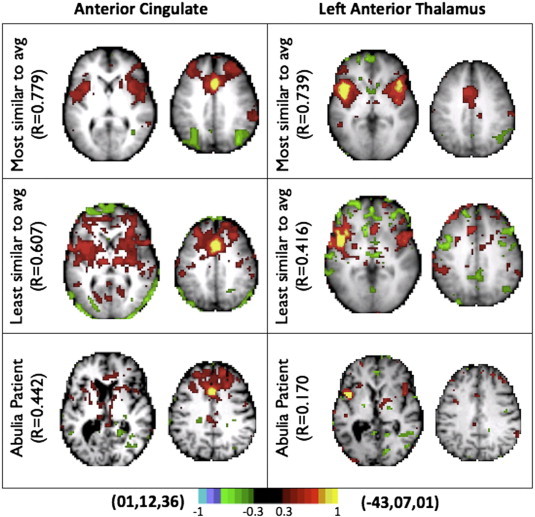
Individual correlation maps, obtained with the ACC seed used in the right panel of Fig. 1C. On top is the control subject closest to the mean, below is the control subject furthest from the mean, CS02 is on the bottom. CS02 falls outside the range defined by the control group.
A subset of AFC+ regions (red circles in Fig. 2B) was selected to represent resting state networks that, in subsequent analyses, were shown to be especially aberrant in this patient. These regions were used to generate correlations maps to elucidate changes to functional connectivity patterns in AFC+ regions (Fig. 2C). The left panel in Fig. 2C shows the correlation map corresponding to a seed in the lesioned left thalamus. The result obtained in the controls demonstrates functional connectivity with the anterior cingulate cortex in addition to the homotopic thalamus. By comparison, the result obtained in CS02 demonstrates the expected absence of functional connectivity. The middle panel shows maps obtained with a seed in the inferior parietal lobule. Controls show a well-defined DMN including anticorrelations with the cingulo-opercular network (CON). CS02 shows a less well-defined DMN with abnormal anticorrelation between the IPL and the frontal pole. The right panel shows maps obtained with a seed in the ACC. Controls show a well-defined CON, with strong bilateral anterior insula functional connectivity with the dorsal ACC. None of these features are evident in CS02. Instead, CS02 shows diffuse connectivity with anterior portions of the frontal lobe. For comparison, some single control subject correlation maps are shown in Fig. S3. Fig. S3 additionally shows connectivity from the AFC+ left anterior thalamus is disrupted for CS02 relative controls.
4.4. Network-based analysis
Distribution of AFC+ voxels across a seven network parcellations was assessed. Results were averaged between the patient's two visits and compared to averages across the 23 controls (Yeo, 2011). When measured as percentage of network disrupted, the left default, bilateral cingulo-opercular, right motor network, and right visual network showed significant abnormality compared to controls (Fig. 3). In controls, roughly 5% of voxels were above the AFC+ threshold. On average, these were evenly distributed across the resting state networks.
Fig. 3.
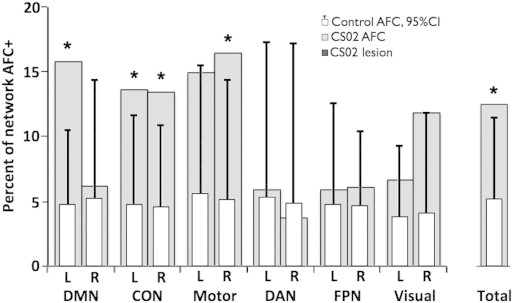
Left DMN, CON, and motor networks show the largest degree of disruption. Voxels with significant AFC scores are classified based on the seven-network parcellation of Yeo (2011). Networks are additionally split by hemisphere (hemi-networks). In order to account for difference in network sizes, results are displayed as the percent of each network with AFC t-score greater than 4.8. Light gray bars display CS02 AFC results averaged over visits 1 and 2. White bars represent the network breakdown of aberrant functional connectivity in the 23 controls. Error lines represent upper 95% confidence intervals. Asterisks indicate hemi-networks in which CS02 shows disruption outside of the 95% CI of controls. The parcellation includes default mode network (DMN), cingulo-opercular network (CON), motor network, dorsal attention network (DAN), fronto-parietal network (FPN), and visual network. The total percent of AFC+ voxels in the patient and controls is shown in the far right.
4.5. Rescan and within-scan validation
The within-scan spatial correlation was 0.81 and 0.80 for visits one and two respectively. The between-scan (3 years apart) spatial correlation was 0.60. Dominant patterns of aberrant functional connectivity remained qualitatively similar (Fig. 4A). For comparison, spatial correlation between control subjects' AFC maps was measured. Spatial correlation between pairs of controls was 0.01 (s.d. = 0.07), demonstrating that within-scan and between-scan correlation for CS02 is well above between-subject correlation (Fig. 4B). These results show that AFC results in CS02 are consistent and reproducible.
Fig. 4.
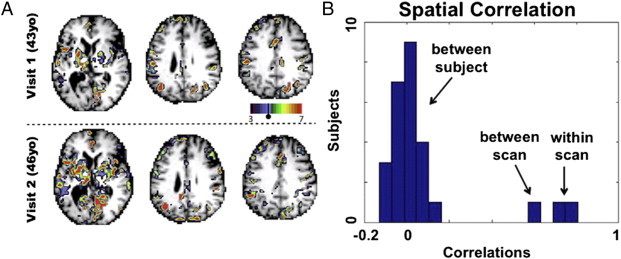
Reproducibility of AFC maps at 3 year follow up. A) A visual comparison of AFC results from visit 1 and visit 2. The Pearson correlation between AFC maps is 0.5937. B) Pearson correlations for CS02 between AFC maps generated from half scans (‘within scan’) and AFC maps generated 3 years apart (‘between scan’) are shown and spatial correlation between different control subjects' AFC maps (‘between subjects’) is given as a control. Correlations between halves were 0.81 and 0.80 for visits 1 and 2 respectively.
AFC t-score distributions were generated for both scans of CS02 (Fig. S1) and for controls. A t-test comparing rightward skewness between CS02 (both scans) and 23 controls yielded p = 0.0565 (t = 1.6579, df = 23). This result means that the number of AFC+ voxels throughout the brain of CS02 was greater than that of controls, although the difference did not reach statistical significance.
AFC t-score distributions were generated for both scans of CS02 (Fig. S1) and for controls. A t-test comparing rightward skewness between CS02 (both scans) and 23 controls yielded p = 0.0565 (t = 1.6579, df = 23). This result means that the number of AFC+ voxels throughout the brain of CS02 was greater than that of controls, although the difference did not reach statistical significance.
Inline Supplementary Figure S1.
Inline Supplementary Fig. S1 can be found online at http://dx.doi.org/10.1016/j.nicl.2014.09.012.
4.6. Positron emission tomography
FDG PET scans were acquired to compare functional connectivity to metabolic activity (Fig. S2). No significant relationship between PET-FDG and AFC scores was observed (p-value = 0.274).
Fig. S2.
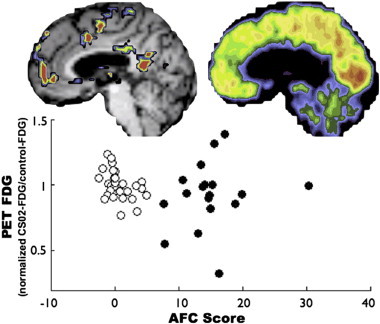
AFC scores did not correlate with regional glucose metabolism. The open circles represent PET FDG values in CS02 in a set of canonical ROIs (Brier et al., 2012) excluding those overlapping structural lesions and positive AFC values. The PET FDG values have been normalized such that a value of 1 represents the mean in a separate cohort of 33 control subjects. The black circles represent 18 AFC peak ROIs. Note no correlation between increased AFC and glucose metabolism.
FDG PET scans were acquired to compare functional connectivity to metabolic activity (Fig. S2). No significant relationship between PET-FDG and AFC scores was observed (p-value = 0.274).
Inline Supplementary Figure S2.
Inline Supplementary Fig. S2 can be found online at http://dx.doi.org/10.1016/j.nicl.2014.09.012.
5. Discussion
Abulia is most commonly associated with lesions of the anterior cingulate cortex (ACC), but also has been described in association with a variety of subcortical lesions (Vijayaraghavan et al., 2002; Ghoshal et al., 2011; Jorge et al., 2010). These observations raise the question of whether common circuitry is disrupted by both types of lesion. It has been suggested that disconnections of limbic tracts projecting from the anterior thalamus to the cingulate might cause abulia (Mega and Cummings, 1994; Mega and Cohenour, 1997). This is the first study to directly support this hypothesis. Our findings suggest that, even in the absence of cingulate damage, abulia with anterograde amnesia is associated with disruption of functional network organization including the cingulate cortex. Furthermore, among the various recently proposed ‘executive’ networks (Corbetta et al., 2008; Dosenbach, 2007; Seeley, 2007; Vincent et al., 2008), AFC identified the cingulo-opercular network as most closely affected in a case in which motivational behavior is severely disrupted.
5.1. Case summary — links to behavior
CS02 sustained multiple embolic strokes that resulted in profound abulia, anterograde amnesia, left motor weakness, and left homonymous upper quadrantanopia. Some of these deficits could be explained in terms of focal damage (i.e., left hippocampal atrophy and anterograde amnesia). With respect to abulia the link was less clear. We speculate that the patient's neurologic status is better characterized by network-level disruption of functional organization, and not just for abulia. The association of right motor network AFC with left hemiparesis and of right visual network AFC with a left visual field cut seems apparent. The resting state network correlates of abulia and amnesia likely involve multiple networks and cannot be determined on the basis of a single case that is clinically complex. Possible implications of default mode network and cingulo-opercular network disruption are considered below.
Some AFC+ peaks were adjacent to structural lesions; but others, such as left lateral posterior parietal cortex and dorsal ACC, were not. Elevated AFC scores could result from disconnection caused by damaged cortex or white matter tracts, but correlation maps from AFC peaks suggest that this is not the case. For example, functional connections between ACC and bilateral insula were disrupted despite the absence of direct damage to ACC, insula, or the interconnecting white matter tracts. Similar considerations apply to inferior parietal lobule and ventromedial prefrontal cortex (Fig. 2C).
5.2. Cingulo-opercular network (CON)
The CON includes the anterior cingulate, bilateral anterior insula, and bilateral anterior thalami (Corbetta et al., 2008; Dosenbach, 2007; Seeley, 2007; Vincent et al., 2008). This network is partially overlapping with other networks putatively related to executive control: fronto-parietal, ventral attention network, and salience network. The CON is implicated in task initiation, task switching, and conflict monitoring. FC strength between the ACC and the rest of the CON directly correlates with performance on a range of executive function tasks involving working memory, attention, inhibitory control, fluency, and task switching (Onoda et al., 2012).
The anterior cingulate receives input from the anterior thalamus (Papez, 1937) and has been associated with willed action across a variety of paradigms and a variety of imaging modalities (Carter et al., 1999; Bush et al., 2000; Jahanshahi, 1998). Theoretical models of willed action have been formulated in terms of exploration of the environment (Swanson, 2000) and determining actions necessary to obtain desired goals (Carter et al., 1999; Luu et al., 2003). A recent report in patients with implanted electrodes indicates that stimulation of dorsal ACC cortex leads to ‘feelings of strong motivation and willingness’ (Parvizi et al., 2013). Our patient demonstrates the converse; functional disruption of the ACC has led to an amotivational state. Together, these findings highlight the critical role of the ACC, and CO network, in willed action.
Inline Supplementary Figure S3.
Inline Supplementary Fig. S3 can be found online at http://dx.doi.org/10.1016/j.nicl.2014.09.012.
5.3. Default mode network
The DMN is implicated in introspection, prospection, social cognition and memory (for a review see Buckner et al., 2008). Previous work has shown that the hippocampus is functionally coupled within the DMN (Vincent et al., 2006), and DMN resting state functional connectivity has consistently shown association with memory encoding and recall (Sestieri et al., 2011). Changes to DMN functional connectivity have been observed in amnesic patients (Hayes et al., 2012) and reduced DMN connectivity has been reported in patients with memory-associated conditions such as Alzheimer's disease (Greicius et al., 2004). A prior study on a case of abulia and amnesia similarly found decreased ipsilateral default network connectivity (Jones, 2011). Interestingly, cases of left anterior thalamic lesions causing abulia appear to consistently show comorbid memory deficit (Nishio et al., 2011). Our interpretation is that disruption of DMN functional connectivity is related to the patient's anterograde amnesia. The patient's DMN AFC was lateralized to the left hemisphere. Correspondingly, CS02 exhibits a verbal memory deficit, but not a visuospatial memory deficit (Table 1) (Kelley et al., 1998).
5.4. Limitations and conclusions
This paper demonstrates the use of fcMRI in an individual. Challenges to such an approach arise from normal individual variability in brain function and brain anatomy. But recent work has shown that reliable identification of resting state network topography within individuals is possible (Hacker et al., 2013; Mennes, 2010). To the extent that normality can be defined in resting state network terms, fcMRI can potentially offer a non-invasive tool for identifying disruption to function and network structure. Not withstanding these advantages, a single case is insufficient to demonstrate a link between network dysfunction and clinical deficit.
Our approach was inspired by Stufflebeam et al. (2011), who identified epileptogenic foci in individuals by comparing each voxel's local and global connectedness to that of controls. Although conceptually similar, our approach differs in that the spatial pattern of functional connectivity of a given region (functional connectivity ‘fingerprint’) is compared to controls. This strategy allows for the possibility that a region's functional connectivity fingerprint may be altered despite no change in sum connectedness. Further comparisons are needed to determine the extent to which ‘aberrant’ regions identified by these approaches differ.
The patient presented herein had multiple lesions and structural changes. Structural alterations make registration challenging. However, in our experience, adequate atlas transformation (misregistration < 2 mm) is possible even in cases with large lesions provided that the lesion is segmented and masked out of the registration computations (He, 2007). AFC+ regions (Fig. S2) had normal FDG PET scores, suggesting that these regions were in gray matter, and therefore, not identified as abnormal owing to misregistration.
The patient presented herein had multiple lesions and structural changes. Structural alterations make registration challenging. However, in our experience, adequate atlas transformation (misregistration < 2 mm) is possible even in cases with large lesions provided that the lesion is segmented and masked out of the registration computations (He, 2007). AFC+ regions (Fig. S2) had normal FDG PET scores, suggesting that these regions were in gray matter, and therefore, not identified as abnormal owing to misregistration.
Our patient's total AFC score fell within the tail of the control distribution (Fig. S1B). However, we have not here demonstrated that this measure can reliably distinguish patients from controls. We attribute this limitation to the small sample size, limited signal to noise ratio of functional connectivity data, and natural variability within the population (Mueller, 2013). A much larger subject sample would be needed to determine if the AFC approach can be used to differentiate affected individuals from the normal population. Future technical improvements in resting state fMRI (Uğurbil, 2013) most likely will contribute to making the AFC approach more robust.
Our patient's total AFC score fell within the tail of the control distribution (Fig. S1B). However, we have not here demonstrated that this measure can reliably distinguish patients from controls. We attribute this limitation to the small sample size, limited signal to noise ratio of functional connectivity data, and natural variability within the population (Mueller, 2013). A much larger subject sample would be needed to determine if the AFC approach can be used to differentiate affected individuals from the normal population. Future technical improvements in resting state fMRI (Uğurbil, 2013) most likely will contribute to making the AFC approach more robust.
Nevertheless, our AFC technique reproducibly localized aberrant functional connectivity within an individual (Fig. 4). We believe that AFC has illuminated the pathophysiology of abulia in a patient without ACC structural damage. Moreover, our results illustrate the utility of functional imaging as a means of improving the understanding of neurologic deficits.
Acknowledgements
The authors disclose receipt of the following financial support for the research and/or authorship of this article: this study was supported by the National Institute of Health National Research Science award 5T32GM007200-39, and National Institute of Mental Health 5R01HD061117-07 and the National Institute of Health Medical Scientist training award 5T32GM007200-40. Additional thanks to Lenny Ramsey, Jonathan Power, Gagan Wig, and Tim Laumann for guidance and code and Jennifer Rengachary for technical assistance (all in Washington University Department of Neurology).
Contributor Information
J.S. Siegel, Email: siegelj@wusm.wustl.edu.
A.Z. Snyder, Email: avi@npg.wustl.edu.
N.V. Metcalf, Email: metcalfn@npg.wustl.edu.
R.P. Fucetola, Email: fucetolar@neuro.wustl.edu.
C.D. Hacker, Email: hackerc@wusm.wustl.edu.
J.S. Shimony, Email: shimonyj@mir.wustl.edu.
G.L. Shulman, Email: gordon@npg.wustl.edu.
M. Corbetta, Email: mau@npg.wustl.edu.
Appendix A. Supplementary data
Supplementary material.
References
- Barris R.W., Schuman H.R. Bilateral anterior cingulate gyrus lesions. Syndrome of the anterior cingulate gyri. Neurology. 1953;3:44–52. doi: 10.1212/wnl.3.1.44. 13013498 [DOI] [PubMed] [Google Scholar]
- Buckner R.L., Andrews-Hanna J.R., Schacter D.L. The brain's default network: anatomy, function, and relevance to disease. Annals of the New York Academy of Sciences. 2008;1124:1–38. doi: 10.1196/annals.1440.011. 18400922 [DOI] [PubMed] [Google Scholar]
- Bush G., Luu P., Posner M.I. Cognitive and emotional influences in anterior cingulate cortex. Trends in Cognitive Sciences. 2000;4:215–222. doi: 10.1016/s1364-6613(00)01483-2. 10827444 [DOI] [PubMed] [Google Scholar]
- Carter A.R. Resting interhemispheric functional magnetic resonance imaging connectivity predicts performance after stroke. Annals of Neurology. 2010;67:365–375. doi: 10.1002/ana.21905. 20373348 [DOI] [PMC free article] [PubMed] [Google Scholar]
- Carter C.S., Botvinick M.M., Cohen J.D. The contribution of the anterior cingulate cortex to executive processes in cognition. Reviews in the Neurosciences. 1999;10:49–57. doi: 10.1515/revneuro.1999.10.1.49. 10356991 [DOI] [PubMed] [Google Scholar]
- Cohen R.A. Alteration of intention and self-initiated action associated with bilateral anterior cingulotomy. Journal of Neuropsychiatry and Clinical Neurosciences. 1999;11:444–453. doi: 10.1176/jnp.11.4.444. 10570756 [DOI] [PubMed] [Google Scholar]
- Corbetta M., Patel G., Shulman G.L. The reorienting system of the human brain: from environment to theory of mind. Neuron. 2008;58:306–324. doi: 10.1016/j.neuron.2008.04.017. 18466742 [DOI] [PMC free article] [PubMed] [Google Scholar]
- Dosenbach N.U.F. Distinct brain networks for adaptive and stable task control in humans. Proceedings of the National Academy of Sciences of the United States of America. 2007;104:11073–11078. doi: 10.1073/pnas.0704320104. 17576922 [DOI] [PMC free article] [PubMed] [Google Scholar]
- Ghoshal S., Gokhale S., Rebovich G., Caplan L.R. The neurology of decreased activity: abulia. Reviews in Neurological Diseases. 2011;8:e55–e67. 22249571 [PubMed] [Google Scholar]
- Greicius M.D., Srivastava G., Reiss A.L., Menon V. Default-mode network activity distinguishes Alzheimer's disease from healthy aging: evidence from functional MRI. Proceedings of the National Academy of Sciences of the United States of America. 2004;101:4637–4642. doi: 10.1073/pnas.0308627101. 15070770 [DOI] [PMC free article] [PubMed] [Google Scholar]
- Hacker C.D., Laumann T.O., Szrama N.P., Baldassarre A., Snyder A.Z. Resting state network estimation in individual subjects. Neuroimage. 2013;82(82):616–633. doi: 10.1016/j.neuroimage.2013.05.108. 23735260 [DOI] [PMC free article] [PubMed] [Google Scholar]
- Hayes S.M., Salat D.H., Verfaellie M., Default Network Connectivity in Medial Temporal Lobe Amnesia Default network connectivity in medial temporal lobe amnesia. Journal of Neuroscience: the Official Journal of the Society for Neuroscience. 2012;32:14622–14629a. doi: 10.1523/JNEUROSCI.0700-12.2012. 23077048 [DOI] [PMC free article] [PubMed] [Google Scholar]
- He B.J. Breakdown of functional connectivity in frontoparietal networks underlies behavioral deficits in spatial neglect. Neuron. 2007;53:905–918. doi: 10.1016/j.neuron.2007.02.013. 17359924 [DOI] [PubMed] [Google Scholar]
- Jahanshahi M. Willed action and its impairments. Cognitive Neuropsychology. 1998;15:483–533. doi: 10.1080/026432998381005. 22448836 [DOI] [PubMed] [Google Scholar]
- Jones D.T. Default mode network disruption secondary to a lesion in the anterior thalamus. Archives of Neurology. 2011;68:242–247. doi: 10.1001/archneurol.2010.259. 20937938 [DOI] [PubMed] [Google Scholar]
- Jorge R.E., Starkstein S.E., Robinson R.G. Apathy following stroke. Canadian Journal of Psychiatry. Revue Canadienne de Psychiatrie. 2010;55:350–354. doi: 10.1177/070674371005500603. 20540829 [DOI] [PubMed] [Google Scholar]
- Kelley W.M. Hemispheric specialization in human dorsal frontal cortex and medial temporal lobe for verbal and nonverbal memory encoding. Neuron. 1998;20:927–936. doi: 10.1016/s0896-6273(00)80474-2. 9620697 [DOI] [PubMed] [Google Scholar]
- Luu P., Tucker D.M., Derryberry D., Reed M., Poulsen C. Electrophysiological responses to errors and feedback in the process of action regulation. Psychological Science. 2003;14:47–53. doi: 10.1111/1467-9280.01417. 12564753 [DOI] [PubMed] [Google Scholar]
- Mega M.S., Cohenour R.C. Akinetic mutism: disconnection of frontal–subcortical circuits. Neuropsychiatry, Neuropsychology, and Behavioral Neurology. 1997;10:254–259. 9359123 [PubMed] [Google Scholar]
- Mega M.S., Cummings J.L. Frontal–subcortical circuits and neuropsychiatric disorders. Journal of Neuropsychiatry and Clinical Neurosciences. 1994;6:358–370. doi: 10.1176/jnp.6.4.358. 7841807 [DOI] [PubMed] [Google Scholar]
- Mennes M. Inter-individual differences in resting-state functional connectivity predict task-induced BOLD activity. Neuroimage. 2010;50:1690–1701. doi: 10.1016/j.neuroimage.2010.01.002. 20079856 [DOI] [PMC free article] [PubMed] [Google Scholar]
- Mueller S. Individual variability in functional connectivity architecture of the human brain. Neuron. 2013;77:586–595. doi: 10.1016/j.neuron.2012.12.028. 23395382 [DOI] [PMC free article] [PubMed] [Google Scholar]
- Nishio Y., Hashimoto M., Ishii K., Mori E. Neuroanatomy of a neurobehavioral disturbance in the left anterior thalamic infarction. Journal of Neurology, Neurosurgery, and Psychiatry. 2011;82:1195–1200. doi: 10.1136/jnnp.2010.236463. 21515557 [DOI] [PMC free article] [PubMed] [Google Scholar]
- Ojemann J.G. Anatomic localization and quantitative analysis of gradient refocused Echo-planar fMRI susceptibility artifacts. Neuroimage. 1997;6:156–167. doi: 10.1006/nimg.1997.0289. 9344820 [DOI] [PubMed] [Google Scholar]
- Onoda K., Ishihara M., Yamaguchi S. Decreased functional connectivity by aging is associated with cognitive decline. Journal of Cognitive Neuroscience. 2012;24:2186–2198. doi: 10.1162/jocn_a_00269. 22784277 [DOI] [PubMed] [Google Scholar]
- Papez J.W. A proposed mechanism of emotion. Archives of Neurology and Psychiatry. 1937;38:725–743. [Google Scholar]
- Parvizi J., Rangarajan V., Shirer W.R., Desai N., Greicius M.D. The will to persevere induced by electrical stimulation of the human cingulate gyrus. Neuron. 2013;80:1359–1367. doi: 10.1016/j.neuron.2013.10.057. 24316296 [DOI] [PMC free article] [PubMed] [Google Scholar]
- Power J.D. Methods to detect, characterize, and remove motion artifact in resting state fMRI. Neuroimage. 2014;84:320–341. doi: 10.1016/j.neuroimage.2013.08.048. 23994314 [DOI] [PMC free article] [PubMed] [Google Scholar]
- Seeley W.W. Dissociable intrinsic connectivity networks for salience processing and executive control. Journal of Neuroscience: the Official Journal of the Society for Neuroscience. 2007;27:2349–2356. doi: 10.1523/JNEUROSCI.5587-06.2007. 17329432 [DOI] [PMC free article] [PubMed] [Google Scholar]
- Sestieri C., Corbetta M., Romani G.L., Shulman G.L. Episodic memory retrieval, parietal cortex, and the default mode network: functional and topographic analyses. Journal of Neuroscience: the Official Journal of the Society for Neuroscience. 2011;31:4407–4420. doi: 10.1523/JNEUROSCI.3335-10.2011. 21430142 [DOI] [PMC free article] [PubMed] [Google Scholar]
- Stufflebeam S.M. Localization of focal epileptic discharges using functional connectivity magnetic resonance imaging. Journal of Neurosurgery. 2011;114:1693–1697. doi: 10.3171/2011.1.JNS10482. 21351832 [DOI] [PMC free article] [PubMed] [Google Scholar]
- Swanson L.W. Cerebral hemisphere regulation of motivated behavior. Brain Research. 2000;886:113–164. doi: 10.1016/s0006-8993(00)02905-x. 11119693 [DOI] [PubMed] [Google Scholar]
- Uğurbil K. Pushing spatial and temporal resolution for functional and diffusion MRI in the Human Connectome Project. Neuroimage. 2013;80:80–104. doi: 10.1016/j.neuroimage.2013.05.012. 23702417 [DOI] [PMC free article] [PubMed] [Google Scholar]
- Vaidya C.J., Gordon E.M. Phenotypic variability in resting-state functional connectivity: current status. Brain Connectivity. 2013;3:99–120. doi: 10.1089/brain.2012.0110. 23294010 [DOI] [PMC free article] [PubMed] [Google Scholar]
- Van Meer M.P. Recovery of sensorimotor function after experimental stroke correlates with restoration of resting-state interhemispheric functional connectivity. Journal of Neuroscience: the Official Journal of the Society for Neuroscience. 2010;30:3964–3972. doi: 10.1523/JNEUROSCI.5709-09.2010. 20237267 [DOI] [PMC free article] [PubMed] [Google Scholar]
- Vijayaraghavan L., Krishnamoorthy E.S., Brown R.G., Trimble M.R. Abulia: a Delphi survey of British neurologists and psychiatrists. Movement Disorders: Official Journal of the Movement Disorder Society. 2002;17:1052–1057. doi: 10.1002/mds.10194. 12360558 [DOI] [PubMed] [Google Scholar]
- Vincent J.L. Coherent spontaneous activity identifies a hippocampal−parietal memory network. Journal of Neurophysiology. 2006;96:3517–3531. doi: 10.1152/jn.00048.2006. 16899645 [DOI] [PubMed] [Google Scholar]
- Vincent J.L., Kahn I., Snyder A.Z., Raichle M.E., Buckner R.L. Evidence for a frontoparietal control system revealed by intrinsic functional connectivity. Journal of Neurophysiology. 2008;100:3328–3342. doi: 10.1152/jn.90355.2008. 18799601 [DOI] [PMC free article] [PubMed] [Google Scholar]
- Yeo B.T.T. The organization of the human cerebral cortex estimated by intrinsic functional connectivity. Journal of Neurophysiology. 2011;106:1125–1165. doi: 10.1152/jn.00338.2011. 21653723 [DOI] [PMC free article] [PubMed] [Google Scholar]
Associated Data
This section collects any data citations, data availability statements, or supplementary materials included in this article.
Supplementary Materials
Supplementary material.