

Abstract
Major depressive disorder (MDD) has previously been linked to structural changes in several brain regions, particularly in the medial temporal lobes (Bellani, Baiano, Brambilla, 2010; Bellani, Baiano, Brambilla, 2011). This has been determined using voxel-based morphometry, segmentation algorithms, and analysis of shape deformations (Bell-McGinty et al., 2002; Bergouignan et al., 2009; Posener et al., 2003; Vasic et al., 2008; Zhao et al., 2008): these are methods in which information related to the shape and the pose (the size, and anatomical position and orientation) of structures is lost. Here, we incorporate information about shape and pose to measure structural deformation in adolescents and young adults with and without depression (as measured using the Beck Depression Inventory and Diagnostic and Statistical Manual of Mental Disorders criteria). As a hypothesis-generating study, a significance level of p < 0.05, uncorrected for multiple comparisons, was used, so that subtle morphological differences in brain structures between adolescent depressed individuals and control participants could be identified. We focus on changes in cortical and subcortical temporal structures, and use a multi-object statistical pose and shape model to analyze imaging data from 16 females (aged 16–21) and 3 males (aged 18) with early-onset MDD, and 25 female and 1 male normal control participants, drawn from the same age range. The hippocampus, parahippocampal gyrus, putamen, and superior, inferior and middle temporal gyri in both hemispheres of the brain were automatically segmented using the LONI Probabilistic Brain Atlas (Shattuck et al., 2008) in MNI space. Points on the surface of each structure in the atlas were extracted and warped to each participant's structural MRI. These surface points were analyzed to extract the pose and shape features. Pose differences were detected between the two groups, particularly in the left and right putamina, right hippocampus, and left and right inferior temporal gyri. Shape differences were detected between the two groups, particularly in the left hippocampus and in the left and right parahippocampal gyri. Furthermore, pose measures were significantly correlated with BDI score across the whole (clinical and control) sample. Since the clinical participants were experiencing their very first episodes of MDD, morphological alteration in the medial temporal lobe appears to be an early sign of MDD, and is unlikely to result from treatment with antidepressants. Pose and shape measures of morphology, which are not usually analyzed in neuromorphometric studies, appear to be sensitive to depressive symptomatology.
Keywords: Pose, Shape, Adolescent depression, Multi-object statistical analysis, Structural MRI
1. Introduction
Depression directly affects more than 10% of the population at some point in their lives (World Health Organization, 2004), and is a leading cause of disability, with significant social, health and economic impacts (Olesen et al., 2012). Major Depressive Disorder (MDD) has a typical onset in adolescence and young adulthood, and prevalence rates of MDD by late adolescence equal those in adulthood (Kessler and Walters, 1998). MDD that starts in adolescence is associated with a large number of negative outcomes, including lower educational and occupational attainment, poor physical health, and poor interpersonal functioning (Kandel and Davies, 1986). These outcomes persist into adulthood and predict significant risk for a lifelong pattern of illness (Birmaher et al., 1999). Given the enormous personal and societal costs associated with MDD, studies aimed at uncovering the pathology of the disorder in its earliest stages are crucial to informing effective prevention and intervention efforts.
Our understanding of the changes in brain neuroanatomy that are associated with MDD have benefited greatly from important advances in Magnetic Resonance Imaging (MRI) technology in the past two decades. Using structural MRI techniques in adult samples, differences in volume and shape have been found between depressed and non-depressed groups in temporal (e.g., superior temporal gyrus (STG), hippocampus, amygdala), frontal (e.g., anterior cingulate cortex (ACC)), and orbitofrontal regions (see Lorenzetti et al., 2009) for a review of the structural MRI findings associated with MDD in adulthood). These studies, conducted in adults, are likely to reflect the pathophysiology of MDD, as well as secondary changes due to longstanding behavioral alteration, and iatrogenic changes (as a result of pharmacological and other therapies).
To date, a small handful of studies have also investigated pediatric and adolescent-onset MDD and have reported structural differences from healthy controls in similar regions, including the hippocampus (MacMaster and Kusumakar, 2004), amygdala (Rosso et al., 2005), striatum and caudate nucleus (Matsuo et al., 2008; Shad, Muddasani, Rao, 2012), superior and middle temporal gyri (Shad, Muddasani, Rao, 2012), and subgenual prefrontal cortex (Botteron et al., 2002). A compelling recent study by (Chen, Hamilton, Gotlib, 2010) even found volumetric differences in the left hippocampus in clinically non-depressed young girls at high risk for depression (due to a maternal depression history), in comparison with girls who did not have a maternal depression history. However, other studies of early-onset depression have failed to find volumetric differences between depressed and healthy control groups in critical brain regions, including the prefrontal cortex (e.g., (Nolan et al., 2002)), hippocampus (Rosso et al., 2005), and amygdala (MacMaster and Kusumakar, 2004).
One potential reason for the failure to find consistent evidence of morphological differences in critical cortico-limbic circuits in early-onset MDD may be that such differences are subtle. Since the extent of hippocampal volume loss has been found to correlate significantly with the number of depressive episodes (i.e., time spent depressed) in adults with depression (Milne, MacQueen, Hall, 2012; Sheline et al., 1999), differences between depressed and non-depressed groups are likely to be larger in older samples of adults with recurrent depression than in younger individuals in the earliest stages of the illness. Hippocampal volume loss has also been associated with traumatic life events, which can be expected to accumulate with age (e.g., Childress et al., 2013; Vythilingam et al., 2004). More sensitive methods than have been used to date may be required to detect subtle differences in brain morphology associated with depression in its earliest stages, and in its youngest sufferers.
Previous methods used for investigating the morphological differences between individuals with depression and healthy controls can be categorized into three main types: 1) volume analysis; 2) analysis of local composition of tissue; and 3) analysis of shape and volume. The most common approach is hippocampal volume analysis using manual or automated segmentation (Bell-McGinty et al., 2002; Bergouignan et al., 2009; Vasic et al., 2008). In such analyzes the volume of the hippocampal region is measured after isolating it from the rest of the brain. Using this method, several groups have observed smaller hippocampal volumes in adults with MDD (Bremner et al., 2000; Caetano et al., 2004; Frodl et al., 2002; MacQueen et al., 2003; Neumeister et al., 2005; Saylam et al., 2006) whereas other groups have reported no differences or even larger hippocampal volumes (Hastings et al., 2004; Monkul et al., 2007; Rusch et al., 2001; Vythilingam et al., 2004).
Voxel-based morphometry (VBM) (Ashburner and Friston, 2000; Good et al., 2001) which examines voxelwise differences in gray- and white-matter volumes and concentrations throughout the brain, has demonstrated reduced gray matter intensity in the hippocampus of MDD subjects (Bergouignan et al., 2009; Chen et al., 2007; Shah et al., 1998; Vasic et al., 2008). A limitation of VBM is that each individual's brain data is normalized using non-linear deformation fields to a reference template. Through that process, crucial idiographic information such as the shape of brain structures and their position, orientation and size (pose), both relative to other structures and in absolute terms, is lost (Ashburner and Friston, 2000). This information may be critical for capturing group differences, particularly when such differences are subtle.
Alternatives to VBM approaches include Deformation Based Morphometry (DBM) (Bookstein, 1996) and Tensor Based Morphometry (TBM) (Chung et al., 2001), which are widely used to study the brains of people with schizophrenia, autism, dyslexia and Turner's syndrome (Frackowiak et al., 2004). Unlike VBM, which analyzes images after the deformation fields have been applied in order to map any individual brain into a standard reference, these approaches take the deformation fields themselves as the dependent variable. Neither of these approaches has yet been attempted to study structural changes in depression. However, shape-analysis methods that are related to DBM/TBM have been employed in two separate studies to examine hippocampal differences in depression. These studies have focused on separate analysis of both shape and volume of the hippocampus using high-dimensional mapping (Posener et al., 2003) or spherical harmonic basis functions (Zhao et al., 2008). These studies with adult and elderly depressed participants reveal significant differences in hippocampal shape, but no volumetric differences. In these analyses, contribution to morphology made by the shape and pose of the hippocampal region and the surrounding regions was largely ignored.
Multi-object analysis enables the simultaneous statistical analysis of multiple brain structures, possibly allowing for the identification of subtle morphological differences across multiple brain regions, between groups. Multi-object methods were originally designed to characterize the shape of a population of geometric entities (Cerrolaza, Villanueva, Cabeza, 2012; Duta and Sonka, 1998; Lu et al., 2007; Tsai et al., 2003), and have since been applied to the analysis of brain MRI images to discriminate between healthy and clinical populations (e.g., pediatric autism; Gorczowski et al., 2010), but has not yet been employed in the context of major depressive disorder.
In the current study, we report the first use of a multi-object statistical pose and shape model to simultaneously analyze several temporal-lobe structures that have been implicated in MDD. Given that MDD is associated with morphological changes in several brain structures, pose and shape analysis of these brain structures simultaneously may be more sensitive to subtle group differences than is independent analysis of those structures, since simultaneous analysis includes information not just about the pose of brain structures, but about their pose relative to each other. In the current paper we first present the method, and then use it to identify temporal-lobe structures of interest and to characterize the relationship between the pose and shape of these structures and the symptomatology of early-onset MDD, when morphological differences between healthy and clinical groups are expected to be mild, and subtle. Use of a young sample at the earliest stage of their depressive illness has important implications for understanding the neurostructural correlates of the etiology of MDD.
2. Materials and methods
2.1. Participants
Nineteen depressed subjects (age: 18.1 ± 1.1, 3 males, all right-handed) who met the DSM-IV-TR (Diagnostic and Statistical Manual of Mental Disorders; American Psychiatric Association, 2000) criteria for a current episode of MDD were recruited through referrals from community mental health clinics. Twenty-six healthy participants (age: 17.96 ± 0.2, 1 male, all right-handed) with no psychiatric history were recruited through community advertisement. Participants were excluded if they met the current or lifetime criteria for bipolar disorder, a psychotic disorder, attention-deficit/hyperactivity disorder, a developmental disability (e.g., autism spectrum disorder), or a medical disorder that could cause depression (e.g., hypothyroidism). All participants were medication-free prior to the study. This study was cleared by the Queen's University Health Sciences Research Ethics Board, and written informed consent was obtained from all participants and by a parent or guardian for participants under 18 years. All participants were compensated $10 for their time and were given a picture of their brain to keep.
2.2. Clinical examination
All participants in the depressed group were diagnosed based on a structured diagnostic interview administered by an advanced doctoral student in clinical psychology (the Child and Adolescent version of the Schedule for Affective Disorders and Schizophrenia; K-SADS; Kaufman and Schweder, 2004). The K-SADS is the gold standard for deriving DSM-IV diagnoses in children and adolescents and is the most widely used measure for this purpose in clinical research. This clinician interview was administered by graduate-level students in clinical psychology who were trained and supervised by a registered clinical psychologist with over 20 years of expertise in the assessment and diagnosis of depression in adolescence. Participants were scored in the mild to severe depression range, as defined by a Beck Depression Inventory (BDI-II; Beck et al., 1996) score. The BDI is a 21-item measure designed to assess the presence and severity of depression symptoms, and is the most commonly used depression measure in adolescent and adult samples (Cusin et al., 2010). The BDI was administered by trained graduate or senior undergraduate-level students who went over the measure with each participant to ensure that they understood the questions. We chose not to include the Hamilton Depression Rating Scale and to focus exclusively on the BDI as an index of depression severity for the primary reason that there is evidence that the Hamilton possesses a poor psychometric profile (Bagby et al., 2004).
The MRI data were acquired using a 3.0 Tesla Siemens Trio MRI scanner with a 12-channel head coil in the MRI facility at Queen's University, Kingston, Canada. A whole-brain 3D MPRAGE T1-weighted anatomical image was acquired for each participant (voxel resolution of 1.0 × 1.0 × 1.0 mm3, flip angle α = 9°, TR = 1760 ms, and TE = 2.6 ms). The subjects filled out the BDI immediately after being in the scanner.
2.3. Multi-object statistical analysis
Pose and shape analysis of multiple brain structures, shown schematically in Fig. 1, involves three steps: a) preprocessing the MRI data to extract surface points on brain structures of interest; b) finding the pose and shape variations among these brain structures; and c) Principal Component Analysis (PCA) on pose and shape variations in the subject population.
Fig. 1.
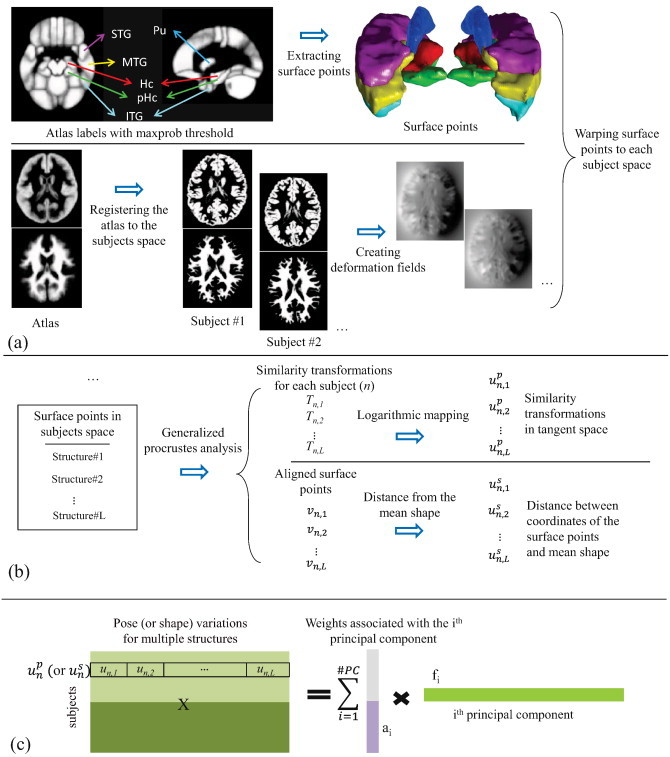
Schematic of the pose and shape statistical analysis of multiple brain structures. (a) Preprocessing the MRI data for extracting surface points on brain structures of interest; (b) pose and shape multi-object analysis for finding the pose and shape variations between multiple brain structures; (c) PCA for generating pose and shape features.
2.3.1. Preprocessing
The structural MRI data of the subjects were preprocessed using Statistical Parametric Mapping software (SPM8, Wellcome Department of Cognitive Neurology, London, UK). Briefly, Grey Matter (GM), White Matter (WM) and Cerebral Spinal Fluid (CSF) were segmented using the automated segmentation processes in SPM. This resulted in a set of three maps for GM, WM and CSF in native space for each subject, in which each voxel was assigned a probability of being one of the three tissue types.
The LONI Probabilistic Brain Atlas (LPBA40/SPM5) (Shattuck et al., 2008) in MNI space was used to extract the left and right hippocampus, parahippocampal gyrus, putamen, and superior, inferior and middle temporal gyri from the brain of each participant (shown in Fig. 2); these are structures that have been shown to be associated with MDD in adulthood (Lorenzetti et al., 2009). The LONI atlas is constructed using the MRI data of 40 healthy volunteers, and 56 structures were labeled manually. We used the maximum-probability values at each voxel to segment the regions of interest in the atlas. To accomplish segmentations in each of the participants, we used the DARTEL algorithm to register the LONI atlas to each participant's structural MRI, and extracted surface points, V = {vn,l}n = 1…N,l = 1…L, indexing the coordinates of the surface voxels on each of the selected brain structures (Ashburner, 2007)1. Here, vn,l consists of all surface points of the lth structure of subject n, L = 12 is the number of structures (six in each hemisphere), and N = 45 is the number of subjects in the training set. For each subject, the surface boundary of each brain structure was used to compute the volume of that structure. Structure volumes were compared between the MDD and control groups.
Fig. 2.
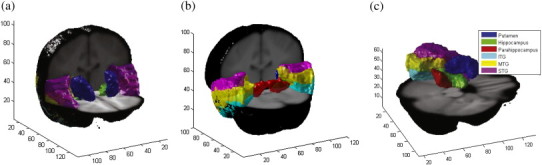
Segmented structures in both hemispheres of the brain which are used for multi-object statistical analysis. Surface points of putamen (blue), hippocampus (green), parahippocampal gyrus (red), and ITG (cyan). MTG (yellow), and STG (magenta) in both hemispheres of the brain are shown in (a) anterior to posterior view, and (b) posterior to anterior view. Structures in left hemisphere of the brain are shown in (c).
2.3.2. Pose and shape analysis
Since all surface points are extracted using the atlas in MNI space, the correspondences among the surface points (between homologous points in different subjects) were known. We used those correspondences to compute the linear (rigid plus scaling) deformation required to warp each structure in each participant to the mean shape of each structure calculated across participants, using the generalized Procrustes analysis (Dryden and Mardia, 1998). Pose variations were calculated using translation, rotation, and scaling values of these deformation fields. Each transformation for a voxel, x, is defined as T(x) = sRx + d, where R is a rotation matrix, d is a translation vector, and s is a scale factor. These transformations form a Lie group, which is a Riemannian manifold so conventional statistical analysis in Euclidean space is not applicable. However, a logarithmic transform was used to put the members of the Lie group into linear tangent space, appropriate for conventional statistical analysis. The logarithm of the transformation is defined as:
| (1) |
where l = log(s), and (rx, ry,rz) is the rotation axis with angle . Thus, each transformation, Tn,l, which represents the transformation from the lth structure in the mean shape to the corresponding structure in the nth instance, was expressed as a vector with seven variables: (rx,ry,rz,x,y,z,l)T.
For the purpose of statistical analysis, each transformation was normalized using the mean transformation for each structure, Ml, and mapped to the tangent space: (Bossa and Olmos, 2006; Pennec, 2006)2. The transformation vectors were concatenated for each individual to form a 7L×1 vector: and the matrix of all transformations for all individuals was created: .
Shape variations are computed as the residual deformation required to map the mean shape of each structure to the corresponding structure for each subject, after the linear transformation for pose has been applied. Subsequently, similar to the pose variation extraction method described earlier, the distance vectors (deformations) were concatenated for each subject: and the matrix of all transformations for subjects was created: .
2.3.3. Statistical analysis
A multi-object statistical pose and shape model (Bossa and Olmos, 2007) was generated for the selected brain structures. In order to extract major directions of the pose and shape variations across all subjects, we constructed an orthonormal basis set that represented all pose and shape variations using Principal Component Analysis (PCA).
PCA on pose was performed using Up=ApFpT. In this equation, is the pose feature matrix, and s are principal components that are sorted in descending order of their variance. is the corresponding weight matrix, generated from the principal component weights. We focus our analysis on the principal components associated with the pose that captures two standard deviations of variations in the data. Similarly, PCA was used to identify an orthogonal vector set for shape, , and the corresponding weight matrix, . We consider principal components that capture one standard deviation of shape variations in the data. The primary difference between the number of principal components we consider for pose and shape stems from the difference in the dimensions of pose components (i.e., 7L, where L = 12 is the number of structures in our study) and shape components, which is the number of all surface points in each structure and is significantly larger than L.
Our objectives were to 1) identify pose and shape features that would differentiate the two groups; and 2) investigate the relation between these features and the clinical index of depression (i.e., BDI scores).
To achieve the first objective, we first use a random-forest classification (Breiman, 2001) approach to sort the selected principal components. Random forests are a learning method for classification that use multiple decision trees for training. The decision tree splits the weights related to the considered principal components to maximize diversity among the subjects (Coppersmith, Hong, Hosking, 1999). As a result, a tree with nodes and leaves is constructed, where its top node shows the weights with maximum separability. We perform unpaired two-sample t-tests (assuming unequal variance in the two groups) only on the top-node weights for pose and shape, i.e. one component for pose and one component for shape. As this study was designed to be hypothesis-generating and sensitive to morphological differences in brain structures between adolescent depressed individuals and control participants, a significance level of p < 0.05, uncorrected for multiple comparisons, was used (Haynes et al., 2012; Rothman, 1990).
In order to visualize the significant pose component, associated with the top node weights, the norms of the three pose parameters (three translation, three rotation, and one scale variables) were computed. Subsequently, the mean of each parameter was removed and the result was divided by the standard deviation of the parameter. For the shape, the mean of the significant shape principal component associated with the top node weights was removed and the result was normalized to the component's standard deviation. The higher the absolute value of the normalized pose or shape component, the more the contribution of that member of the principal component to capture the differences between the two groups.
To achieve the second objective, we calculate Spearman correlation coefficients between the Beck Depression Inventory score and the top-node pose and shape weights.
3. Results
3.1. Behavioral results
The groups were matched for age (p = 0.52). There were no socioeconomic status (SES) differences between the subjects in the two groups (p = 0.93). The BDI differed significantly between the two groups (p < .0001). Fig. 3 shows the boxplot of the BDI for the two groups.
Fig. 3.
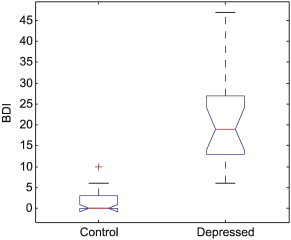
Distribution of BDI for the control and depressed groups. The central red mark is the median, the edges of the blue box are the 25th and 75th percentiles, and the whiskers show the extreme values of the volumes.
3.2. Volume analysis
We first assessed the volume differences between the MDD and control groups for each structure. Unpaired two-sample t-tests (assuming unequal variance in the two groups) with a significance level of p < 0.05, uncorrected for multiple comparisons, was used to detect volume differences between the two groups. The volume of both the left parahippocampal gyrus and the left superior temporal gyrus was significantly greater (p = 0.019 and p = 0.034 respectively) in the depressed than the control group.
3.3. Pose and shape analysis
The goal of our multi-object analysis was to investigate the pose and shape differences in brain structures between the participants with MDD and healthy controls. The first four principal components of pose capture two standard deviations (95%) of the variation in pose, and the first eight components of shape capture one standard deviation (68%) of the variation in shape. The random-forest classification trees for pose and shape were built on these components. Statistical analyses using unpaired two-sample t-tests were performed on the top component for each tree.
The two groups differed significantly (p = 0.031 with corresponding statistical power of 0.77 (Ellis, 2010) for the pose component, and p = 0.042 with corresponding statistical power of 0.89 for the shape component). Table 1 shows the normalized pose parameters across different brain structures for the most significant pose component. The translation component differed significantly between the two groups in the left putamen, left and right hippocampus, and left ITG. Rotation also differed between the groups in the left putamen, right hippocampus, and left and right ITG, and scale differed between groups in the left and right putamina. Fig. 4 shows the normalized shape component across different structures in the brain. As can be seen in the figure, many regions of all the structures examined show variations of the shape that are more than 1.96 (two standard deviations away from the mean), in both hemispheres.
Table 1.
Normalized pose parameters of brain structures. Translation, rotation and scale parameters of pose which are above a threshold of 1.0 are shown in bold in the table. L and R show the assigned anatomical left and right hemispheres.
| Structure | Left or right hemisphere | Translation | Rotation | Scale |
|---|---|---|---|---|
| Putamen | L | 1.16 | 1.93 | 1.81 |
| R | 0.66 | 0.28 | 2.32 | |
| Hippocampus | L | 1.13 | −0.07 | −0.14 |
| R | 1.50 | −1.11 | 0.03 | |
| Parahippocampal gyrus | L | −0.31 | −0.75 | −0.41 |
| R | 0.54 | −0.12 | −0.79 | |
| Inferior temporal gyrus | L | −1.82 | −1.58 | −0.52 |
| R | −0.90 | 1.30 | −0.40 | |
| Middle temporal gyrus | L | −0.73 | −0.72 | −0.28 |
| R | −0.70 | 0.81 | −0.55 | |
| Superior temporal gyrus | L | −0.14 | 0.01 | −0.27 |
| R | −0.36 | 0.03 | −0.80 |
Fig. 4.
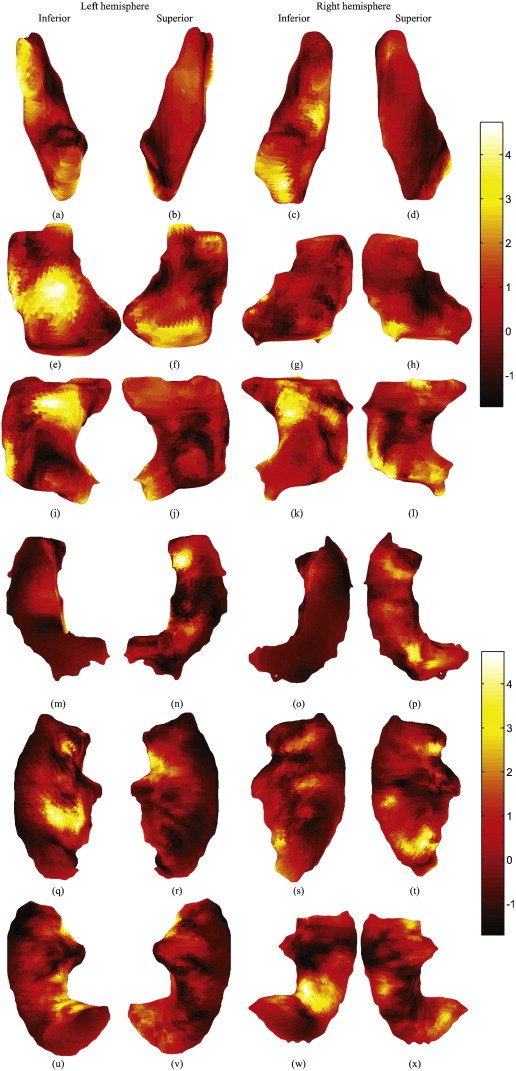
Shape principal component that was significantly different between the two groups. The component is normalized by removing the mean and divided to its standard deviation. Inferior and superior views of the (a, b) left putamen, (c, d) right putamen, (e, f) left hippocampus, (g, h) right hippocampus, (i, j) left parahippocampal gyrus, (k, l) right parahippocampal gyrus, (m, n) left superior temporal gyrus, (o, p) right superior temporal gyrus, (q, r) left middle temporal gyrus, (s, t) right middle temporal gyrus, (u, v) left inferior temporal gyrus, and (w, x) right inferior temporal gyrus. The color smoothly varies from black through red, orange, yellow and white, to show the minimum through maximum difference values. Left side of the pictures shows the left side of the brain, right shows right side, top is the anterior and bottom is the posterior.
To investigate the relation between the pose and shape weights that were significantly different between the two groups and BDI scores, Spearman correlation coefficients were calculated between the pose and shape values and BDI. The significant pose component correlated significantly with BDI (Spearman correlation: 0.38, p-value = 0.0086, slope: −0.039, intercept: 0.39), but the significant shape component did not (Spearman correlation: 0.15, p-value = 0.298, slope: −0.89, intercept: 8.8). Fig. 5 shows the distributions of the pose scores (a) and shape scores (b) across BDI. The four male subjects are identified with a circle.
Fig. 5.
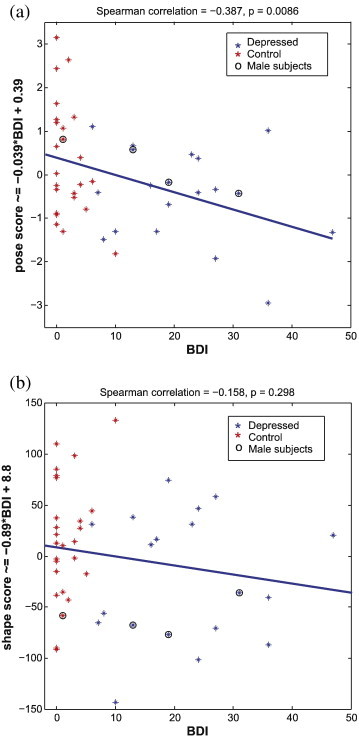
Pose (a) and shape (b) scores that generated the significant difference between the MDD subjects and controls across the beck Depression Inventory Index (BDI). Pose scores are significantly correlated to the BDI (Spearman correlation: 0.38, p-value = 0.0086, slope: −0.039, intercept: 0.39). Shape scores are not significantly correlated to the BDI (Spearman correlation: 0.15, p-value = 0.298, slope: −0.89, intercept: 8.8). A circle has been drawn around the data of male subjects.
4. Discussion
We conducted a statistical analysis of pose and shape information from several brain regions in order to examine whether the brains of individuals with early-onset MDD differ from those of healthy controls. Indeed, despite a rather small number of participants, we were able to observe statistically reliable differences in the medial temporal lobe regions, and we also determined that some features captured by the pose and shape analysis correlated with depressive symptomatology as measured by the Beck Depression Inventory. The sensitivity of this method may be related to its ability to capture differences in the spatial relationships among structures, not simply differences within an individual structure. A concern about the results is that we did not make any formal adjustments to correct for multiple comparisons, which potentially introduced a risk of false-positive results. Therefore, the p-values should be interpreted with caution (Devonshire et al., 2012). As such, future studies with larger samples are needed to further validate these results.
We observed volume differences, with a significance level of p < 0.05, uncorrected for multiple comparisons, in the left parahippocampal gyrus and the left superior temporal gyrus (STG) structures between the depressed group and the control group. The STG volume and GM density differences between the MDD and control subjects were previously shown by Vythilingam et al. (2004) and Shah et al. (2002). The individuals studied by these authors had been diagnosed with MDD at least 2 years earlier — so a later stage of the illness than the clinical group in the current study. Our results indicate that differences in STG are present right from the earliest stages of the disease.
The most significant component of the pose, highlighted in Table 1, showed that the left and right putamina, the left and right hippocampi, and the left and right inferior temporal gyri were more affected by MDD. The scale parameter of the right putamen is the only parameter that showed at least two standard deviations of variation. The translation mostly affected the left inferior temporal gyrus, and the rotation mostly affected the left putamen.
Shape analysis revealed that all examined structures, including the putamen, hippocampus, parahippocampal gyrus, and superior, middle and inferior temporal gyri, differed between the two groups, suggesting that multiobject shape analysis is a sensitive tool for the examination of morphological differences in clinical samples. Moreover, within the most significant component of the shape, we identified regions that were at least two standard deviations away from the mean of that component, highlighting regions that were more affected by MDD.
Importantly, depressive symptomatology, as indexed by BDI scores, correlated with the pose of the structures (Fig. 5(a)). While the volume increase in the fusiform gyrus, cuneus and precuneus has been previously shown to have an association with the BDI increase in MDD (Kroes et al., 2011), we are the first to show that pose variations of multiple structures are also affected by MDD, and correlate significantly with BDI.
The significant brain structural abnormalities seen here in early-onset depression are consistent with those observed in previous work (MacMaster et al., 2008; MacMaster and Kusumakar, 2004; MacMaster et al., 2014). However, MacMaster et al. only investigated volumetric differences between brain structures, after isolating each structure from the rest of the brain. Here, we have investigated the morphometric differences using simultaneous pose and shape analysis of multiple structures. As a result, we can capture differences due to the relationship among structures, and also differentiate between pose and shape morphometric differences.
The neural mechanisms underlying the observed morphometric differences in MDD have received empirical attention. Depression is associated with chronic dysregulation of the hypothalamic–pituitary–adrenal (HPA) axis with the resulting chronic release of cortisol and other neurotoxic stress hormones (Burke et al., 2005). Glucocorticoid neurotoxicity has preferential effects on hippocampal neurogenesis (e.g., De Vry et al., 2012; Sapolsky, 2000). Indeed, in both preclinical and human clinical studies chronic stress and depression are associated with long-term changes in the hippocampus in the expression of genes involved in synaptic plasticity, such as brain-derived neurotrophic factor (BDNF; e.g., Law et al., 2009; Mondelli et al., 2011). Our results extend the state of the literature by suggesting that through the use of sensitive pose and shape analyses, the structural differences in MDD can be observed at the very initial stages of the illness, suggesting that they do not just emerge over the recurrent and chronic pathology of the disorder. In addition, as all of our depressed participants were medication naïve, the structural differences are not due to any potential neurotoxic effects of chronic anti-depressant usage. As such, they may emerge as a result of premorbid epigenetic vulnerabilities. For example, hippocampal volume differences have been shown in individuals with particular polymorphisms of genes known to impart risk for depression, but only in the context of environmental adversity, such as a history of childhood trauma (e.g., Teicher, Anderson, Polcari, 2012), or maternal depression (e.g., Chen, Hamilton, Gotlib, 2010). Future prospective, longitudinal studies that follow children at risk of depression as a result of these vulnerabilities through to the onset of syndromal MDD are required to clarify the precise etiological and pathological mechanisms underlying the relation of hippocampal volume loss to MDD.
A concern about the method is the possible dependence on the quality of the segmentation. In this work, the segmentation comes from an atlas and the registration of the atlas to the brains of the individual participants. A potential alternative is to manually segment the structures in individual brains prior to a group-wise registration. In future studies, we can also use polyaffine transformations in a logarithmic domain (Arsigny et al., 2009; Commowick et al., 2008), instead of similarity transformations for registration of multiple structures. An affine transformation would further encompass anisotropic scaling and shearing.
The current study investigated morphological variation in the pose and the shape of the hippocampus and surrounding structures in early-onset MDD compared to control participants. Although a large number of previous studies have shown differences between MDD subjects and controls (Bergouignan et al., 2009; Bremner et al., 2000; Caetano et al., 2004; Chen et al., 2007; Frodl et al., 2002; Neumeister et al., 2005; Saylam et al., 2006; Shah et al., 1998; Vasic et al., 2008), ours is the first, to our knowledge, to simultaneously analyze multiple structures, and to separate pose and shape in morphological analysis. The value of the presented method is that it identifies structures of interest and characterizes types of differences (i.e., pose and shape) that can then be fed back into models/theories on etiology. In other words, what is more relevant than finding group differences is pinpointing the effect of underlying mechanisms that lead to MDD on brain structures and their interrelationships. Future studies should consider differences between MDD and control groups in other brain structures of relevance to MDD, and should also investigate whether the present results generalize to adults with recurrent MDD, as well as younger children with MDD. In addition, although current results (Fig. 5(a) and (b)) did not reveal any differences in the structures we examined between male and female individuals with MDD, we had very few young men in our study. Further studies with young men are needed to ensure that the results observed here generalize across sexes.
Recently, a few studies have focused on the White Matter (WM) integrity using Diffusion Tensor Imaging (DTI), to assess the structural connectivity of the network between healthy controls and MDD subjects. Korgaonkar et al. (2014) showed structural connectomic alterations between nodes of the default mode network and the frontal-thalamo-caudate regions in 95 MDD outpatients comparing to 102 matched control subjects. However, Choi et al. (2014) found no significant differences in WM integrity disruption between 134 medication-free MDD patients and 54 healthy controls. Future studies may use multivariate approaches to include analysis of geometric changes (pose and shape), tissue concentrations (WM and GM) and structural connectome (DTI).
In summary, using multi-object statistical pose and shape analysis, we demonstrated brain morphological differences between adolescents and young adults with early-onset MDD and healthy control subjects. Relative pose information and shape information of multiple structures in brain, which are usually disregarded, were shown to be important in capturing the group differences. Within this framework, the shape deformations were analyzed separately from rigid transformations and scale (i.e., the pose information). Therefore, we could identify the type of morphological differences (pose and shape). Within the simultaneous analysis of multiple structures the relative differences among structures were captured. The differences were more pronounced in the moderate and severely depressed participants. Moreover, morphological features (pose) significantly correlate with depressive symptoms across both normal and depressed participants.
Acknowledgments
The current study was supported by operating grants from the Canadian Institutes of Health Research (MOP-79320), the Natural Sciences and Engineering Research Council of Canada, and the Advisory Research Council of Queen's University (380327). The authors graciously acknowledge the technical assistance of Sharon David in helping with MRI image capture. The authors also wish to thank Jeremy Stewart, Kimberly Blom, and Lindsey Lytle for conducting the subject interviews.
Footnotes
DARTEL registration uses the GM and WM maps of the atlas and each subject structural MRI for performing the registration between the atlas and each subject structural MRI.
The superscript “p” indicates the features belonging to pose space as opposed to shape features with the superscript “s”.
Contributor Information
Mahdi Ramezani, Email: mahdir@ece.ubc.ca.
Ingrid Johnsrude, Email: ingrid.johnsrude@queensu.ca.
Abtin Rasoulian, Email: abtinr@ece.ubc.ca.
Rachael Bosma, Email: rachaelbosma@gmail.com.
Ryan Tong, Email: ryan.p.tong@gmail.com.
Tom Hollenstein, Email: tom.hollenstein@queensu.ca.
Kate Harkness, Email: harkness@queensu.ca.
Purang Abolmaesumi, Email: purang@ece.ubc.ca.
Appendix A.
Fig. 6 shows the distribution of the volume of each structure for the depressed and control groups.
Fig. 6.
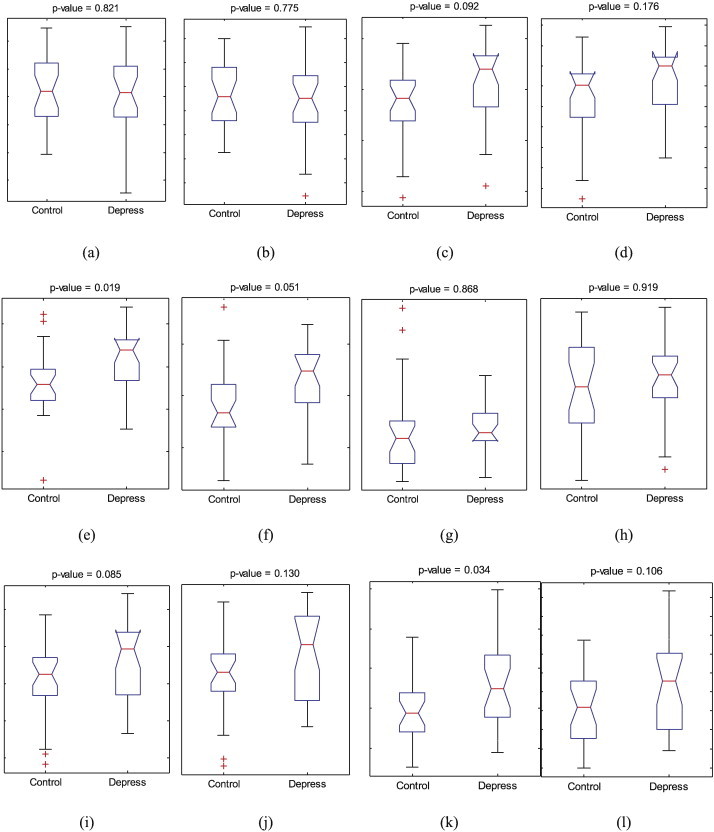
Distribution of the volume of each structure between the two groups, (a) left putamen, (b) right putamen, (c) left hippocampus, (d) right hippocampus, (e) left parahippocampal gyrus, (f) right parahippocampal gyrus, (g) left inferior temporal gyrus, (h) right inferior temporal gyrus, (i) left middle temporal gyrus, (j) right middle temporal gyrus, (k) left superior temporal gyrus, and (l) right superior temporal gyrus. The central red mark is the median, the edges of the blue box are the 25th and 75th percentiles, and the whiskers show the extreme values of the volumes.
References
- American Psychiatric . 4 edition. American Psychiatric Pub; 2000. Diagnostic and Statistical Manual of Mental Disorders, (DSM-IV-TR) [Google Scholar]
- Arsigny V., Commowick O., Ayache N., Pennec X. A fast and log-Euclidean polyaffine framework for locally linear registration. Journal of Mathematical Imaging and Vision. 2009;33(2):222–238. [Google Scholar]
- Ashburner J. A fast diffeomorphic image registration algorithm. Neuroimage. 2007;38(1):95–113. doi: 10.1016/j.neuroimage.2007.07.007. 17761438 [DOI] [PubMed] [Google Scholar]
- Ashburner J., Friston K.J. Voxel-based morphometry — the methods. Neuroimage. 2000;11(6 Pt 1):805–821. doi: 10.1006/nimg.2000.0582. 10860804 [DOI] [PubMed] [Google Scholar]
- Bagby R.M., Ryder A.G., Schuller D.R., Marshall M.B. The Hamilton depression rating scale: has the gold standard become a lead weight? American Journal of Psychiatry. 2004;161(12):2163–2177. doi: 10.1176/appi.ajp.161.12.2163. 15569884 [DOI] [PubMed] [Google Scholar]
- Beck A.T., Steer R.A., Ball R., Ranieri W.F. Comparison of beck depression inventories-IA and-II in psychiatric outpatients. Journal of Personality Assessment. 1996;67(3):588–597. doi: 10.1207/s15327752jpa6703_13. [DOI] [PubMed] [Google Scholar]
- Bellani M., Baiano M., Brambilla P. Brain anatomy of major depression II. Focus on amygdala. Epidemiology and Psychiatric Sciences. 2011;20(1):33–36. doi: 10.1017/s2045796011000096. 21657113 [DOI] [PubMed] [Google Scholar]
- Bellani M., Baiano M., Brambilla P. Brain anatomy of major depression I. Focus on hippocampus. Epidemiologia e Psichiatria Sociale. 2010;19(4):298–301. 21322503 [PubMed] [Google Scholar]
- Bell-McGinty S., Butters M.A., Meltzer C.C., Greer P.J., Reynolds C.F., Becker J.T. Brain morphometric abnormalities in geriatric depression: long-term neurobiological effects of illness duration. American Journal of Psychiatry. 2002;159(8):1424–1427. doi: 10.1176/appi.ajp.159.8.1424. 12153839 [DOI] [PubMed] [Google Scholar]
- Bergouignan L., Chupin M., Czechowska Y., Kinkingnéhun S., Lemogne C., Le Bastard G., Lepage M., Garnero L. Can voxel based morphometry, manual segmentation and automated segmentation equally detect hippocampal volume differences in acute depression? Neuroimage. 2009;45(1):29–37. doi: 10.1016/j.neuroimage.2008.11.006. 19071222 [DOI] [PubMed] [Google Scholar]
- Birmaher B., Brent D.A., Chiappetta L., Bridge J., Monga S., Baugher M. Psychometric properties of the screen for child anxiety related emotional disorders (SCARED): a replication study. Journal of the American Academy of Child and Adolescent Psychiatry. 1999;38(10):1230–1236. doi: 10.1097/00004583-199910000-00011. 10517055 [DOI] [PubMed] [Google Scholar]
- Bookstein F.L. Landmark methods for forms without landmarks: localizing group differences in outline shape. Mathematical Methods in Biomedical Image Analysis. 1996:279–289. doi: 10.1016/s1361-8415(97)85012-8. [DOI] [PubMed] [Google Scholar]
- Bossa M.N., Olmos S. Statistical model of similarity transformations: building a multi-object pose model of brain structures. Computer Vision and Pattern Recognition Workshop. 2006:59. [Google Scholar]
- Bossa M., Olmos S. Multi-object statistical pose + shape models. Biomedical Imaging: From Nano to Macro. 2007:1204–1207. [Google Scholar]
- Botteron K.N., Raichle M.E., Drevets W.C., Heath A.C., Todd R.D. Volumetric reduction in left subgenual prefrontal cortex in early onset depression. Biological Psychiatry. 2002;51(4):342–344. doi: 10.1016/s0006-3223(01)01280-x. 11958786 [DOI] [PubMed] [Google Scholar]
- Breiman L. Random forests. Machine Learning. 2001;45(1):5–32. [Google Scholar]
- Bremner J.D., Narayan M., Anderson E.R., Staib L.H., Miller H.L., Charney D.S. Hippocampal volume reduction in major depression. American Journal of Psychiatry. 2000;157(1):115–118. doi: 10.1176/ajp.157.1.115. 10618023 [DOI] [PubMed] [Google Scholar]
- Burke H.M., Davis M.C., Otte C., Mohr D.C. Depression and cortisol responses to psychological stress: a meta-analysis. Psychoneuroendocrinology. 2005;30(9):846–856. doi: 10.1016/j.psyneuen.2005.02.010. 15961250 [DOI] [PubMed] [Google Scholar]
- Caetano S.C., Hatch J.P., Brambilla P., Sassi R.B., Nicoletti M., Mallinger A.G., Frank E., Kupfer D.J., Keshavan M.S., Soares J.C. Anatomical MRI study of hippocampus and amygdala in patients with current and remitted major depression. Psychiatry Research. 2004;132(2):141–147. doi: 10.1016/j.pscychresns.2004.08.002. 15598548 [DOI] [PubMed] [Google Scholar]
- Cerrolaza J.J., Villanueva A., Cabeza R. Hierarchical statistical shape models of multiobject anatomical structures: application to brain MRI. IEEE Transactions on Medical Imaging. 2012;31(3):713–724. doi: 10.1109/TMI.2011.2175940. 22194238 [DOI] [PubMed] [Google Scholar]
- Chen C.H., Ridler K., Suckling J., Williams S., Fu C.H., Merlo-Pich E., Bullmore E. Brain imaging correlates of depressive symptom severity and predictors of symptom improvement after antidepressant treatment. Biological Psychiatry. 2007;62(5):407–414. doi: 10.1016/j.biopsych.2006.09.018. 17217921 [DOI] [PubMed] [Google Scholar]
- Chen M.C., Hamilton J.P., Gotlib I.H. Decreased hippocampal volume in healthy girls at risk of depression. Archives of General Psychiatry. 2010;67(3):270–276. doi: 10.1001/archgenpsychiatry.2009.202. 20194827 [DOI] [PMC free article] [PubMed] [Google Scholar]
- Childress J.E., McDowell E.J., Dalai V.V.K., Bogale S.R., Ramamurthy C., Jawaid A., Kunik M.E., Qureshi S.U., Schulz P.E. Hippocampal volumes in patients with chronic combat-related posttraumatic stress disorder: a systematic review. Journal of Neuropsychiatry and Clinical Neurosciences. 2013;25(1):12–25. doi: 10.1176/appi.neuropsych.12010003. 23487189 [DOI] [PubMed] [Google Scholar]
- Choi K.S., Holtzheimer P.E., Franco A.R., Kelley M.E., Dunlop B.W., Hu X.P., Mayberg H.S. Reconciling variable findings of white matter integrity in major depressive disorder. Neuropsychopharmacology: Official Publication of the American College of Neuropsychopharmacology. 2014;39:1332–1339. doi: 10.1038/npp.2013.345. 24352368 [DOI] [PMC free article] [PubMed] [Google Scholar]
- Chung M.K., Worsley K.J., Paus T., Cherif C., Collins D.L., Giedd J.N., Rapoport J.L., Evans A.C. A unified statistical approach to deformation-based morphometry. Neuroimage. 2001;14(3):595–606. doi: 10.1006/nimg.2001.0862. 11506533 [DOI] [PubMed] [Google Scholar]
- Commowick O., Arsigny V., Isambert A., Costa J., Dhermain F., Bidault F., Bondiau P.Y., Ayache N., Malandain G. An efficient locally affine framework for the smooth registration of anatomical structures. Medical Image Analysis. 2008;12(4):427–441. doi: 10.1016/j.media.2008.01.002. 18325825 [DOI] [PubMed] [Google Scholar]
- Coppersmith D., Hong S.J., Hosking J.R. Partitioning nominal attributes in decision trees. Data Mining and Knowledge Discovery. 1999;3(2):197–217. [Google Scholar]
- Cusin C., Yang H., Yeung A., Fava M. Anonymous Handbook of Clinical Rating Scales and Assessment in Psychiatry and Mental Health. Springer; 2010. Rating scales for depression; pp. 7–35. [Google Scholar]
- De Vry J., Prickaerts J., Jetten M., Hulst M., Steinbusch H.W., Van den Hove D.L., Schuurman T., van der Staay F.J. Recurrent long-lasting tethering reduces BDNF protein levels in the dorsal hippocampus and frontal cortex in pigs. Hormones and Behavior. 2012;62(1):10–17. doi: 10.1016/j.yhbeh.2012.04.019. 22584108 [DOI] [PubMed] [Google Scholar]
- Devonshire V., Havrdova E., Radue E.W., O’Connor P., Zhang-Auberson L., Agoropoulou C., Häring D.A., Francis G., Kappos L. Relapse and disability outcomes in patients with multiple sclerosis treated with fingolimod: subgroup analyses of the double-blind, randomised, placebo-controlled FREEDOMS study. Lancet Neurology. 2012;11(5):420–428. doi: 10.1016/S1474-4422(12)70056-X. 22494956 [DOI] [PubMed] [Google Scholar]
- Dryden I.L., Mardia K.V. Statistical Shape Analysis. John Wiley & Sons; New York: 1998. [Google Scholar]
- Duta N., Sonka M. Segmentation and interpretation of MR brain images: an improved active shape model. IEEE Transactions on Medical Imaging. 1998;17(6):1049–1062. doi: 10.1109/42.746716. 10048862 [DOI] [PubMed] [Google Scholar]
- Ellis P.D. The Essential Guide to Effect Sizes: Statistical Power, Meta-Analysis, and the Interpretation of Research Results. Cambridge University Books; 2010. [Google Scholar]
- Frackowiak R.S., Friston K.J., Frith C.D., Dolan R.J., Price C.J., Zeki S., Ashburner J.T., Penny W.D. Human Brain Function. Academic Press; 2004. [Google Scholar]
- Frodl T., Meisenzahl E.M., Zetzsche T., Born C., Groll C., Jäger M., Leinsinger G., Bottlender R., Hahn K., Möller H.J. Hippocampal changes in patients with a first episode of major depression. American Journal of Psychiatry. 2002;159(7):1112–1118. doi: 10.1176/appi.ajp.159.7.1112. 12091188 [DOI] [PubMed] [Google Scholar]
- Good C.D., Johnsrude I.S., Ashburner J., Henson R.N.A., Friston K.J., Frackowiak R.S.J. A voxel-based morphometric study of ageing in 465 normal adult human brains. Neuroimage. 2001;14(1 Pt 1):21–36. doi: 10.1006/nimg.2001.0786. 11525331 [DOI] [PubMed] [Google Scholar]
- Gorczowski K., Styner M., Jeong J.Y., Marron J.S., Piven J., Hazlett H.C., Pizer S.M., Gerig G. Multi-object analysis of volume, pose, and shape using statistical discrimination. IEEE Transactions on Pattern Analysis and Machine Intelligence. 2010;32(4):652–661. doi: 10.1109/TPAMI.2009.92. 20224121 [DOI] [PMC free article] [PubMed] [Google Scholar]
- Hastings R.S., Parsey R.V., Oquendo M.A., Arango V., Mann J.J. Volumetric analysis of the prefrontal cortex, amygdala, and hippocampus in major depression. Neuropsychopharmacology: Official Publication of the American College of Neuropsychopharmacology. 2004;29(5):952–959. doi: 10.1038/sj.npp.1300371. 14997169 [DOI] [PubMed] [Google Scholar]
- Haynes B.F., Gilbert P.B., McElrath M.J., Zolla-Pazner S., Tomaras G.D., Alam S.M., Evans D.T., Montefiori D.C., Karnasuta C., Sutthent R. Immune-correlates analysis of an HIV-1 vaccine efficacy trial. New England Journal of Medicine. 2012;366(14):1275–1286. doi: 10.1056/NEJMoa1113425. 22475592 [DOI] [PMC free article] [PubMed] [Google Scholar]
- Kandel D.B., Davies M. Adult sequelae of adolescent depressive symptoms. Archives of General Psychiatry. 1986;43(3):255–262. doi: 10.1001/archpsyc.1986.01800030073007. 3954545 [DOI] [PubMed] [Google Scholar]
- Kaufman J., Schweder A.E. The schedule for affective disorders and schizophrenia for school-age children: present and lifetime version. Comprehensive handbook of psychological assessment. Personality Assessment. 2004;2:247. [Google Scholar]
- Kessler R.C., Walters E.E. Epidemiology of DSM-III-R major depression and minor depression among adolescents and young adults in the National Comorbidity Survey. Depression and Anxiety. 1998;7(1):3–14. doi: 10.1002/(sici)1520-6394(1998)7:1<3::aid-da2>3.0.co;2-f. 9592628 [DOI] [PubMed] [Google Scholar]
- Korgaonkar M.S., Fornito A., Williams L.M., Grieve S.M. Abnormal structural networks characterize major depressive disorder: a connectome analysis. Biological Psychiatry. 2014 doi: 10.1016/j.biopsych.2014.02.018. 24690111 [DOI] [PubMed] [Google Scholar]
- Kroes M.C., Rugg M.D., Whalley M.G., Brewin C.R. Structural brain abnormalities common to posttraumatic stress disorder and depression. Journal of Psychiatry & Neuroscience: JPN. 2011;36(4):256–265. doi: 10.1503/jpn.100077. 21418787 [DOI] [PMC free article] [PubMed] [Google Scholar]
- Law A.J., Pei Q., Walker M., Gordon-Andrews H., Weickert C.S., Feldon J., Pryce C.R., Harrison P.J. Early parental deprivation in the marmoset monkey produces long-term changes in hippocampal expression of genes involved in synaptic plasticity and implicated in mood disorder. Neuropsychopharmacology: Official Publication of the American College of Neuropsychopharmacology. 2009;34(6):1381–1394. doi: 10.1038/npp.2008.106. 18615010 [DOI] [PMC free article] [PubMed] [Google Scholar]
- Lorenzetti V., Allen N.B., Fornito A., Yücel M. Structural brain abnormalities in major depressive disorder: a selective review of recent MRI studies. Journal of Affective Disorders. 2009;117(1-2):1–17. doi: 10.1016/j.jad.2008.11.021. 19237202 [DOI] [PubMed] [Google Scholar]
- Lu C., Pizer S.M., Joshi S., Jeong J.Y. Statistical multi-object shape models. International Journal of Computer Vision. 2007;75(3):387–404. [Google Scholar]
- MacMaster F.P., Mirza Y., Szeszko P.R., Kmiecik L.E., Easter P.C., Taormina S.P., Lynch M., Rose M., Moore G.J., Rosenberg D.R. Amygdala and hippocampal volumes in familial early onset major depressive disorder. Biological Psychiatry. 2008;63(4):385–390. doi: 10.1016/j.biopsych.2007.05.005. 17640621 [DOI] [PMC free article] [PubMed] [Google Scholar]
- MacMaster F.P., Kusumakar V. Hippocampal volume in early onset depression. BMC Medicine. 2004;2:2. doi: 10.1186/1741-7015-2-2. 14969587 [DOI] [PMC free article] [PubMed] [Google Scholar]
- MacMaster F.P., Carrey N., Langevin L.M., Jaworska N., Crawford S. Disorder-specific volumetric brain difference in adolescent major depressive disorder and bipolar depression. Brain Imaging and Behavior. 2014;8:119–127. doi: 10.1007/s11682-013-9264-x. 24158718 [DOI] [PubMed] [Google Scholar]
- MacQueen G.M., Campbell S., McEwen B.S., Macdonald K., Amano S., Joffe R.T., Nahmias C., Young L.T. Course of illness, hippocampal function, and hippocampal volume in major depression. Proceedings of the National Academy of Sciences of the United States of America. 2003;100(3):1387–1392. doi: 10.1073/pnas.0337481100. 12552118 [DOI] [PMC free article] [PubMed] [Google Scholar]
- Matsuo K., Rosenberg D.R., Easter P.C., MacMaster F.P., Chen H.H., Nicoletti M., Caetano S.C., Hatch J.P., Soares J.C. Striatal volume abnormalities in treatment-naive patients diagnosed with pediatric major depressive disorder. Journal of Child and Adolescent Psychopharmacology. 2008;18(2):121–131. doi: 10.1089/cap.2007.0026. 18439110 [DOI] [PubMed] [Google Scholar]
- Milne A.M., MacQueen G.M., Hall G.B. Abnormal hippocampal activation in patients with extensive history of major depression: an fMRI study. Journal of Psychiatry & Neuroscience: JPN. 2012;37(1):28–36. doi: 10.1503/jpn.110004. 21745440 [DOI] [PMC free article] [PubMed] [Google Scholar]
- Mondelli V., Cattaneo A., Belvederi Murri M., Di Forti M., Handley R., Hepgul N., Miorelli A., Navari S., Papadopoulos A.S., Aitchison K.J. Stress and inflammation reduce brain-derived neurotrophic factor expression in first-episode psychosis: a pathway to smaller hippocampal volume. Journal of Clinical Psychiatry. 2011;72(12):1677–1684. doi: 10.4088/JCP.10m06745. 21672499 [DOI] [PMC free article] [PubMed] [Google Scholar]
- Monkul E.S., Hatch J.P., Nicoletti M.A., Spence S., Brambilla P., Lacerda A.L., Sassi R.B., Mallinger A.G., Keshavan M.S., Soares J.C. Fronto-limbic brain structures in suicidal and non-suicidal female patients with major depressive disorder. Molecular Psychiatry. 2007;12(4):360–366. doi: 10.1038/sj.mp.4001919. 17389903 [DOI] [PubMed] [Google Scholar]
- Neumeister A., Wood S., Bonne O., Nugent A.C., Luckenbaugh D.A., Young T., Bain E.E., Charney D.S., Drevets W.C. Reduced hippocampal volume in unmedicated, remitted patients with major depression versus control subjects. Biological Psychiatry. 2005;57(8):935–937. doi: 10.1016/j.biopsych.2005.01.016. 15820716 [DOI] [PubMed] [Google Scholar]
- Nolan C.L., Moore G.J., Madden R., Farchione T., Bartoi M., Lorch E., Stewart C.M., Rosenberg D.R. Prefrontal cortical volume in childhood-onset major depression: preliminary findings. Archives of General Psychiatry. 2002;59(2):173–179. doi: 10.1001/archpsyc.59.2.173. 11825139 [DOI] [PubMed] [Google Scholar]
- Olesen J., Gustavsson A., Svensson M., Wittchen H.U., Jönsson B. The economic cost of brain disorders in Europe. European Journal of Neurology: the Official Journal of the European Federation of Neurological Societies. 2012;19(1):155–162. doi: 10.1111/j.1468-1331.2011.03590.x. 22175760 [DOI] [PubMed] [Google Scholar]
- Pennec X. Intrinsic statistics on Riemannian manifolds: basic tools for geometric measurements. Journal of Mathematical Imaging and Vision. 2006;25(1):127–154. [Google Scholar]
- Posener J.A., Wang L., Price J.L., Gado M.H., Province M.A., Miller M.I., Babb C.M., Csernansky J.G. High-dimensional mapping of the hippocampus in depression. American Journal of Psychiatry. 2003;160(1):83–89. doi: 10.1176/appi.ajp.160.1.83. 12505805 [DOI] [PubMed] [Google Scholar]
- Rosso I.M., Cintron C.M., Steingard R.J., Renshaw P.F., Young A.D., Yurgelun-Todd D.A. Amygdala and hippocampus volumes in pediatric major depression. Biological Psychiatry. 2005;57(1):21–26. doi: 10.1016/j.biopsych.2004.10.027. 15607296 [DOI] [PubMed] [Google Scholar]
- Rothman K.J. No adjustments are needed for multiple comparisons. Epidemiology (Cambridge, Mass.) 1990;1(1):43–46. 2081237 [PubMed] [Google Scholar]
- Rusch B.D., Abercrombie H.C., Oakes T.R., Schaefer S.M., Davidson R.J. Hippocampal morphometry in depressed patients and control subjects: relations to anxiety symptoms. Biological Psychiatry. 2001;50(12):960–964. doi: 10.1016/s0006-3223(01)01248-3. 11750892 [DOI] [PubMed] [Google Scholar]
- Sapolsky R.M. The possibility of neurotoxicity in the hippocampus in major depression: a primer on neuron death. Biological Psychiatry. 2000;48(8):755–765. doi: 10.1016/s0006-3223(00)00971-9. 11063972 [DOI] [PubMed] [Google Scholar]
- Saylam C., Üçerler H., Kitiş Ö., Ozand E., Gönül A.S. Reduced hippocampal volume in drug-free depressed patients. Surgical and Radiologic Anatomy: SRA. 2006;28(1):82–87. doi: 10.1007/s00276-005-0050-3. 16395541 [DOI] [PubMed] [Google Scholar]
- Shad M.U., Muddasani S., Rao U. Gray matter differences between healthy and depressed adolescents: a voxel-based morphometry study. Journal of Child and Adolescent Psychopharmacology. 2012;22(3):190–197. doi: 10.1089/cap.2011.0005. 22537357 [DOI] [PMC free article] [PubMed] [Google Scholar]
- Shah P.J., Glabus M.F., Goodwin G.M., Ebmeier K.P. Chronic, treatment-resistant depression and right fronto-striatal atrophy. British Journal of Psychiatry: the Journal of Mental Science. 2002;180(5):434–440. doi: 10.1192/bjp.180.5.434. 11983641 [DOI] [PubMed] [Google Scholar]
- Shah P.J., Ebmeier K.P., Glabus M.F., Goodwin G.M. Cortical grey matter reductions associated with treatment-resistant chronic unipolar depression. Controlled magnetic resonance imaging study. British Journal of Psychiatry: the Journal of Mental Science. 1998;172(6):527–532. doi: 10.1192/bjp.172.6.527. 9828995 [DOI] [PubMed] [Google Scholar]
- Shattuck D.W., Mirza M., Adisetiyo V., Hojatkashani C., Salamon G., Narr K.L., Poldrack R.A., Bilder R.M., Toga A.W. Construction of a 3D probabilistic atlas of human cortical structures. Neuroimage. 2008;39(3):1064–1080. doi: 10.1016/j.neuroimage.2007.09.031. 18037310 [DOI] [PMC free article] [PubMed] [Google Scholar]
- Sheline Y.I., Sanghavi M., Mintun M.A., Gado M.H. Depression duration but not age predicts hippocampal volume loss in medically healthy women with recurrent major depression. Journal of Neuroscience: the Official Journal of the Society for Neuroscience. 1999;19(12):5034–5043. doi: 10.1523/JNEUROSCI.19-12-05034.1999. 10366636 [DOI] [PMC free article] [PubMed] [Google Scholar]
- Teicher M.H., Anderson C.M., Polcari A. Childhood maltreatment is associated with reduced volume in the hippocampal subfields CA3, dentate gyrus, and subiculum. Proceedings of the National Academy of Sciences of the United States of America. 2012;109(9):E563–E572. doi: 10.1073/pnas.1115396109. 22331913 [DOI] [PMC free article] [PubMed] [Google Scholar]
- Tsai A., Wells W., Tempany C., Grimson E., Willsky A. Information Processing in Medical Imaging. Springer Berlin Heidelberg; 2003. Coupled multi-shape model and mutual information for medical image segmentation; pp. 185–197. [DOI] [PubMed] [Google Scholar]
- Vasic N., Walter H., Höse A., Wolf R.C. Gray matter reduction associated with psychopathology and cognitive dysfunction in unipolar depression: a voxel-based morphometry study. Journal of Affective Disorders. 2008;109(1-2):107–116. doi: 10.1016/j.jad.2007.11.011. 18191459 [DOI] [PubMed] [Google Scholar]
- Vythilingam M., Vermetten E., Anderson G.M., Luckenbaugh D., Anderson E.R., Snow J., Staib L.H., Charney D.S., Bremner J.D. Hippocampal volume, memory, and cortisol status in major depressive disorder: effects of treatment. Biological Psychiatry. 2004;56(2):101–112. doi: 10.1016/j.biopsych.2004.04.002. 15231442 [DOI] [PubMed] [Google Scholar]
- World Health Organization The Global Burden of Disease 2004 update. 2004. http://www.who.int/healthinfo/global_burden_disease/GBD_report_2004update_full.pdf
- Zhao Z., Taylor W.D., Styner M., Steffens D.C., Krishnan K.R.R., MacFall J.R. Hippocampus shape analysis and late-life depression. PloS One. 2008;3(3):e1837. doi: 10.1371/journal.pone.0001837. 18350172 [DOI] [PMC free article] [PubMed] [Google Scholar]