

Abstract
Childhood obesity is a significant public health problem, affecting one in five children in the United States. At the crux of this issue is a dysregulation of energy intake and energy expenditure. This review will provide an overview on energy and nutrient balance. We discuss energy balance studies in children using indirect and direct measures, and focus particularly on obesity as a deleterious consequence in childhood survivors of cancer. Obesity affects 11–57% of children with acute lymphoblastic leukemia, probably due to increased energy intake and reduced energy expenditure secondary to reduced habitual activity caused by fatigue. However, most of the studies in children with leukemia are retrospective, use BMI as a measure of obesity, and are inconclusive about the impact of the type of treatment on the development of obesity later in life. To better understand the etiology of obesity in both healthy and sick children, we need to undertake nutrient balance studies with appropriate measures of fat mass and fat distribution while keeping in mind the influence of normal tissue growth and puberty on energy balance.
Keywords: childhood obesity, dysregulation of energy intake, energy balance
THE OBESITY EPIDEMIC
In the United States, body weight and the prevalence of obesity have increased dramatically since 1980 [1]. Body mass index (BMI), calculated as weight in kilograms divided by height in meters squared is commonly used to classify normal weight and categories of obesity. A healthy weight range is defined by BMIs 18.5–24.9 kg/m2 while overweight and obesity are defined as BMIs 25–29.9 kg/m2 and BMI >30 kg/m2, respectively. Since 1960, the National Health and Nutrition Examination Surveys (NHANES) have collected BMI data on a representative sample of the US population. The first survey in 1960–1962 found that 44.9% of adults aged 20–74 years were overweight or obese [2]. With dramatic increases in obesity prevalence in the 1980s and 1990s, the latest survey in 2007–2008 showed that a staggering 72.3% and 64.1% of men and women, respectively, were overweight or obese [1]. Even more alarmingly, the prevalence of obesity in children aged 2–19 years, defined as a BMI for age percentile at or above the 95th percentile, has tripled since 1980, and remains high at 17% [3]. Similarly, the longitudinal Bogalusa study reported that the proportion of obese 5 to 17 year olds increased more than fivefold from 5.6% in 1973–1974 to 30.8% in 2008–2009 [4]. Children with a high BMI tend to become obese adults, and obese adults are at increased risk for numerous chronic conditions including diabetes, cardiovascular diseases, and some cancers. Immediate consequences in children with a high BMI include elevated lipid and insulin levels and raised blood pressure.
THE “OBESOGENIC” ENVIRONMENT
The secular rises in obesity over the past three decades can be explained by both physiological and environmental drivers and a number of putative factors (Fig. 1). At one level, the obesity epidemic is a classic gene–environment interaction, where the human genotype is susceptible to environmental influences that affect energy intake and expenditure, with the “obesogenic environment” being dominant. These environmental factors include the two obvious explanations, that is, reduced physical activity and increased energy intake as high caloric food and drinks. However, other less studied factors have been implicated including a longer time spent awake, an increased mean age of mothers at first birth, the decreasing prevalence of smoking, the presence of environmental pollutants, the ingestion of many novel medications and a reduction of the variability in seasonal ambient temperature due to the presence of almost ubiquitous air conditioning [5]. Fundamentally, the obesity epidemic is explained by a dysregulation of energy balance in our “obesogenic environment.” Understanding the etiology of obesity requires the study of how genetic and environmental factors interact to produce a chronic positive energy balance.
Fig. 1.

Gene–environment interactions in the development of obesity. This figure shows the interactions between genes and the obesogenic environment on adiposity assessed by body mass index (BMI). Over the past century, our environment has evolved from a traditional “leptogenic” environment to a westernized “obesogenic” environment, mainly characterized by increased energy intake and reduced physical activity. Other less studied environmental factors include radiation/chemotherapy treatment for cancer, longer time spent awake, increased age of mothers at first birth, reduced variability in seasonal ambient temperature and the prevalence of smoking [5]. On the left part of the figure is the long lasting “traditional” environment in which food is rather scarce and energy expenditure is high mostly due to occupational physical activity. Such an environment leads to leptogenic behaviors in which the variability of BMI is dependent on an individuals’ genetic predisposition to weight gain. On the right part of the figure, is the more recent modern social and built environment in which the variability of BMI also depends on genetic predisposition, but the obesogenic environment exerts a much stronger influence. Compared to the leptogenic environment, the mean BMI will be much higher and there will be more variation in the obesogenic environment. [Color figure can be seen in the online version of this article, available at http://wileyonlinelibrary.com/journal/pbc]
ENERGY BALANCE
The balance between energy intake (calories consumed) and energy expenditure (calories burned) obviously determines energy stores, and thus body weight. However, the classic equation of energy balance (energy intake = energy expenditure) has provided some confusion in the understanding of energy balance in humans. Much of the confusion comes from inappropriate energy calculations using this classic equation in a static way [6–8]. This equation is only appropriate and accurate when body weight is maintained and cannot be used in situations of changing body weight.
In conditions of weight loss or weight gain, energy balance is, however, the result of a dynamic process. Unfortunately, the most common equation used during discussions and calculations of energy balance is still of a static nature and erroneous: (change in energy stores = energy intake – energy expenditure). Fortunately, Alpert [9] elegantly demonstrated that the above equation is inadequate for calculations on living organisms as it does not take into account the increasing energy expenditure that ensues as a result of increasing weight or the decreasing energy expenditure with weight loss [10–12]. A small increase in energy intake sustained over a number of years cannot lead to a large weight gain as is often claimed since a small weight gain is sufficient to offset the caloric intake surplus via an increase in energy expenditure. The more appropriate equation, referred to as the dynamic energy balance equation (below) includes a time dependency by calculating “rates” of changes, thereby allowing the effect of changing energy stores (especially fat-free mass and weight) on energy expenditure to enter the equation.
This equation explains why small positive changes in energy balance cannot lead to large weight increases over a number of years. After short periods of positive energy balance, energy stores as fat mass and fat-free mass will increase and cause an increase in energy expenditure which will negate the increased energy intake. The individual will once again be in energy balance, but with a higher energy intake, higher energy expenditure, and higher energy stores.
Weight gain can therefore be viewed not only as the consequence of positive energy balance, but also depends on the mechanism(s) by which energy balance is eventually restored. How is intake balanced against expenditure, and how might a chronic imbalance occur? This can be explained by dissecting the energy balance equation into its various nutrient balance components.
NUTRIENT BALANCE
To determine whether positive energy balance is due to a chronic imbalance of energy intake and expenditure, it is essential to examine nutrient balance since each nutrient has its own “nutrient balance equation,” implying separate biological regulation (Fig. 2). In practical terms: is each nutrient oxidized or stored in its own compartment (separate regulation), or does it get converted into another compartment for storage.
Fig. 2.
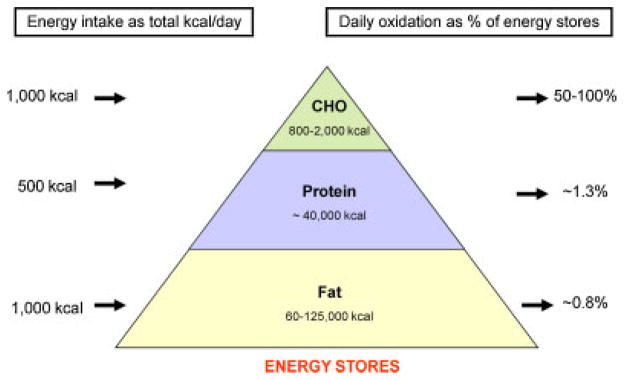
The daily energy and nutrient balance of a 70 kg man (20% body fat) in relation to macronutrient body stores, intake, and oxidation. Each macronutrient intake and oxidation on a 2,500 kcal standard American diet (composition 40% fat, 40% carbohydrate, and 20% protein) is shown on the left as absolute intake in kilocalories and on the right as a percentage of its respective nutrient store. Because carbohydrate and protein intake and oxidation rates are tightly regulated on a daily basis, any inherent differences between energy intake and energy expenditure therefore predominantly impact body fat stores. During overfeeding, carbohydrate and protein oxidation is increased to compensate for the increased intake at the expense of fat intake. However, the increase in oxidation is not equally coupled with intake. Thus, if sustained kilocalories are stored, fat stores expand, and body weight is gained. [Color figure can be seen in the online version of this article, available at http://wileyonlinelibrary.com/journal/pbc]
Protein Balance
Protein intake is usually about 15–20% of ingested calories and protein stores in the body represent about one-third of the total stored calories in a healthy 75 kg man. Daily protein intake therefore amounts to a little over 1% of total protein stores [13]. Total protein stores increase in size in response to stimuli including growth hormone, androgens, physical training, and weight gain, but do not increase simply due to increased dietary protein. As such, protein stores are tightly controlled and on a day-to-day basis protein balance is achieved [14]. Therefore, protein imbalance is not implicated as a direct cause of obesity, although, as with the other non-fat nutrients, protein intake may affect fat balance.
Carbohydrate Balance
Carbohydrates are usually the main source of dietary calories, yet the body’s stores of glycogen are very limited: 200–1,000 g on average [15]. Daily carbohydrate intake corresponds to about 50–100% of carbohydrate stores compared to about 1% for protein and fat [16], and as such carbohydrate stores fluctuate markedly compared with protein and fat stores. However, as with protein stores, carbohydrate stores are tightly regulated, possibly by endocrine and/or nervous signals exchanged between the muscle, the liver, and the brain [17]. Dietary carbohydrate stimulates both glycogen storage and glucose oxidation and suppresses fat oxidation. Carbohydrate which is not stored as glycogen is oxidized, and carbohydrate balance is achieved [16,18]. Therefore, as with the other non-fat nutrients, a chronic imbalance between carbohydrate intake and oxidation cannot be the basis of weight gain because storage capacity is limited and controlled. Conversion to fat only occurs under extreme conditions in humans and oxidation is increased to match intake [15].
Fat Balance
In stark contrast to the other nutrients, body fat stores are large and fat intake has no immediate influence on fat oxidation [13]. As with protein, the daily fat intake represents <1% of the total energy stored as fat, but the fat stores contain about six times the energy of the protein stores. Fat stores are the energy buffer for the body and a deficit of 200 kcal of energy over 24 hours means 200 kcal comes from the fat stores, and the same holds true for an excess of 200 kcal of energy which ends up in the fat stores [14]. Even during periods of spontaneous overfeeding, the entire excess fat intake is stored as body fat [17].
Ingestion of a mixed meal is followed by an increase in carbohydrate consumption and a decrease in fat oxidation, and the addition of extra fat does not alter that mix of nutrient oxidation [18]. Indeed, the amount of total body fat exerts a small, but significant effect on fat oxidation and this promotion of fat oxidation at higher body fat levels may be a mechanism for attenuating the rate of weight gain [19]. Energy balance is the driving force for fat oxidation: when it is negative (energy expenditure exceeding intake), fat oxidation increases [20]. Although after a few days, some individuals increase their fat oxidation in response to an increase in dietary fat under eucaloric conditions [20,21]. In summary, fat is the only nutrient capable of maintaining a chronic imbalance and oxidation thus contributing directly to the expansion in adipose tissue.
Alcohol Balance
There is an inconsistent relationship between reported alcohol intake and BMI [22,23]. Although it has been shown in healthy individuals that the fate of consumed alcohol is oxidation and not storage (as fat), and therefore perfect alcohol balance is achieved [24]. In the same manner as dietary carbohydrate and protein, alcohol diverts dietary fat away from oxidation and towards storage and inhibits lipolysis. Therefore, a chronic imbalance between alcohol intake and oxidation cannot be a direct cause of obesity, although by contributing to overall energy balance, it my directly influence fat balance [25].
ENERGY BALANCE IN CHILDREN
Given the dramatic increases in the prevalence of childhood obesity over the past decades [3], it is obvious there is a chronic imbalance in energy intake and/or expenditure, far exceeding the normal requirements for linear growth and tissue development in growing children. Energy balance studies in children are complex and need to consider energy partitioning into both fat and lean tissue during growth, energetic efficiency for tissue synthesis, and higher basal energy expenditure in children [26].
Indirect estimates to examine the effects of energy balance on changes in body weight have been determined from BMI distributions in populations of children and adolescents, with results varying between 46 and 360 kcal/day [6–8,27,28]. The approach taken by Swinburn et al. [8] to explain the increasing prevalence of childhood obesity was to use the concept of “settling points” (i.e., the point of dynamic balance where energy expenditure equals energy intake), reporting that an 8% increase (3.6 kg) in median body weight in 10- to 15-year-old children was explained by 19% increase in energy intake, equating to approximately 360 kcal/day. In three longitudinal studies (average follow-up of 3.4 years) this equation predicted the mean follow-up weight to within 0.5% [29–31]. Similar energy gaps have been reported using data from NHANES, with a decrease of 350 kcal/day required for reversal to the mean body weights of the 1970s [6]. Interestingly, Swinburn et al. estimated energy gaps [6–8] that are several-fold higher than originally proposed by Hill et al. (50–100 kcal/day) in 2003 [27]. Hill et al. analyzed the energy gap based on two assumptions: an energy content of weight change of 3,500 kcal/lb and a 50% efficiency of new substrate synthesis. Significantly, their study did not include children and adolescents [32].
Similar to Hill et al. [27], the longitudinal Kiel Obesity Prevention Study (KOPS) reported similar energy gap values in 2,057 normal weight children, aged 6–10 years (group A) and 10–14 years (group B) at baseline and 4 years later. The 90% percentile of energy gap in normal weight children that became overweight 4 years later was 46–58 kcal/day (group A) and 53–72 kcal/day (group B), showing that, theoretically, to prevent overweight in children, the energy gap should not exceed 46–72 kcal/day [28]. However, energy gap estimates were approximately10-fold higher in the KOPS population when the equations of Swinburn et al. were used [28]. Significantly, only one of these studies adjusted their energy gap analyses for age, sex, and pubertal status [28]. Variable levels of positive energy balance are present throughout the growth period with critical periods being the prenatal period, adiposity rebound (5–7 years), and adolescence [33,34]. Normal linear growth and tissue development must be accounted for when estimating the imbalance leading to overweight and obesity in children.
Direct assessments of energy intake and expenditure have been performed in a number of well-controlled studies in children [35,36]. The Pima Indians of Arizona are a population uniquely prone to the development of obesity and as a result, have the highest reported prevalence of type 2 diabetes in the world [37]. In longitudinal studies of Pima Indian children, anthropometric and metabolic variables track strongly (r > 0.9) from 5 to 10 years of age [38]. In these studies, we could not identify either reduced energy expenditure (RMR, TEE, or AEE) or low rates of fat oxidation measured at 5 years of age as predictors of the development of adiposity at 10 years of age [30]. Cross-sectionally, % body fat and body weight were inversely related with sports participation, suggesting that children who did not increase their physical activity as their weight increased had greater risk of developing obesity [30]. The family environment is particularly important as physical activity in childhood is explained predominantly by the shared environment [39].
LESSONS FROM CHILDHOOD CANCER
Developing and maturing organ and endocrine systems in growing children are often vulnerable to radiation therapy, chemotherapy, and surgery, leading to subsequent deleterious effects. In pediatric oncology, obesity is a well-known late effect, with studies mostly focused on acute lymphoblastic leukemia (ALL) and brain tumors. Obesity prevalence estimates in childhood ALL survivors range from 11% to 57% [40]. Consequently, children cancer survivors also have increased metabolic and cardiovascular risk factors in the long-term [41–44]. In the Childhood Cancer Survivor study of 8,599 survivors and 2,936 control siblings, survivors were 1.9, 1.6, and 1.8 times more likely than siblings to take medications for hypertension [45] and dyslipidemia [45] and have diabetes [46], respectively, 5 years after childhood cancer diagnosis. Furthermore, children who are obese at diagnosis of ALL (BMI ≥95th percentile), are 1.9 times less likely to survive and 3.5 times more likely to have treatment-related mortality [47]. How the energy balance dynamic is influenced in pediatric oncology patients at diagnosis, during treatment and after treatment is largely unknown. Most studies that have assessed obesity in cancer survivors are retrospective and relied upon BMI [40].
Reilly et al. [48–51] provided the first and only investigations of energy balance abnormalities in children treated for ALL. The authors recruited 20 children (mean age 10.9 years) with ALL who had excess weight gain and 20 controls matched for age, sex, fat-free mass, and tanner stage. Importantly, these children had not been treated with cranial radiation therapy, minimizing any possible acute effects of chemotherapy on energy balance. Using doubly labeled water, they found that children with ALL had reduced energy expenditure largely due to decreased habitual physical activity [51]. Energy intake was also lower in ALL patients by 238 kcal/day compared to controls [51]. Apart from one study [51], most studies have shown no effect of ALL on resting energy expenditure [48,52–54]. The major contributor to excess weight, with a premature adiposity rebound occurring in 81% of ALL patients by 4 years of age [49], is therefore probably due to increased energy intake, possibly related to corticosteroid use [50]. Furthermore, it is not fully elucidated whether ALL therapy that does not include cranial radiation therapy is associated with obesity [44,55–58]. Together, these observations show that children treated for ALL are predisposed to weight gain by increased energy intake and reduced energy expenditure secondary to reduced habitual activity, caused by fatigue [48,50,59,60].
To date, there have been no nutrient balance studies in children with ALL in comparison to healthy children. Prevention of obesity in ALL should focus on active monitoring of body weight and modest increases in physical activity, particularly during maintenance therapy [58]. Indeed, Moyer-Mileur et al. [61] have shown in a small randomized control trial that children (4–10 years) with ALL who underwent a 12-month home-based exercise and nutrition program had greater improvement in physical activity and cardiovascular fitness between 6 and 12 months than control children.
CONCLUSIONS AND FURTHER DIRECTIONS
The balance between energy intake and expenditure is a dynamic process. Obesity, a well-known state of positive energy imbalance, is a significant and common late effect of childhood cancer. Thus, it is imperative to understand the mechanisms of energy balance to successfully limit excess weight gain in these children. Such weight gain is associated with deleterious metabolic and cardiovascular consequences in not only survivors of childhood cancer but in all children. In order to do this, we need to learn more about carbohydrate, protein, and fat balance in children. In addition, energy balance studies in children with cancer need to be extended to other pediatric cancer groups including sarcomas, lymphomas, neuroblastomas, and Wilms tumors. All of the above have been shown to relate to future obesity and it is absolutely necessary to understand associated treatment-related complications. Future research is necessary to develop safe and effective exercise prescriptions in these patients. At the same time, making changes in the “obesogenic environment” at a society level will assist in addressing the overall obesity prevalence in the population and decrease the prevalence of obesity at cancer diagnosis.
Acknowledgments
FUNDING STATEMENT:
This article needs to be attributed to grant #P30 DK072476.
References
- 1.Flegal KM, Carroll MD, Ogden CL, et al. Prevalence and trends in obesity among US adults, 1999–2008. JAM. 2010;303:235–241. doi: 10.1001/jama.2009.2014. [DOI] [PubMed] [Google Scholar]
- 2.Ogden CL, Yanovski SZ, Carroll MD, et al. The epidemiology of obesity. Gastroenterology. 2007;132:2087–2102. doi: 10.1053/j.gastro.2007.03.052. [DOI] [PubMed] [Google Scholar]
- 3.Ogden CL, Carroll MD, Curtin LR, et al. Prevalence of high body mass index in US children and adolescents, 2007–2008. JAMA. 2010;303:242–249. doi: 10.1001/jama.2009.2012. [DOI] [PubMed] [Google Scholar]
- 4.Broyles S, Katzmarzyk PT, Srinivasan SR, et al. The pediatric obesity epidemic continues unabated in Bogalusa, Louisiana. Pediatrics. 2010;125:900–905. doi: 10.1542/peds.2009-2748. [DOI] [PMC free article] [PubMed] [Google Scholar]
- 5.Keith SW, Redden DT, Katzmarzyk PT, et al. Putative contributors to the secular increase in obesity: Exploring the roads less traveled. Int J Obes (Lond) 2006;30:1585–1594. doi: 10.1038/sj.ijo.0803326. [DOI] [PubMed] [Google Scholar]
- 6.Swinburn B, Sacks G, Ravussin E. Increased food energy supply is more than sufficient to explain the US epidemic of obesity. Am J Clin Nutr. 2009;90:1453–1456. doi: 10.3945/ajcn.2009.28595. [DOI] [PubMed] [Google Scholar]
- 7.Swinburn BA, Sacks G, Lo SK, et al. Estimating the changes in energy flux that characterize the rise in obesity prevalence. Am J Clin Nutr. 2009;89:1723–1728. doi: 10.3945/ajcn.2008.27061. [DOI] [PMC free article] [PubMed] [Google Scholar]
- 8.Swinburn BA, Jolley D, Kremer PJ, et al. Estimating the effects of energy imbalance on changes in body weight in children. Am J Clin Nutr. 2006;83:859–863. doi: 10.1093/ajcn/83.4.859. [DOI] [PubMed] [Google Scholar]
- 9.Alpert SS. Growth, thermogenesis, and hyperphagia. Am J Clin Nutr. 1990;52:784–792. doi: 10.1093/ajcn/52.5.784. [DOI] [PubMed] [Google Scholar]
- 10.Jequier E, Schutz Y. Long-term measurements of energy expenditure in humans using a respiration chamber. Am J Clin Nutr. 1983;38:989–998. doi: 10.1093/ajcn/38.6.989. [DOI] [PubMed] [Google Scholar]
- 11.Ravussin E, Lillioja S, Anderson TE, et al. Determinants of 24-hour energy expenditure in man. Methods and results using a respiratory chamber. J Clin Invest. 1986;78:1568–1578. doi: 10.1172/JCI112749. [DOI] [PMC free article] [PubMed] [Google Scholar]
- 12.Weyer C, Snitker S, Rising R, et al. Determinants of energy expenditure and fuel utilization in man: Effects of body composition, age, sex, ethnicity and glucose tolerance in 916 subjects. Int J Obes Relat Metab Disord. 1999;23:715–722. doi: 10.1038/sj.ijo.0800910. [DOI] [PubMed] [Google Scholar]
- 13.Bray GA. Treatment for obesity: A nutrient balance/nutrient partition approach. Nutr Rev. 1991;49:33–45. doi: 10.1111/j.1753-4887.1991.tb02990.x. [DOI] [PubMed] [Google Scholar]
- 14.Abbott WG, Howard BV, Christin L, et al. Short-term energy balance: Relationship with protein, carbohydrate, and fat balances. Am J Physiol. 1988;255:E332–E337. doi: 10.1152/ajpendo.1988.255.3.E332. [DOI] [PubMed] [Google Scholar]
- 15.Acheson KJ, Schutz Y, Bessard T, et al. Glycogen storage capacity and de novo lipogenesis during massive carbohydrate overfeeding in man. Am J Clin Nutr. 1988;48:240–247. doi: 10.1093/ajcn/48.2.240. [DOI] [PubMed] [Google Scholar]
- 16.Schutz Y, Flatt JP, Jequier E. Failure of dietary fat intake to promote fat oxidation: A factor favoring the development of obesity. Am J Clin Nutr. 1989;50:307–314. doi: 10.1093/ajcn/50.2.307. [DOI] [PubMed] [Google Scholar]
- 17.Rising R, Alger S, Boyce V, et al. Food intake measured by an automated food-selection system: Relationship to energy expenditure. Am J Clin Nutr. 1992;55:343–349. doi: 10.1093/ajcn/55.2.343. [DOI] [PubMed] [Google Scholar]
- 18.Flatt JP, Ravussin E, Acheson KJ, et al. Effects of dietary fat on postprandial substrate oxidation and on carbohydrate and fat balances. J Clin Invest. 1985;76:1019–1024. doi: 10.1172/JCI112054. [DOI] [PMC free article] [PubMed] [Google Scholar]
- 19.Zurlo F, Lillioja S, Esposito-Del PA, et al. Low ratio of fat to carbohydrate oxidation as predictor of weight gain: Study of 24-h RQ. Am J Physiol. 1990;259:E650–E657. doi: 10.1152/ajpendo.1990.259.5.E650. [DOI] [PubMed] [Google Scholar]
- 20.Smith SR, de Jonge L, Zachwieja JJ, et al. Fat and carbohydrate balances during adaptation to a high-fat. Am J Clin Nutr. 2000;71:450–457. doi: 10.1093/ajcn/71.2.450. [DOI] [PubMed] [Google Scholar]
- 21.Smith SR, de Jonge L, Zachwieja JJ, et al. Concurrent physical activity increases fat oxidation during the shift to a high-fat diet. Am J Clin Nutr. 2000;72:131–138. doi: 10.1093/ajcn/72.1.131. [DOI] [PubMed] [Google Scholar]
- 22.Colditz GA, Giovannucci E, Rimm EB, et al. Alcohol intake in relation to diet and obesity in women and men. Am J Clin Nutr. 1991;54:49–55. doi: 10.1093/ajcn/54.1.49. [DOI] [PubMed] [Google Scholar]
- 23.Hellerstedt WL, Jeffery RW, Murray DM. The association between alcohol intake and adiposity in the general population. Am J Epidemiol. 1990;132:594–611. doi: 10.1093/oxfordjournals.aje.a115703. [DOI] [PubMed] [Google Scholar]
- 24.Shelmet JJ, Reichard GA, Skutches CL, et al. Ethanol causes acute inhibition of carbohydrate, fat, and protein oxidation and insulin resistance. J Clin Invest. 1988;81:1137–1145. doi: 10.1172/JCI113428. [DOI] [PMC free article] [PubMed] [Google Scholar]
- 25.Suter KJ, Pohl CR, Wilson ME. Circulating concentrations of nocturnal leptin, growth hormone, and insulin-like growth factor-I increase before the onset of puberty in agonadal male monkeys: Potential signals for the initiation of puberty. J Clin Endocrinol Metab. 2000;85:808–814. doi: 10.1210/jcem.85.2.6371. [DOI] [PubMed] [Google Scholar]
- 26.Wiskin AE, Davies JH, Wootton SA, et al. Energy expenditure, nutrition and growth. Arch Dis Child. 2011;96:567–572. doi: 10.1136/adc.2009.158303. [DOI] [PubMed] [Google Scholar]
- 27.Hill JO, Wyatt HR, Reed GW, et al. Obesity and the environment: Where do we go from here? Science. 2003;299:853–885. doi: 10.1126/science.1079857. [DOI] [PubMed] [Google Scholar]
- 28.Plachta-Danielzik S, Landsberg B, Bosy-Westphal A, et al. Energy gain and energy gap in normal-weight children: Longitudinal data of the KOPS. Obesity (Silver Spring) 2008;16:777–783. doi: 10.1038/oby.2008.5. [DOI] [PubMed] [Google Scholar]
- 29.DeLany JP, Bray GA, Harsha DW, et al. Energy expenditure in African American and white boys and girls in a 2-y follow-up of the Baton Rouge Children’s Study. Am J Clin Nutr. 2004;79:268–273. doi: 10.1093/ajcn/79.2.268. [DOI] [PubMed] [Google Scholar]
- 30.Salbe AD, Weyer C, Harper I, et al. Assessing risk factors for obesity between childhood and adolescence: II. Energy metabolism and physical activity. Pediatrics. 2002;110:307–314. doi: 10.1542/peds.110.2.307. [DOI] [PubMed] [Google Scholar]
- 31.Spadano JL, Bandini LG, Must A, et al. Longitudinal changes in energy expenditure in girls from late childhood through midadolescence. Am J Clin Nutr. 2005;81:1102–1109. doi: 10.1093/ajcn/81.5.1102. [DOI] [PubMed] [Google Scholar]
- 32.Butte NF, Ellis KJ. Comment on “Obesity and the environment: Where do we go from here? Science. 2003;301:598. doi: 10.1126/science.1085985. [DOI] [PubMed] [Google Scholar]
- 33.Dietz WH. Critical periods in childhood for the development of obesity. Am J Clin Nutr. 1994;59:955–959. doi: 10.1093/ajcn/59.5.955. [DOI] [PubMed] [Google Scholar]
- 34.Rolland-Cachera MF, Deheeger M, Bellisle F, et al. Adiposity rebound in children: A simple indicator for predicting obesity. Am J Clin Nutr. 1984;39:129–135. doi: 10.1093/ajcn/39.1.129. [DOI] [PubMed] [Google Scholar]
- 35.Ball EJ, O’Connor J, Abbott R, et al. Total energy expenditure, body fatness, and physical activity in children aged 6–9 y. Am J Clin Nutr. 2001;74:524–528. doi: 10.1093/ajcn/74.4.524. [DOI] [PubMed] [Google Scholar]
- 36.Butte NF, Wong WW, Hopkinson JM, et al. Energy requirements derived from total energy expenditure and energy deposition during the first 2 y of life. Am J Clin Nutr. 2000;72:1558–1569. doi: 10.1093/ajcn/72.6.1558. [DOI] [PubMed] [Google Scholar]
- 37.Knowler WC, Pettitt DJ, Saad MF, et al. Obesity in the Pima Indians: Its magnitude and relationship with diabetes. Am J Clin Nutr. 1991;53:1543S–1551S. doi: 10.1093/ajcn/53.6.1543S. [DOI] [PubMed] [Google Scholar]
- 38.Salbe AD, Weyer C, Lindsay RS, et al. Assessing risk factors for obesity between childhood and adolescence: I. Birth weight, childhood adiposity, parental obesity, insulin, and leptin. Pediatrics. 2002;110:299–306. doi: 10.1542/peds.110.2.299. [DOI] [PubMed] [Google Scholar]
- 39.Franks PW, Ravussin E, Hanson RL, et al. Habitual physical activity in children: The role of genes and the environment. Am J Clin Nutr. 2005;82:901–908. doi: 10.1093/ajcn/82.4.901. [DOI] [PubMed] [Google Scholar]
- 40.Rogers PC, Meacham LR, Oeffinger KC, et al. Obesity in pediatric oncology. Pediatr Blood Cancer. 2005;45:881–891. doi: 10.1002/pbc.20451. [DOI] [PubMed] [Google Scholar]
- 41.Geenen MM, Bakker PJ, Kremer LC, et al. Increased prevalence of risk factors for cardiovascular disease in long-term survivors of acute lymphoblastic leukemia and Wilms tumor treated with radio-therapy. Pediatr Blood Cancer. 2010;55:690–697. doi: 10.1002/pbc.22518. [DOI] [PubMed] [Google Scholar]
- 42.Oeffinger KC, Adams-Huet B, Victor RG, et al. Insulin resistance and risk factors for cardiovascular disease in young adult survivors of childhood acute lymphoblastic leukemia. J Clin Oncol. 2009;27:3698–3704. doi: 10.1200/JCO.2008.19.7251. [DOI] [PMC free article] [PubMed] [Google Scholar]
- 43.Talvensaari KK, Lanning M, Tapanainen P, et al. Long-term survivors of childhood cancer have an increased risk of manifesting the metabolic syndrome. J Clin Endocrinol Metab. 1996;81:3051–3055. doi: 10.1210/jcem.81.8.8768873. [DOI] [PubMed] [Google Scholar]
- 44.Pietila S, Makipernaa A, Sievanen H, et al. Obesity and metabolic changes are common in young childhood brain tumor survivors. Pediatr Blood Cancer. 2009;52:853–859. doi: 10.1002/pbc.21936. [DOI] [PubMed] [Google Scholar]
- 45.Meacham LR, Chow EJ, Ness KK, et al. Cardiovascular risk factors in adult survivors of pediatric cancer—A report from the childhood cancer survivor study. Cancer Epidemiol Biomarkers Prev. 2010;19:170–181. doi: 10.1158/1055-9965.EPI-09-0555. [DOI] [PMC free article] [PubMed] [Google Scholar]
- 46.Meacham LR, Sklar CA, Li S, et al. Diabetes mellitus in long-term survivors of childhood cancer. Increased risk associated with radiation therapy: A report for the childhood cancer survivor study. Arch Intern Med. 2009;169:1381–1388. doi: 10.1001/archinternmed.2009.209. [DOI] [PMC free article] [PubMed] [Google Scholar]
- 47.Lange BJ, Gerbing RB, Feusner J, et al. Mortality in overweight and underweight children with acute myeloid leukemia. JAMA. 2005;293:203–211. doi: 10.1001/jama.293.2.203. [DOI] [PubMed] [Google Scholar]
- 48.Reilly JJ, Blacklock CJ, Dale E, et al. Resting metabolic rate and obesity in childhood acute lymphoblastic leukaemia. Int J Obes Relat Metab Disord. 1996;20:1130–1132. [PubMed] [Google Scholar]
- 49.Reilly JJ, Kelly A, Ness P, et al. Premature adiposity rebound in children treated for acute lymphoblastic leukemia. J Clin Endocrinol Metab. 2001;86:2775–2778. doi: 10.1210/jcem.86.6.7554. [DOI] [PubMed] [Google Scholar]
- 50.Reilly JJ, Brougham M, Montgomery C, et al. Effect of glucocorticoid therapy on energy intake in children treated for acute lymphoblastic leukemia. J Clin Endocrinol Metab. 2001;86:3742–3745. doi: 10.1210/jcem.86.8.7764. [DOI] [PubMed] [Google Scholar]
- 51.Reilly JJ, Ventham JC, Ralston JM, et al. Reduced energy expenditure in preobese children treated for acute lymphoblastic leukemia. Pediatr Res. 1998;44:557–562. doi: 10.1203/00006450-199810000-00015. [DOI] [PubMed] [Google Scholar]
- 52.Bond SA, Han AM, Wootton SA, et al. Energy intake and basal metabolic rate during maintenance chemotherapy. Arch Dis Child. 1992;67:229–232. doi: 10.1136/adc.67.2.229. [DOI] [PMC free article] [PubMed] [Google Scholar]
- 53.Stallings VA, Vaisman N, Chan HS, et al. Energy metabolism in children with newly diagnosed acute lymphoblastic leukemia. Pediatr Res. 1989;26:154–157. doi: 10.1203/00006450-198908000-00018. [DOI] [PubMed] [Google Scholar]
- 54.Vaisman N, Stallings VA, Chan H, et al. Effect of chemotherapy on the energy and protein metabolism of children near the end of treatment for acute lymphoblastic leukemia. Am J Clin Nutr. 1993;57:679–684. doi: 10.1093/ajcn/57.5.679. [DOI] [PubMed] [Google Scholar]
- 55.Asner S, Ammann RA, Ozsahin H, et al. Obesity in long-term survivors of childhood acute lymphoblastic leukemia. Pediatr Blood Cancer. 2008;51:118–122. doi: 10.1002/pbc.21496. [DOI] [PubMed] [Google Scholar]
- 56.Gofman I, Ducore J. Risk factors for the development of obesity in children surviving ALL and NHL. J Pediatr Hematol Oncol. 2009;31:101–107. doi: 10.1097/MPH.0b013e31818c0120. [DOI] [PubMed] [Google Scholar]
- 57.Oeffinger KC, Mertens AC, Sklar CA, et al. Obesity in adult survivors of childhood acute lymphoblastic leukemia: A report from the Childhood Cancer Survivor Study. J Clin Oncol. 2003;21:1359–1365. doi: 10.1200/JCO.2003.06.131. [DOI] [PubMed] [Google Scholar]
- 58.Withycombe JS, Post-White JE, Meza JL, et al. Weight patterns in children with higher risk ALL: A report from the Children’s Oncology Group (COG) for CCG 1961. Pediatr Blood Cancer. 2009;53:1249–1254. doi: 10.1002/pbc.22237. [DOI] [PMC free article] [PubMed] [Google Scholar]
- 59.Mayer EI, Reuter M, Dopfer RE, et al. Energy expenditure, energy intake and prevalence of obesity after therapy for acute lymphoblastic leukemia during childhood. Horm Res. 2000;53:193–199. doi: 10.1159/000023566. [DOI] [PubMed] [Google Scholar]
- 60.Warner JT, Bell W, Webb DK, et al. Daily energy expenditure and physical activity in survivors of childhood malignancy. Pediatr Res. 1998;43:607–613. doi: 10.1203/00006450-199805000-00008. [DOI] [PubMed] [Google Scholar]
- 61.Moyer-Mileur LJ, Ransdell L, Bruggers CS. Fitness of children with standard-risk acute lymphoblastic leukemia during maintenance therapy: Response to a home-based exercise and nutrition program. J Pediatr Hematol Oncol. 2009;31:259–266. doi: 10.1097/MPH.0b013e3181978fd4. [DOI] [PubMed] [Google Scholar]