

Abstract
Purpose.
Patients with Leber hereditary optic neuropathy (LHON) and cone-rod dystrophy (CRD) have central vision loss; but CRD damages the retinal photoreceptor layer, and LHON damages the retinal ganglion cell (RGC) layer. Using diffusion MRI, we measured how these two types of retinal damage affect the optic tract (ganglion cell axons) and optic radiation (geniculo-striate axons).
Methods.
Adult onset CRD (n = 5), LHON (n = 6), and healthy controls (n = 14) participated in the study. We used probabilistic fiber tractography to identify the optic tract and the optic radiation. We compared axial and radial diffusivity at many positions along the optic tract and the optic radiation.
Results.
In both types of patients, diffusion measures within the optic tract and the optic radiation differ from controls. The optic tract change is principally a decrease in axial diffusivity; the optic radiation change is principally an increase in radial diffusivity.
Conclusions.
Both photoreceptor layer (CRD) and retinal ganglion cell (LHON) retinal disease causes substantial change in the visual white matter. These changes can be measured using diffusion MRI. The diffusion changes measured in the optic tract and the optic radiation differ, suggesting that they are caused by different biological mechanisms.
Keywords: white matter, diffusion-MRI, Leber hereditary optic neuropathy, cone-rod dystrophy
Retinal disease changes the optic tract and the optic radiation in patients with ganglion cell (LHON) or receptor (CRD) dysfunction. This white matter abnormality can be measured in the living brain with diffusion MRI. These changes have implications for clinical care.
Introduction
Recent advances in neuroimaging enable us to identify major white matter fascicles in the living human and measure the tissue properties along these fascicles.1–4 These methods assess visual white matter in individual subjects. There are reports characterizing subjects with congenital blindness,5 unusual development,6 and post-surgical recovery.7 A number of groups report abnormalities of visual white matter pathways in diverse patient groups, including patients with glaucoma,8–12 optic neuritis13 and Leber hereditary optic neuropathy.14–16
Retinal dysfunction changes the central white matter, and understanding this change is significant for managing disease and developing a treatment.17,18 For example, the success rate of a retinal prosthetic implant or gene therapy may depend on the health of the central white matter pathways. Potentially, the success of a retinal pharmacological intervention may be monitored quantitatively by following changes in the white matter of the central visual pathways.
Here, we ask a basic question: Does the change in central white matter depend on which retinal layers are damaged by the disease? To answer this question, we measured the white matter in two groups of patients who have different retinal diseases but similar phenotypes. One set of patients has Leber hereditary optic neuropathy (LHON; Fig. 1B), a condition that is caused by degeneration in retinal ganglion cells (RGCs; Fig. 1B) and optic nerve loss. Leber hereditary optic neuropathy is characterized by an acute or subacute bilateral loss of central vision and is a maternally inherited genetic disease. Inheritance is mediated by point mutations in the mitochondrial DNA.19 Estimated prevalence rate is approximately 1 in 30,00020 and the onset is predominantly in young men.
Figure 1.

Left panel: OCT image of a retina in a control, LHON, and CRD subject. In each panel, the inset image in the lower left shows the position of the scan line. The main image shows the cross-section. The blue lines outline the RNFL. The red line shows the borderline between inner segment/outer segment (IS/OS) photoreceptors. (A) Control. (B) LHON. The retinal nerve fiber layer is very thin whereas the IS/OS lines are similar to the control. (C) CRD. The IS/OS line is missing, but the RNFL thickness is similar to controls. Right panel: Visual fields measured by Goldmann perimetry. Black depicts visual field regions with no sensitivity to the target.
The second set of patients has cone-rod dystrophy (CRD; Fig. 1C). These individuals, like the LHON patients, present with a central visual field loss.21 However, CRD patients have a receptor layer disease that involves cone photoreceptors and sometimes the loss of both cone and rod function (Fig. 1C). These patients often have a progressive loss from the center to peripheral vision, including night blindness. Several major genes involved with CRD are reported.22,23 Estimated prevalence rate is approximately 1 in 40,000.24
We used diffusion-weighted magnetic resonance imaging (MRI) and fiber tractography to measure properties at many points along the optic tract and the optic radiation in each patient. In both the LHON and CRD patients, the diffusion measurements (fractional anisotropy [FA]) are outside of the normal distribution of measurements in controls. These differences are large enough so that we can use diffusion measures to classify individual subjects as controls or patients. The nature of diffusion abnormalities differs between the optic tract and the optic radiation. The axial diffusivity changes in the optic tract, whereas the radial diffusivity changes in the optic radiation. Both retinal diseases cause an abnormality in the visual white matter pathways.
Materials and Methods
All procedures adhered to the tenets of the Declaration of Helsinki ethical principles for medical research involving human subjects and were approved by the ethical committees of the Jikei University School of Medicine and Tamagawa University. All subjects provided written informed consent to participate in the project.
Subjects
Experienced ophthalmologists diagnosed LHON and CRD at the Jikei University School of Medicine, Department of Ophthalmology, Tokyo, Japan (see Table 1). All subjects with LHON are in the chronic stage. All subjects with LHON and CRD were submitted to an ophthalmological examination, including best-corrected visual acuity, intraocular pressure, slit-lamp microscopy, and fundus examination. For subjects with LHON, we tested mitochondrial DNA blood test; and for both LHON and CRD subjects, we made optical coherence tomography (OCT) measurements. Control subjects (n = 14, Table 2) have normal or corrected-to-normal visual acuity and no visual field defects compared with normative data.
Table 1.
LHON and CRD Patient Profiles
|
Subject |
Sex |
Age, y |
Onset |
logMAR, R |
logMAR, L |
Scotoma, R |
Scotoma, L |
| LHON1 | M | 41 | 39 | 2 | 2 | 55*55 | 60*60 |
| LHON2 | F | 37 | 34 | 2.70 | 2.70 | 60*30 | 58*40 |
| LHON3 | M | 35 | 13 | 1.40 | 1.52 | 30*15 | 30*15 |
| LHON4 | M | 22 | 19 | 1.70 | 1.70 | 10*10 | 10*15 |
| LHON5 | M | 31 | 29 | 1.70 | 1.70 | 15*15 | 15*10 |
| LHON6 | M | 59 | 58 | 1.22 | 0.82 | 50*40 | 80*40 |
| Average | F = 1, M = 5 | 37.5 | 32.00 | 1.8 | 1.7 | ||
| CRD1 | M | 43 | 28 | 2 | 2 | 50*45 | 30*25 |
| CRD2 | F | 36 | 18 | 1.3 | 1.16 | 50*40 | 50*45 |
| CRD3 | F | 42 | 30 | 1.40 | 1.22 | 50*40 | 55*35 |
| CRD4 | M | 68 | 40 | 1.70 | 2.00 | 130*90 | 95*90 |
| CRD5 | M | 53 | 18 | 0.52 | 0.00 | 100*100 | 95*90 |
| Average | F = 2, M = 3 | 48.4 | 26.8 | 1.4 | 1.3 |
R, right eye; L, left eye.
Table 2.
Control Subject Profiles
|
Subject |
Sex |
Age, Y |
| Ctl1 | M | 27 |
| Ctl2 | M | 34 |
| Ctl3 | M | 40 |
| Ctl4 | M | 32 |
| Ctl5 | M | 31 |
| Ctl6 | M | 33 |
| Ctl7 | F | 38 |
| Ctl8 | M | 36 |
| Ctl9 | F | 24 |
| Ctl10 | M | 35 |
| Ctl11 | M | 40 |
| Ctl12 | F | 25 |
| Ctl13 | F | 26 |
| Ctl14 | M | 28 |
| Average | F = 4, M = 10 | 32.1 |
Clinical Features
All patients with LHON had a history of sudden onset of binocular central visual field loss and a mitochondrial DNA 11778-point mutation (n = 6, Table 1). Disease onset age ranged from 13 to 59 years (mean = 32 years), and disease duration ranged from age 1 to 22 years (mean = 5.5 years). No patient had a history of recovery of visual acuity. No patient was treated with idebenone.25
All patients with CRD (n = 5, Table 1) had binocular central visual field defects. Age at onset ranged from 18 to 40 years (mean = 26.8 years), and the mean duration was 21.6 years. All patients with CRD were stable with no measured change in visual acuity.
Visual Field Test
The visual fields were measured by Goldmann perimetry. We used kinetic targets and defined the absolute visual field loss as the region in which subjects could not detect the highest-contrast and largest-size stimuli V/4e; 64 mm2 (visual angle 1.72° diameter), 318 cd/m2. Typical visual fields from normal subjects and patients are shown in Figure 1 (right panel).
Optical Coherence Tomography
Structural evaluation of the retina was performed using optical coherence tomography (Cirrus HD-OCT; Carl Zeiss Meditec, Dublin, CA, USA). The optical coherence tomography data distinguish between patients with these different diseases. Typical images from a control, LHON, and CRD patient are shown in Figure 1. Compared with the control subject, the LHON subject has clear thinning of the retinal nerve fiber layer (RNFL; Fig. 1, blue) but not the inner segment/outer segment (IS/OS; Fig. 1, red) band. The subject with CRD has IS/OS thinning, but the RNFL is normal.
We measured the macular thickness and the circumpapillary retinal nerve fiber layer (cpRNFL) thickness using optic disc cube 200 × 200 scan protocol (software version 6.0; Carl Zeiss Meditec). Images with involuntary saccade, RNFL discontinuity, RNFL misalignment, or blinking artifacts and those with signal strength less than 6 were discarded. Images with algorithm segmentation failure were also excluded by visual inspection. We scanned each subject at least three times and selected the best scan for further quantification. The optic disc cube protocol scans a 6 × 6 mm2 area centered on the optic nerve head to collect 200 × 200 axial scans containing 40,000 points. The thickness of cpRNFL was measured in each of the four quadrants.
The thickness of cpRNFL in control, LHON (n = 5), and CRD (n = 4) groups are compared in Figure 2. One patient of each type was excluded because the quality of their OCT images was poor. The gray points are the normal RNFL thickness range (±1 standard deviation). These values are taken from an atlas on Asian healthy controls.26 The average cpRNFL thickness in the LHON group is significantly smaller than normal subjects; all of the subjects are more than two standard deviations below the control thickness (Fig. 2, left panel). There is no significant difference of the average RNFL thickness between control and CRD groups. However, in one CRD patient, the RNFL is nearly three standard deviations thinner than the value for healthy controls. The same general pattern is present in the RNFL thickness estimates of each of the four quadrants. It is possible that the photoreceptor damage in this subject affected the RNFL; there may be some damage of the ganglion cell layer in all CRD subjects. The size and visibility of the damage on the OCT measurements may depend on additional factors, such as the time from disease onset.
Figure 2.
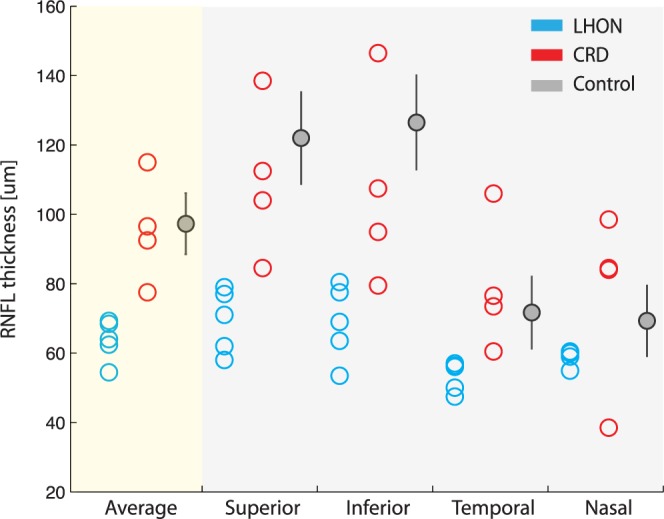
Circumpapillary retinal nerve layer thickness measured by OCT in three groups (blue: LHON; red: CRD; gray: controls). Control data are from Sung et al.26
MRI Data Acquisition
We collected high-resolution T1-weighted anatomical images for each subject using three-dimensional–spoiled gradient recalled acquisition in the steady state (SPGR) sequence (1 × 1 × 1 mm voxel size; 9 minutes, 18 seconds) acquired in the sagittal plane using a scanner (3T MAGNETOM Trio Tim; Siemens, Erlangen, Germany) with a 12-channel head coil hosted at the Tamagawa University, Tokyo, Japan. Head motion was minimized by padding and securing a strap across the forehead.
Diffusion-weighted magnetic resonance images were acquired by two repetitions of a 317s whole-brain scan. The pulse sequence was a diffusion-weighted, single-shot spin-echo, echo planar imaging sequence (93 ms echo time (TE); 7.5 seconds repetition time (TR); 230-mm field of view; 230 × 56 matrix size; ±1562 Hz/Px bandwidth). We acquired 56 axial, 1.8-mm-thick slices (no gap) for two b-values, b = 0 and b = 1000 s/mm2. The high b-value data were obtained by applying gradients along 12 diffusion directions.
Data Preprocessing
Anatomical images were aligned to the anterior commissure–posterior commissure (AC-PC) plane. To do so, we defined manually on the T1 images the location of the AC, PC, and midsagittal plane. These landmarks were used to apply a 6° rigid-body transformation to align the anatomical images to the AC-PC plane.
Diffusion-weighted images were eddy-current corrected, motion compensated, and aligned to the AC-PC plane of the high-resolution anatomical images. Diffusion-weighted images were registered to the mean of the (motion-corrected) nondiffusion-weighted (b = 0) images using a two-stage coarse-to-fine approach that maximized the normalized mutual information. The mean of the nondiffusion-weighted images was aligned automatically to the T1-image using a rigid body mutual information algorithm. Eddy-currents and subject motion correction was performed by a 14-parameter constrained nonlinear coregistration based on the expected pattern of eddy-current distortions given the phase-encode direction of the acquired data.27 An eddy-current intensity correction was applied to the diffusion-weighted images at the resampling stage.28 All raw images from the diffusion sequence were resampled to 2-mm isotropic voxels using a trilinear interpolation algorithm based on code from statistical mapping software (SPM8; University College London, http://www.fil.ion.ucl.ac.uk/spm/).28 The rotation component of the omnibus coordinate transform was applied also to the diffusion-weighting gradient directions to preserve their orientation with respect to the resampled diffusion images.
We computed the eigenvalue decomposition of the diffusion tensor, and the resulting eigenvalues were used to compute the FA.29 The fractional anisotrope is the normalized standard deviation of the three eigenvalues and indicates the degree to which the diffusion ellipsoid is anisotropic (i.e., one or two eigenvalues are larger than the mean of all three eigenvalues). The mean diffusivity is the mean of the three eigenvalues, which is equivalent to one-third of the trace of the diffusion tensor. The diffusivity along the principal axis is also called the axial diffusivity (AD). The average of the diffusivities in the two minor axes is the radial diffusivity (RD).
The image analysis software is the open source mrDiffusion package available for download at https://github.com/vistalab/vistasoft.
Definition of Regions of Interest (ROIs) for Fiber Tractography
Cortical-surface reconstruction and segmentation was performed using FreeSurfer (version 5.1.0; http://surfer.nmr.mgh.harvard.edu)30 and the AC-PC resampled high-resolution anatomical images. The FreeSurfer parcellation estimates the location of primary visual cortex31 and the optic chiasm.32
The approximate location of the lateral geniculate nucleus (LGN) was estimated manually on the high-resolution anatomical image.33 To confirm the manual definition of the LGN, we confirmed that fibers originating in the optic chiasm terminate in the LGN ROIs by using deterministic tractography. We then placed a 4-mm radius sphere that covers the LGN endpoints of fibers from the optic chiasm. The volume of LGN ROIs (268 mm3) was chosen to include the entire LGN. The average LGN volume in living human tissue measured with T1 anatomical and functional MRI was 244 mm3 in the right and 234 mm3 in the left.34 Postmortem human tissue estimates of the LGN volume range from 91 to 157 mm3.35 The difference may arise because of tissue shrinkage during postmortem processing.
White Matter Tracts Identification
We identified the optic tract and optic radiation using probabilistic fiber tractography based on ConTrack36 (https://github.com/vistalab/contrack). This tool calculates the most likely pathway between a pair of regions of interest (ROIs). ConTrack has been validated as identifying visual white matter pathways in a number of studies.3,6,7
Optic Tract
We generated a set of 5000 candidate pathways between the optic chiasm and LGN, and within the cerebral white matter. We used ConTrack scoring36 to select the 100 most likely fibers (top 2.5%). This number of streamlines spans a compact white matter region with a cross-sectional area that matches that identified in human post mortem studies of the optic tract.35
Optic Radiation
We also used ConTrack to estimate the optic radiation as the most likely pathway within the cerebral white matter that connects the LGN ROI and V1. The optic radiation is a larger and more complex path than the optic tract. Because the distance between the LGN and V1 is greater than the distance from the chiasm to the LGN, and the volume of the optic radiation is much larger than that of the optic tract, it is necessary to sample and retain many more of the candidate pathways. We sampled 100,000 streamlines and retained 30% to 50% of these. Streamlines were only excluded if they traversed a nonbiological path, such as passing through the ventricles or crossing to the other hemisphere. Typical estimates of the optic tract and optic radiation are shown in Figure 3. For several analyses, we separated the optic radiation fibers into distinct groups, according to their length.
Figure 3.
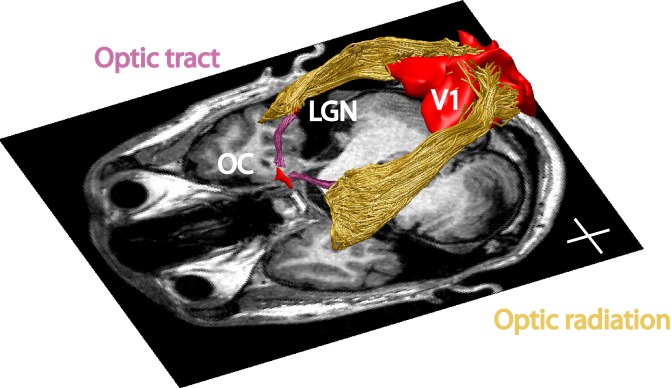
Visual white matter pathways determined by fiber tractography in a representative subject. The regions of interest (red) and tracts are shown above an axial slice of the T1-weighted image. Purple: optic tract. Yellow: optic radiation. The optic chiasm, LGN, and V1 ROIs are denoted as red volumes. Inserted cross lines are 2 cm.
Determining the Core Fiber Tract
Tissue property estimates of diffusion are measured along the core of the tract. We identify the core using an algorithm implemented in the AFQ toolbox,4 (https://github.com/jyeatman/AFQ). Specifically, we first define 100 equally spaced sample points (nodes) on each streamline. We compute the mean position of the corresponding nodes. We then calculate the distribution of fiber lengths and the 100 distributions of node positions. We identify outliers as fibers whose length exceeds 4 standard deviations of the mean, or fibers with a node whose position deviates by more than 4 standard deviations from the current core. If there are more outliers than expected for a Gaussian distribution, all the outliers are removed. The core is then recomputed, and the process is repeated. The process iterates a maximum number of five times, or until there are no more outliers to remove.
Tract Profiles
Diffusion properties were calculated at each node of each fiber using spline interpolation of the diffusion properties: FA, mean diffusivity (MD), radial diffusivity (RD), and AD. Diffusion measurements are summarized at each node of the core fiber. These are computed as a weighted average of the diffusion properties at the corresponding node of the individual streamlines. Each fiber node's contribution to the average is weighted by that node's Mahalanobis distance from the position of the core node.4,7 We summarize each fiber group with a vector of 100 values representing the diffusion measured sampled at equidistant locations along the tract core. Figure 4 is a visualization of the FA values on individual streamlines (panel B) and a summary of these FA values shown on the core fiber (panel C) from an individual subject.
Figure 4.
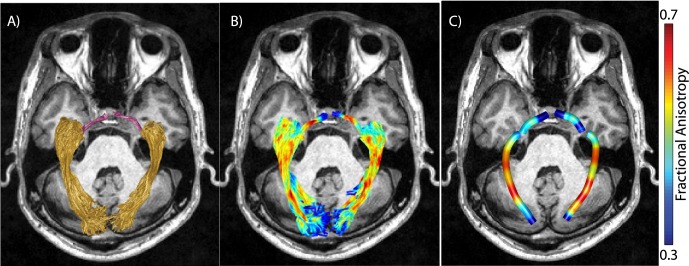
Identification of tract profiles. (A) Optic tract (purple) and optic radiation (yellow) identified in a representative subject. (B) Values of FA in optic tract and optic radiation voxels (red, high FA; blue, low FA). (C) Values of FA averaged along optic tract and optic radiation. Averaged FA values along the pathway based on weighted-linear sum of voxel-wise FA values based on the distance from the core of the pathway.
We compared the diffusion tract profiles in individual CRD and LHON patients with the distribution of tract profiles in control groups. We calculated the mean and standard deviation of the diffusion properties at each node. In both the optic tract and the optic radiation, we excluded first and last 10 data points from the main analysis because the diffusion measures at these nodes are susceptible to partial-voluming effects (n = 80). The optic tract profile and the optic radiation profile of the control groups are plotted in Figures 5, 6, and 7. This visualization enables us to compare the diffusion profiles from individual subjects with the controls, and to assess the similarity or differences between individual patients and the control population.
Figure 5.
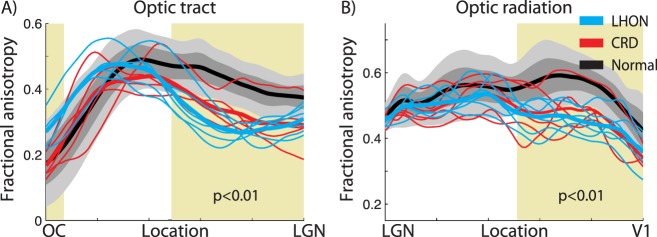
Fractional anisotropy along the core of the optic tract and the optic radiation. The two panels show the FA measures in (A) the optic tract and (B) the optic radiation. Individual LHON (blue) and CRD (red) patients are compared with the distribution of measurements from the controls (gray shaded). Thick curves show the mean of each group (LHON: blue; CRD: red; control: black). The lighter gray shades show range of ±2 SD from the control mean, and the darker gray band shows ±1 SD from the control mean. x-axis describes normalized position along the tract. Shaded yellow region indicates the portion of the tract showing a significant main effect of subject groups in FA value (one-way ANOVA, P < 0.01).
Figure 6.
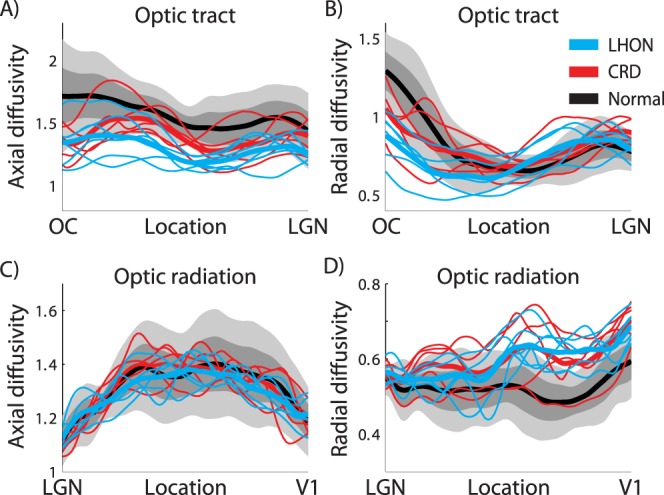
Axial diffusivity and RD along the optic tract and the optic radiation. The left two panels show the average AD measures in (A) the optic tract and (C) the optic radiation. The right two panels show the average RD measures in (B) the optic tract and (D) the optic radiation. Other conventions are identical to those in Figure 5. Unit of diffusivity is μm2/ms.
Figure 7.

Fractional anisotropy along optic radiation fibers grouped by length. In each subject, we grouped individual optic radiation fibers into five categories based on fiber length. The categories were the percentile of the fiber: (A) 0–20, (B) 20–40, (C) 40–60, (D) 60–80, and (E) 80–100 percentile from short to long. The separate panels compare the fractional anisotropy across groups in the five fiber-length categories. Other conventions are identical to those of Figures 5 and 6.
We performed a statistical analysis of the diffusion profiles to specify the spatial positions where there is a reliable difference between the patient and control groups. Specifically, we applied a one-way analysis of variance (ANOVA) in each node to identify the locations where the tract shows a main effect of group. Identifying the spatial positions where differences are clearest should be helpful in developing a reliable diagnosis.
Segmenting the Optic Radiation by Fiber Length
The optic radiation, connecting the LGN and V1, is a long and complex white matter tract with a large variation in the length of the optic radiation fibers. We divided the optic radiation into five groups according to their mean fiber length (based on percentile). In addition to the overall core, in several cases we analyze the diffusivity properties separately for these five groups.
Results
Individual Differences in Diffusion
We calculated several diffusion measures (FA, AD, and RD) along the optic tract and optic radiation. These tract profiles were measured in single patients, and the individual patient profiles were compared with the distributions of matched controls to detect white matter abnormalities.37
We identified the optic tract in all 50 hemispheres. The mean length of the tract was 3.3 ± 0.77 cm (mean ± standard deviation). The gray shaded regions in Figure 5A show the band of FA values along the length of the optic tract in the control group. The individual curves are for single patients in the LHON and CRD groups. We observed a significant main effect of subject groups in mean FA at specific regions close to the LGN (nodes 1–6, 40–80, ANOVA, P < 0.01; shaded yellow in Fig. 5A).
Beyond differences in the group means, the FA of individual patients is consistently below the 2-SD band in the region near the LGN, with the exception of one CRD patient.
We also identified the optic radiation in all hemispheres. Figure 5B shows the FA control distribution along the optic radiation (gray shaded band), and individual CRD and LHON patients. We observed a significant main effect of subject group at a location approximately two-thirds of the way from the LGN to the V1 (nodes 42–80, ANOVA, P < 0.01; shaded yellow in Fig. 5B).
Almost all of the curves from the individual patients are below the 2-SD band in the regions near V1. Again, there is one CRD subject whose profile is in the middle of the control distribution, and there is one LHON patient profile that is at the margin.
Source of the FA Differences
The fractional anisotrope values are computed from the axial and radial diffusivities. To understand the source of the FA differences in the optic tract and optic radiation, we separated out these variables (Fig. 6).
The reasons for the FA reduction in the optic tract and the optic radiation differ. In the optic tract of the two patient groups, the AD is much smaller than controls. There is only a small difference in RD. The decrease in AD results in a smaller FA (Fig. 5A). In the optic radiation, there is little difference between AD in the patients and controls. There is a large increase in the RD, and this too produces a substantial change in the FA. The radial diffusivity change in optic radiation is consistent with patients with multiple sclerosis.38 Thus, both tracts have a lower FA, but the biological reason for the lower FA differs.
Tract Profiles
The optic radiation is much larger than the optic tract, and it comprises fascicles that vary considerably in length. In the previous analysis, we treated the optic radiation as a single object despite this large variation in length (Fig. 6). Here, we separate the fascicles into five groups (by percentiles) based on fascicle length for each subject. The shortest groups carry information about the lower peripheral visual field; the longest groups carry information about the upper peripheral visual field and form Meyer's loop; the three middle groups carry foveal signals. We first measured the diffusion properties separately in each fiber length group within individual subject. We then summarized the diffusion data across subjects in each fiber length group (Fig. 7). In all five fascicle groups, FA is lower in patients than in controls over substantial portions of the tract.
Discussion
We evaluated tract profiles of the optic tract and the optic radiation, and we found that diffusivity in the optic tract and the optic radiation profiles of all LHON and the majority of CRD patients differ from the distribution of control profiles. The nature of the diffusion abnormalities differs between the optic tract and the optic radiation. In both tracts, there is a large reduction of FA; but in the optic tract, the reduction arises from a decrease in axial diffusivity, whereas the reduction of FA in the optic radiation arises from an increase in radial diffusivity. This suggests that the retinal diseases have different effects on the tissue in these two tracts. In summary, there are significant abnormalities on diffusion properties along the early visual white matter pathway in both LHON and CRD patients, and the biological nature of the tissue changes differs between optic tract and optic radiation.
RGC and Photoreceptor Damage Both Cause White Matter Abnormality
Retrograde and anterograde trans-synaptic degeneration (TSD) is a component of many neurological disorders. A number of studies observed retrograde TSD in the retinal nerve fiber layer following occipital lobe lesions.39–41 Anterograde TSD has been reported in human LGN and V1 following loss of an eye42 or glaucoma.18,43 Anterograde TSD in glaucoma is likely to be initiated by RGC damage, and this may be the reason why we observe diffusion abnormalities in the LHON patients.
We also observed a reduction of fractional anisotropy in CRD patients. In contrast to LHON patients, we did not see a large reduction of retinal fiber layer thickness in these patients, although the reduction may be present in some patients (Fig. 2). There are several reasons why photoreceptor damage, without retinal ganglion cell damage, might cause white matter degeneration in the brain. First, different mechanisms may control the thickness of the nerve fiber layer and the central white matter. The optic radiation, particularly the region we identify as different across groups (Fig. 5), is located approximately 15 cm away from the retina. The biological mechanisms regulating the myelination, axon diameter size and density in the optic radiation may differ from the mechanisms regulating RNFL thickness. For example, the optic radiation degeneration may arise from changes in LGN and V1 activity that are not communicated to the retina. Second, we observe a reduction in RNFL thickness in some of CRD patients in some portion of retina. There are several histological reports of reduction in the thickness of the RGC layer following retinitis pigmentosa, suggesting that photoreceptor damage may lead to progressive damage of the RGC.44–47 It is possible that photoreceptor damage causes progressive damage in RGC that is first detectable in the brain by diffusion imaging and only detected in the later stages of the disease in OCT measures of the RNFL.
The Organization of the Optic Radiation
The optic radiation includes both feedforward and feedback pathways.48 These projections are segregated within the optic radiation into regions that classically were called the external (feedforward) and internal (feedback) sagittal stratum.49 The precise definition of these sections of the optic radiation is challenging because of the intermixing of fibers from the inferior longitudinal fasciculus with the internal sagittal stratum. We do not believe we can distinguish the effects of these pathways in the diffusion measurements.
Anatomists frequently subdivide the radiation into distinct components, and these can be identified using tractography.3,50 There is a short, direct segment that projects directly from the LGN to anterior calcarine cortex. These fibers carry information that codes signals initiated in the lower peripheral field. The longer direct fibers carry foveal information. The longest fibers form Meyer's loop, and they carry information about the upper peripheral field. There are no reliable differences in diffusivity changes between these groups (Fig. 7).
Current diffusion MRI resolution does not resolve the crossing fibers51 within shorter angles, and there were some animal studies showing medially and laterally located axons exchanged positions in the optic radiation.52 Future comparison of diffusion MRI results across retinal diseases damaging fovea and peripheral will provide us a sense on how to identify a subportion of the optic radiation carrying a particular visual fields.
Related Work
Recent postmortem as well as diffusion MRI studies demonstrate converging evidences on the anterograde TSD in the early visual white matter pathway, caused by retinal diseases affecting retinal ganglion cells, such as glaucoma8–10,18,43,53–55 and optic neuritis.13 Two groups reported evidence of abnormal diffusion measures in the optic tract and optic radiation when comparing groups of LHON patients with controls.15,16 Our measurements of the tract profiles in individual subjects extend previous work and show that diffusion MRI is a useful tool for exploring individual patients.
By evaluating patients with CRD, which initially affects the photoreceptor layer24,56–58 and patients with LHON, which initially affects the retinal ganglion cells,59–64 we assessed whether white matter damage is specific to the retinal origin of the disease.
There was also a marginal reduction of RNFL thickness in some CRD patients (Fig. 2). Previous studies indicate that there is a reduction of RNFL thickness in patients with CRD58 and retinitis pigmentosa,46 a disease that affects the retinal pigment epithelium and photoreceptor layer in peripheral visual field.65 It appears that damage to the photoreceptor layer progressively affects the retinal ganglion layer, and here we show for the first time that the photoreceptor loss in the CRD group ultimately changes diffusion properties of the central visual white matter pathway.
There are two reports that are inconsistent with these findings. Schoth et al.66 report no changes in optic radiation diffusivity in a group comparison between five retinitis pigmentosa patients and 12 controls. Their analyses were performed by transforming all of the data to MNI template space and then selecting a large region of interest using voxels that had a 70% chance of including the optic radiation. The methods we introduce here can be applied to individual subjects at identified positions along the optic radiation. We think the different conclusions may arise because of the greater sensitivity and specificity of our measurements.
Zhang et al.67 performed a group comparison between 20 patients who became blind after the critical period (nine cases of retinitis pigmentosa, four cases of secondary glaucoma, three cases of orbit infection, three cases of sella tumors, and two cases of high fever in teenagers) and 20 controls. They appear to have manually selected a region of interest corresponding to the optic radiation, and they find no differences between the two groups. The group heterogeneity and several differences between methods explain the different conclusions.
What Are the Biological Causes of the Measured Diffusion Changes?
The axons, oligodendrocytes, and astrocytes within the major tracts form a metabolically active system. For example, in addition to forming the myelin wraps on the axons, the oligodendrocytes support axon metabolism.68 The magnetic resonance diffusion changes within the optic tract and the optic radiation may reflect changes in either the tissue structure, such as axon size or number of myelin wraps, and changes in the metabolic structures such as mitochondria within the axons and glial cells. We note that LHON arises from maternally inherited point mutations in mitochondrial DNA. A combination of decreased complex-I driven ATP production and increased free radical production causes retinal ganglion cell apoptosis.63,69 Apart from the retinal dysfunction, these patients are healthy.
We observed a reduction of axial diffusivity in the optic tract, and an increase of radial diffusivity in the optic radiation. This suggests that the TSD takes different forms in these two tracts. It is only possible to speculate at this point, but others have suggested that axial diffusivity is an indicator of axonal transport,70 whereas radial diffusivity is related to other biological processes.70–72
Clinical Implications
The possibility of central white matter pathway damage is an important consideration for clinical treatment. Clinical treatment should depend on the rate at which the central loss occurs. The LHON patients were measured after an average of 5 years of disease, while the CRD patients were measured after an average of 20 years of disease. Yet, the size of white matter abnormality measured by diffusion in LHON patients appears comparable with most CRD patients (Fig. 5). Hence, we speculate that the rate of white matter damage following the retinal disease is more rapid in LHON than CRD.
If there is a different rate of damage in these two diseases, we might follow different treatment strategies. In the case of RGC damage, it is urgent to stop or delay the white matter damage, perhaps using noninvasive stimulation of the brain using methods such as transcranial magnetic stimulation.73 If central white matter is lost, then it seems that a cortical prosthesis, rather than a retinal prosthesis, would be most effective.
In the case of photoreceptor damage, one might expect that retinal centered treatment, such as photoreceptor transplantation,74,75 gene therapy, and retinal prostheses,76,77 would be appropriate. At the same time, we observed a large reduction of fractional anisotropy in many CRD patients, but not in all CRD patients (Fig. 5). This may imply that there is some variability on the condition of the white matter pathway following CRDs across patients. It may be possible that these treatment methods will be applicable for some CRD patients, but not for all CRD patients, depending on the degree of damages along the white matter pathways. To test these ideas, and to better understand the time course of white matter damage, we propose that CRD and LHON patients be examined in longitudinal diffusion MRI studies.
We emphasize that the diffusion measurements made in individual patients can be compared with the distribution of healthy controls, and the effect size is large enough to diagnose individuals. Considering even this small sample size, we note that one of the CRD patients differs from the others: that patient falls within the control distribution (Fig. 5). Therefore, in terms of clinical care, one might decide to take a different approach with that individual.
Conclusions
This study contributes several new observations. First we compared diffusion MRI measurement on individual LHON and CRD patients with measurements from controls. The two patient groups suffer similar central visual field loss, but LHON damages RGC whereas CRD damages photoreceptor layers. The comparison between the patients and controls provides us with information about the white matter consequences of both retinal ganglion cell damage and photoreceptor cell damage. There is a significant abnormality of diffusion properties along the optic tract and the optic radiation in both patient groups.
Second, we note that the change in diffusion properties differs between the optic tract and the optic radiation. This suggests that the nature of the white matter damage differs and thus treatments should differ.
Third, we analyzed diffusion MRI in individual patients along the lengths of specific tracts. This individual subject approach contrasts to the typical group comparisons that combine data from multiple subjects and controls into a common reference frame.15 The analysis of individual subjects is appropriate for the translation into clinical studies. The analysis along the length of the tract offers more precise localization of white matter regions affected by retinal disease, and will be suitable for the application for diagnosis method in clinics.
Finally, we note that recent advances in quantitative MRI provide us the opportunity to measure the tissue properties along white matter, such as macromolecular tissue volume.78 The comparison with quantitative MRI in future studies will provide us the underlying tissue property difference between the damage in optic tract and optic radiation.
Acknowledgments
The authors thank Keigo Shikishima, Masako Takimoto, Shoyo Yoshimine, and Takaaki Hayashi for clinical evaluation of the patients, Satoshi Nakadomari for discussions, Ariel Rokem and Lee Michael Perry for technical assistance.
Supported by National Institutes of Health (NIH) Grant R01 EY15000 and NSF BCS 1228397 (BAW), JSPS Postdoctoral Fellowships for Research Abroad (HTa), and The Jikei University Reserch Fund (SO, YM).
Disclosure: S. Ogawa, None; H. Takemura, None; H. Horiguchi, None; M. Terao, None; T. Haji, None; F. Pestilli, None; J.D. Yeatman, None; H. Tsuneoka, None; B.A. Wandell, None; Y. Masuda, None
References
- 1. Dougherty RF, Ben-Shachar M, Bammer R, Brewer AA, Wandell BA. Functional organization of human occipital-callosal fiber tracts. Proc Natl Acad Sci U S A. 2005; 102: 7350–7355 [DOI] [PMC free article] [PubMed] [Google Scholar]
- 2. Huang H, Zhang J, van Zijl PCM, Mori S. Analysis of noise effects on DTI-based tractography using the brute-force and multi-ROI approach. Magn Reson Med. 2004; 52: 559–565 [DOI] [PubMed] [Google Scholar]
- 3. Sherbondy AJ, Dougherty RF, Napel S, Wandell BA. Identifying the human optic radiation using diffusion imaging and fiber tractography. J Vis. 2008; 8: 12.1–11 [DOI] [PMC free article] [PubMed] [Google Scholar]
- 4. Yeatman JD, Dougherty RF, Myall NJ, Wandell BA, Feldman HM. Tract profiles of white matter properties: automating fiber-tract quantification. PLoS One. 2012; 7: e49790 [DOI] [PMC free article] [PubMed] [Google Scholar]
- 5. Bock AS, Saenz M, Tungaraza R, Boynton GM, Bridge H, Fine I. Visual callosal topography in the absence of retinal input. Neuroimage. 2013; 81: 325–334 [DOI] [PMC free article] [PubMed] [Google Scholar]
- 6. Hoffmann MB, Kaule FR, Levin N, et al. Plasticity and stability of the visual system in human achiasma. Neuron. 2012; 75: 393–401 [DOI] [PMC free article] [PubMed] [Google Scholar]
- 7. Levin N, Dumoulin SO, Winawer J, Dougherty RF, Wandell BA. Cortical maps and white matter tracts following long period of visual deprivation and retinal image restoration. Neuron. 2010; 65: 21–31 [DOI] [PMC free article] [PubMed] [Google Scholar]
- 8. Dai H, Yin D, Hu C, et al. Whole-brain voxel-based analysis of diffusion tensor MRI parameters in patients with primary open angle glaucoma and correlation with clinical glaucoma stage. Neuroradiology. 2013; 55: 233–243 [DOI] [PMC free article] [PubMed] [Google Scholar]
- 9. Engelhorn T, Michelson G, Waerntges S, et al. A new approach to assess intracranial white matter abnormalities in glaucoma patients: changes of fractional anisotropy detected by 3T diffusion tensor imaging. Acad Radiol. 2012; 19: 485–488 [DOI] [PubMed] [Google Scholar]
- 10. Garaci FG, Bolacchi F, Cerulli A, et al. Optic nerve and optic radiation neurodegeneration in patients with glaucoma: in vivo analysis with 3-T diffusion-tensor MR imaging. Radiology. 2009; 252: 496–501 [DOI] [PubMed] [Google Scholar]
- 11. Gupta N, Greenberg G, de Tilly LN, Gray B, Polemidiotis M, Yücel YH. Atrophy of the lateral geniculate nucleus in human glaucoma detected by magnetic resonance imaging. Br J Ophthalmol. 2009; 93: 56–60 [DOI] [PMC free article] [PubMed] [Google Scholar]
- 12. Hernowo AT, Boucard CC, Jansonius NM, Hooymans JMM, Cornelissen FW. Automated morphometry of the visual pathway in primary open-angle glaucoma. Invest Ophthalmol Vis Sci. 2011; 52: 2758–2766 [DOI] [PubMed] [Google Scholar]
- 13. Ciccarelli O, Toosy AT, Hickman SJ, et al. Optic radiation changes after optic neuritis detected by tractography-based group mapping. Hum Brain Mapp. 2005; 25: 308–316 [DOI] [PMC free article] [PubMed] [Google Scholar]
- 14. Barcella V, Rocca MA, Bianchi-Marzoli S, et al. Evidence for retrochiasmatic tissue loss in Leber's hereditary optic neuropathy. Hum Brain Mapp. 2010; 31: 1900–1906 [DOI] [PMC free article] [PubMed] [Google Scholar]
- 15. Milesi J, Rocca MA, Bianchi-Marzoli S, et al. Patterns of white matter diffusivity abnormalities in Leber's hereditary optic neuropathy: a tract-based spatial statistics study. J Neurol. 2012; 259: 1801–1807 [DOI] [PubMed] [Google Scholar]
- 16. Rizzo G, Tozer KR, Tonon C, et al. Secondary post-geniculate involvement in Leber's hereditary optic neuropathy. PLoS One. 2012; 7: e50230 [DOI] [PMC free article] [PubMed] [Google Scholar]
- 17. Nucci C, Mancino R, Martucci A, et al. 3-T Diffusion tensor imaging of the optic nerve in subjects with glaucoma: correlation with GDx-VCC, HRT-III and Stratus optical coherence tomography findings. Br J Ophthalmol. 2012; 96: 976–980 [DOI] [PubMed] [Google Scholar]
- 18. Nucci C, Martucci A, Cesareo M, et al. Brain involvement in glaucoma: advanced neuroimaging for understanding and monitoring a new target for therapy. Curr Opin Pharmacol. 2013; 13: 128–133 [DOI] [PubMed] [Google Scholar]
- 19. Kirkman MA, Yu-Wai-Man P, Korsten A, et al. Gene-environment interactions in Leber hereditary optic neuropathy. Brain. 2009; 132: 2317–2326 [DOI] [PMC free article] [PubMed] [Google Scholar]
- 20. Man PYW, Griffiths PG, Brown DT, Howell N, Turnbull DM, Chinnery PF. The epidemiology of Leber hereditary optic neuropathy in the North East of England. Am J Hum Genet. 2003; 72: 333–339 [DOI] [PMC free article] [PubMed] [Google Scholar]
- 21. Thiadens AAHJ, Phan TML, Zekveld-Vroon RC, et al. Clinical course, genetic etiology, and visual outcome in cone and cone-rod dystrophy. Ophthalmology. 2012; 119: 819–826 [DOI] [PubMed] [Google Scholar]
- 22. Freund CL, Gregory-Evans CY, Furukawa T, et al. Cone-rod dystrophy due to mutations in a novel photoreceptor-specific homeobox gene (CRX) essential for maintenance of the photoreceptor. Cell. 1997; 91: 543–553 [DOI] [PubMed] [Google Scholar]
- 23. Swain PK, Chen S, Wang Q-L, et al. Mutations in the cone-rod homeobox gene are associated with the cone-rod dystrophy photoreceptor degeneration. Neuron. 1997; 19: 1329–1336 [DOI] [PubMed] [Google Scholar]
- 24. Hamel CP, Griffoin JM, Bazalgette C, et al. [Molecular genetics of pigmentary retinopathies: identification of mutations in CHM, RDS, RHO, RPE65, USH2A and XLRS1 genes]. J Fr Ophtalmol. 2000; 23: 985–995 [PubMed] [Google Scholar]
- 25. Haefeli RH, Erb M, Gemperli AC, et al. NQo1-dependent redox cycling of idebenone: effects on cellular redox potential and energy levels. PLoS One. 2011; 6: e17963 [DOI] [PMC free article] [PubMed] [Google Scholar]
- 26. Sung KR, Kim DY, Park SB, Kook MS. Comparison of retinal nerve fiber Layer thickness measured by Cirrus HD and Stratus optical coherence tomography. Ophthalmology. 2009; 116: 1264–1270.e1 [DOI] [PubMed] [Google Scholar]
- 27. Rohde GK, Barnett AS, Basser PJ, Marenco S, Pierpaoli C. Comprehensive approach for correction of motion and distortion in diffusion-weighted MRI. Magn Reson Med. 2004; 51: 103–114 [DOI] [PubMed] [Google Scholar]
- 28. Friston KJ, Ashburner J. Generative and recognition models for neuroanatomy. Neuroimage. 2004; 23: 21–24 [DOI] [PubMed] [Google Scholar]
- 29. Pierpaoli C, Jezzard P, Basser PJ, Barnett A, Di Chiro G. Diffusion tensor MR imaging of the human brain. Radiology. 1996; 201: 637–648 [DOI] [PubMed] [Google Scholar]
- 30. Fischl B. FreeSurfer. Neuroimage. 2012; 62: 774–781 [DOI] [PMC free article] [PubMed] [Google Scholar]
- 31. Fischl B, van der Kouwe A, Destrieux C, et al. Automatically parcellating the human cerebral cortex. Cereb Cortex. 2004; 14: 11–22 [DOI] [PubMed] [Google Scholar]
- 32. Desikan RS, Ségonne F, Fischl B, et al. An automated labeling system for subdividing the human cerebral cortex on MRI scans into gyral based regions of interest. Neuroimage. 2006; 31: 968–980 [DOI] [PubMed] [Google Scholar]
- 33. Horton JC, Landau K, Maeder P, Hoyt WF. Magnetic resonance imaging of the human lateral geniculate body. Arch Neurol. 1990; 47: 1201–1206 [DOI] [PubMed] [Google Scholar]
- 34. Kastner S, O'Connor DH, Fukui MM, Fehd HM, Herwig U, Pinsk MA. Functional imaging of the human lateral geniculate nucleus and pulvinar. J Neurophysiol. 2004; 91: 438–448 [DOI] [PubMed] [Google Scholar]
- 35. Andrews TJ, Halpern SD, Purves D. Correlated size variations in human visual cortex, lateral geniculate nucleus, and optic tract. J Neurosci. 1997; 17: 2859–2868 [DOI] [PMC free article] [PubMed] [Google Scholar]
- 36. Sherbondy AJA, Dougherty RF, Ben-Shachar M, Napel S, Wandell BA. ConTrack: Finding the most likely pathways between brain regions using diffusion tractography. J Vis. 2008; 8: 1–16 [DOI] [PMC free article] [PubMed] [Google Scholar]
- 37. Neil J, Miller J, Mukherjee P, Hüppi PS. Diffusion tensor imaging of normal and injured developing human brain—a technical review. NMR Biomed. 2002; 15: 543–552 [DOI] [PubMed] [Google Scholar]
- 38. Reich DS, Smith SA, Gordon-Lipkin EM, et al. Damage to the optic radiation in multiple sclerosis is associated with retinal injury and visual disability. Arch Neurol. 2009; 66: 998–1006 [DOI] [PMC free article] [PubMed] [Google Scholar]
- 39. Beatty RM, Sadun AA, Smith LEH, Vonsattel JP, Richardson EP Jr. Direct demonstration of transsynaptic degeneration in the human visual system: A comparison of retrograde and anterograde changes. J Neurol Neurosurg Psychiatry. 1982; 45: 143–146 [DOI] [PMC free article] [PubMed] [Google Scholar]
- 40. Van Buren JM. Trans-synaptic retrograde degeneration in the visual system of primates. J Neurol Neurosurg Psychiatry. 1963; 26: 402–409 [DOI] [PMC free article] [PubMed] [Google Scholar]
- 41. Jindahra P, Petrie A, Plant GT. Retrograde trans-synaptic retinal ganglion cell loss identified by optical coherence tomography. Brain. 2009; 132: 628–634 [DOI] [PubMed] [Google Scholar]
- 42. Goldby F. A note on transneuronal atrophy in the human lateral geniculate body. J Neurol Neurosurg Psychiatry. 1957; 20: 202–207 [DOI] [PMC free article] [PubMed] [Google Scholar]
- 43. Gupta N, Ang L-C, Noël de Tilly L, Bidaisee L, Yücel YH. Human glaucoma and neural degeneration in intracranial optic nerve, lateral geniculate nucleus, and visual cortex. Br J Ophthalmol. 2006; 90: 674–678 [DOI] [PMC free article] [PubMed] [Google Scholar]
- 44. Stone JL. Morphometric analysis of macular photoreceptors and ganglion cells in retinas with retinitis pigmentosa. Arch Ophthalmol. 1992; 110: 1634 [DOI] [PubMed] [Google Scholar]
- 45. Humayun MS, Prince M, de Juan E, et al. Morphometric analysis of the extramacular retina from postmortem eyes with retinitis pigmentosa. Invest Ophthalmol Vis Sci. 1999; 40: 143–148 [PubMed] [Google Scholar]
- 46. Oishi A, Ogino K, Nakagawa S, et al. Longitudinal analysis of the peripapillary retinal nerve fiber layer thinning in patients with retinitis pigmentosa. Eye (Lond). 2013; 27: 597–604 [DOI] [PMC free article] [PubMed] [Google Scholar]
- 47. Oishi A, Otani A, Sasahara M, et al. Retinal nerve fiber layer thickness in patients with retinitis pigmentosa. Eye (Lond). 2009; 23: 561–566 [DOI] [PubMed] [Google Scholar]
- 48. Kitajima M, Korogi Y, Hirai T, et al. MR changes in the calcarine area resulting from retinal degeneration. AJNR Am J Neuroradiol. 1997; 18: 1291–1295 [PMC free article] [PubMed] [Google Scholar]
- 49. Meyer A. The connections of the occipital lobes and the present status of the cerebral visual affections. Trans Assoc Am Physicians. 1907; 22: 7–16 [Google Scholar]
- 50. Ebeling U, Reulen HJ. Neurosurgical topography of the optic radiation in the temporal lobe. Acta Neurochir (Wien). 1988; 92: 29–36 [DOI] [PubMed] [Google Scholar]
- 51. Wiegell MR, Larsson HB, Wedeen VJ. Fiber crossing in human brain depicted with diffusion tensor MR imaging. Radiology. 2000; 217: 897–903 [DOI] [PubMed] [Google Scholar]
- 52. Nelson SB, LeVay S. Topographic organization of the optic radiation of the cat. J Comp Neurol. 1985; 240: 322–330 [DOI] [PubMed] [Google Scholar]
- 53. El-Rafei A, Engelhorn T, Wärntges S, Dörfler A, Hornegger J, Michelson G. Glaucoma classification based on visual pathway analysis using diffusion tensor imaging. Magn Reson Imaging. 2013; 31: 1081–1091 [DOI] [PubMed] [Google Scholar]
- 54. Murai H, Suzuki Y, Kiyosawa M, Tokumaru AM, Ishii K, Mochizuki M. Positive correlation between the degree of visual field defect and optic radiation damage in glaucoma patients. Jpn J Ophthalmol. 2013; 57: 257–262 [DOI] [PubMed] [Google Scholar]
- 55. Lu P, Shi L, Du H, et al. Reduced white matter integrity in primary open-angle glaucoma: a DTI study using tract-based spatial statistics. J Neuroradiol. 2013; 40: 89–93 [DOI] [PubMed] [Google Scholar]
- 56. Yagasaki K, Jacobson SG. Cone-rod dystrophy: phenotypic diversity by retinal function testing. Arch Ophthalmol. 1989; 107: 701–708 [DOI] [PubMed] [Google Scholar]
- 57. Wolfing JI, Chung M, Carroll J, Roorda A, Williams DR. High-resolution retinal imaging of cone–rod dystrophy. Ophthalmology. 2006; 113: 1014–1019.e1 [DOI] [PubMed] [Google Scholar]
- 58. Pasadhika S, Fishman GA, Allikmets R, Stone EM. Peripapillary retinal nerve fiber layer thinning in patients with autosomal recessive cone–rod dystrophy. Am J Ophthalmol. 2009; 148: 260–265.e1 [DOI] [PMC free article] [PubMed] [Google Scholar]
- 59. Sadun AA, Win PH, Ross-Cisneros FN, Walker SO, Carelli V. Leber's hereditary optic neuropathy differentially affects smaller axons in the optic nerve. Trans Am Ophthalmol Soc. 2000; 98: 223–232. discussion 232–235 [PMC free article] [PubMed] [Google Scholar]
- 60. Barboni P, Savini G, Valentino ML, et al. Retinal nerve fiber layer evaluation by optical coherence tomography in Leber's hereditary optic neuropathy. Ophthalmology. 2005; 112: 120–126 [DOI] [PubMed] [Google Scholar]
- 61. Savini G, Barboni P, Valentino ML, et al. Retinal nerve fiber layer evaluation by optical coherence tomography in unaffected carriers with Leber's hereditary optic neuropathy mutations. Ophthalmology. 2005; 112: 127–131 [DOI] [PubMed] [Google Scholar]
- 62. Barboni P, Carbonelli M, Savini G, et al. Natural history of Leber's hereditary optic neuropathy: longitudinal analysis of the retinal nerve fiber layer by optical coherence tomography. Ophthalmology. 2010; 117: 623–627 [DOI] [PubMed] [Google Scholar]
- 63. Yu-Wai-Man P, Griffiths PG, Chinnery PF. Mitochondrial optic neuropathies - disease mechanisms and therapeutic strategies. Prog Retin Eye Res. 2011; 30: 81–114 [DOI] [PMC free article] [PubMed] [Google Scholar]
- 64. Pan BX, Ross-Cisneros FN, Carelli V, et al. Mathematically modeling the involvement of axons in Leber's hereditary optic neuropathy. Invest Ophthalmol Vis Sci. 2012; 53: 7608–7617 [DOI] [PMC free article] [PubMed] [Google Scholar]
- 65. Hartong DT, Berson EL, Dryja TP. Retinitis pigmentosa. Lancet. 2006; 368: 1795–1809 [DOI] [PubMed] [Google Scholar]
- 66. Schoth F, Burgel U, Dorsch R, Reinges MHT, Krings T. Diffusion tensor imaging in acquired blind humans. Neurosci Lett. 2006; 398: 178–182 [DOI] [PubMed] [Google Scholar]
- 67. Zhang Y, Wan S, Ge J, Zhang X. Diffusion tensor imaging reveals normal geniculocalcarine-tract integrity in acquired blindness. Brain Res. 2012; 1458: 34–39 [DOI] [PubMed] [Google Scholar]
- 68. Fünfschilling U, Supplie LM, Mahad D, et al. Glycolytic oligodendrocytes maintain myelin and long-term axonal integrity. Nature. 2012; 485: 517–521 [DOI] [PMC free article] [PubMed] [Google Scholar]
- 69. Fraser JA, Biousse V, Newman NJ. The neuro-ophthalmology of mitochondrial disease. Surv Ophthalmol. 2010; 55: 299–334 [DOI] [PMC free article] [PubMed] [Google Scholar]
- 70. Song S-K, Sun S-W, Ju W-K, Lin S-J, Cross AH, Neufeld AH. Diffusion tensor imaging detects and differentiates axon and myelin degeneration in mouse optic nerve after retinal ischemia. Neuroimage. 2003; 20: 1714–1722 [DOI] [PubMed] [Google Scholar]
- 71. Song S-K, Sun S-W, Ramsbottom MJ, Chang C, Russell J, Cross AH. Dysmyelination revealed through MRI as increased radial (but unchanged axial) diffusion of water. Neuroimage. 2002; 17: 1429–1436 [DOI] [PubMed] [Google Scholar]
- 72. Beaulieu C. The basis of anisotropic water diffusion in the nervous system—a technical review. NMR Biomed. 2002; 15: 435–455 [DOI] [PubMed] [Google Scholar]
- 73. Rossi S, Hallett M, Rossini PM, Pascual-Leone A. Safety, ethical considerations, and application guidelines for the use of transcranial magnetic stimulation in clinical practice and research. Clin Neurophysiol. 2009; 120: 2008–2039 [DOI] [PMC free article] [PubMed] [Google Scholar]
- 74. Pearson RA. Advances in repairing the degenerate retina by rod photoreceptor transplantation. Biotechnol Adv. 2014; 32: 485–491 [DOI] [PMC free article] [PubMed] [Google Scholar]
- 75. Schwartz SD, Hubschman J-P, Heilwell G, et al. Embryonic stem cell trials for macular degeneration: a preliminary report. Lancet. 2012; 379: 713–720 [DOI] [PubMed] [Google Scholar]
- 76. Mathieson K, Loudin J, Goetz G, et al. Photovoltaic retinal prosthesis with high pixel density. Nat Photonics. 2012; 6: 391–397 [DOI] [PMC free article] [PubMed] [Google Scholar]
- 77. Weiland JD, Cho AK, Humayun MS. Retinal prostheses: current clinical results and future needs. Ophthalmology. 2011; 118: 2227–2237 [DOI] [PubMed] [Google Scholar]
- 78. Mezer A, Yeatman JD, Stikov N, et al. Quantifying the local tissue volume and composition in individual brains with magnetic resonance imaging. Nat Med. 2013; 19: 1667–1672 [DOI] [PMC free article] [PubMed] [Google Scholar]