Abstract
Disulfiram has been used as a deterrent in the treatment of alcohol abuse for almost 60 years. Our laboratory has shown that a disulfiram metabolite, S-(N, N-diethylcarbamoyl) glutathione (carbamathione) is formed from disulfiram and appears in the brain after the administration of disulfiram. Carbamathione does not inhibit ALDH2 but has been shown to be a partial non-competitive inhibitor of the N-methyl-D-aspartic acid (NMDA) glutamate receptor In light of disulfiram’s apparent clinical effectiveness in cocaine dependence, and carbamathione’s effect on the NMDA receptor, the effect of carbamathione on brain glutamate (Glu) and γ-aminobutyric acid (GABA) needed to be further examined. A CE-LIF method based on derivatization with napthalene-2,3-dicarboxyaldehyde (NDA) to simultaneously detect both neurotransmitter amino acids and carbamathione in brain microdialysis samples is described. The separation of Glu, GABA and carbamathione was carried out using a 50 mmol/L boric acid buffer (pH 9.6) on a 75 cm × 50 μm id fused-silica capillary (60 cm effective) at + 27.5 kV voltage with a run time of 11 min. The detection limits for Glu, GABA and carbamathione were 6, 10 and 15 nmol/L, respectively. This method was used to monitor carbamathione and the amino acid neurotransmitters in brain microdialysis samples from the nucleus accumbens after the administration of an intravenous dose of the drug (200 mg/kg) and revealed a carbamathione-induced change in GABA and Glu levels. This method demonstrates a simple, rapid and accurate measurement of two amino acid neurotransmitters and carbamathione for in vivo monitoring in the brain using microdialysis sampling.
Keywords: GABA, glutamate, carbamathione, microdialysis sampling
1. Introduction
Disulfiram has been used for almost 60 years as a deterrent for the treatment of alcohol abuse [1]. Most recently several clinical studies found disulfiram to have considerable promise in attenuating cocaine relapse [2–5]. Disulfiram undergoes extensive metabolism forming S-methyl N, N-diethylthiolcarbamate sulfoxide (DETC-MeSO), the metabolite responsible for the inhibition of the low Km liver aldehyde dehydrogenase (ALDH2), which is the pharmacological basis for disulfiram’s use as an alcohol deterrent [6–8]. The mechanism of action for disulfiram’s efficacy in cocaine dependence is unknown. Disulfiram’s efficacy in cocaine dependence is independent of alcohol use suggesting that inhibition of ALDH2 does not play a role in disulfiram’s action [2]. DETC-MeSO is further oxidized to the corresponding sulfone, with subsequent carbamoylation and formation of S-(N, N-diethylcarbamoyl) glutathione (carbamathione) [9, 10]. An abbreviated metabolic scheme has been given previously [11]. Carbamathione does not inhibit ALDH2 but has been shown to be a partial non-competitive inhibitor of the NMDA glutamate receptor [9, 12].
Cocaine dependence is a chronic relapsing disorder characterized by compulsive drug seeking regardless of consequences, and with repeated use addiction occurs. The neurochemical mechanisms involved are complex. Several theories have been proposed, the foremost being the role of the dopaminergic pathway although most recently evidence for a glutamatergic and GABAergic pathway has received considerable attention [13–17]. Evidence also suggests that the glutamatergic and GABAergic systems may play a role in ethanol and cocaine addiction [18–21]. In light of disulfiram’s apparent clinical effectiveness in cocaine dependence, and carbamathione’s effect on the NMDA receptor, the effect of carbamathione on brain glutamate and GABA needs to be further examined. This report, the first of a series, describes the analytical methods developed for the simultaneous detection of glutamate and GABA and carbamathione in rat brain microdialysate so that carbamathione’s effect on the glutamatergic and GABAergic systems can be better evaluated.
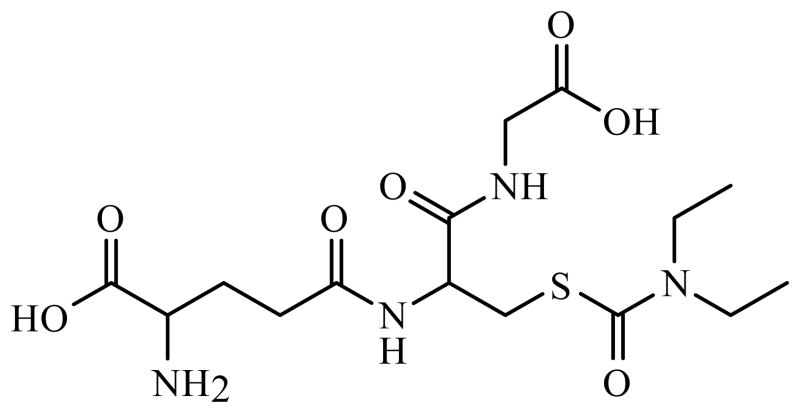
The analysis of microdialysis samples from the brain conventionally involved high performance liquid chromatography (HPLC) in conjunction with electrochemical or fluorescence detection [22–24]. These techniques display poor mass sensitivity and thus require large sample volumes, which leads to lengthy sampling times and poor temporal resolution. In contrast, capillary electrophoresis, allows the monitoring of rapid changes in brain neurotransmitters with very small volume requirements. CE-LIF has recently been used to determine various compounds in biological samples [25–27]. In the brain microdialysis samples, excitatory amino acids such as glutamate and GABA have been analyzed [28, 29]. Since neurotransmitters are not natively fluorescent, derivatization prior to separation is required. The most commonly used fluorescent reagents are fluorescein isothiocyante (FITC), o-phthadialdehyde (OPA) and napthalene-2,3-dicarboxyaldehyde (NDA) all of which react with the primary amine functionality of neurotransmitters [30–32]. For this study, NDA was chosen since it was not fluorescent itself and it reacts rapidly to give stable fluorescent cyanobenzo[f]isoindol (CBI) derivatives. The derivatization of the primary amine provided the added advantage of including carbamathione in the analysis of a sample. The structure of carbamathione is shown in Fig. 1. The CE-LIF method described in this paper provides good sensitivity and limits of detection. It also provides sufficient temporal resolution to observe changes in GABA and glutamate after administration of carbamathione.
Figure 1.
2. Materials and Methods
2.1. Chemicals and Reagents
Napthalene-2,3-dicarboxyaldehyde (NDA) was purchased from Invitrogen (Molecular Probes, Eugene, OR, USA). Sodium cyanide (NaCN) was purchased from Fluka (Buchs, Switzerland). Glutamate (Glu), γ-aminobutyric acid (GABA), α-aminoadipic acid (AAP), sodium tetraborate, boric acid and perchloric acid were purchased from Sigma (St. Louis, MO, USA). Sodium bicarbonate (NaHCO3), sodium chloride (NaCl), potassium chloride (KCl), magnesium chloride (MgCl2), calcium chloride (CaCl2), monosodium phosphate (NaH2PO4), disodium hydrogen phosphate (Na2HPO4), sodium hydroxide (NaOH), hydrochloric acid (HCl), ethanol, methanol (MeOH) and acetonitrile (ACN) were purchased from Fisher Scientific (Pittsburgh, PA, USA). Ultrapure water was obtained with a Milli-Q system (Millipore, Bedford, MA, USA). Carbamathione was synthesized using methods previously developed [36, 37]. The structure of carbamathione was confirmed by mass spectrometry and NMR (1H, D2O) [11].
2.2. Solutions
Artificial cerebrospinal fluid (aCSF) contained 145 mmol/L NaCl, 2.7 mmol/L KCl, 1.0 mmol/L MgCl2, 1.2 mmol/L CaCl2, 0.45 mmol/L NaH2PO4 and 2.33 mmol/L Na2HPO (pH 7.4). The aCSF was filtered through a 0.2 μm pore size cellulose acetate membrane filter and stored at room temperature. Standard solutions of amino acids (1 mmol/L each) were dissolved in 0.1 mol/L perchloric acid and stored at 4 °C. Borate buffer for derivatization was obtained by dissolving 7.73 g of boric acid and 11.92 g of sodium tetraborate, respectively in 250 mL of ultrapure water each. The pH of the sodium tetraborate solution was measured with a pH-meter and adjusted until 8.7 with the boric acidsolution. A 3 mmol/L NDA solution was prepared in ACN-water (50:50, v/v) weekly and stored at 4 °C. An 87 mmol/L NaCN solution was prepared in ultrapure water and stored at 4 °C. The background electrolyte (BGE) consisted of 50 mmol/L boric acid. The pH of the solution was adjusted to 9.6 with a 1 mol/L NaOH solution.
2.3. Derivatization Procedure
A borate-NaCN (100:20, v/v) was prepared by adding 20 μL of 87 mmol/L NaCN to 100 μL of the derivatization borate buffer. On the day of analysis, 5 μL of dialysate sample and 5 μL of standards were derivatized at room temperature by adding 1 μL of internal standard (10 μmol/L AAP), 1 μL of the borate-NaCN solution and 1 μL of 3 mmol/L NDA solution.
2.4. CE/LIF System
The electrophoretic system consisted of an automatic P/ACE MDQ system (Beckman-Coulter, Fullerton, CA, USA) equipped with an external LIF detector (ZETALIF, Picometrics, Toulouse, France). The excitation was performed by a He-Cd laser (Omnichrome, Chino, CA, USA) at a wavelength of 442 nm. A 50 μm id fused-silica capillary (Polymicro Technology, Phoenix, AZ, USA) was used (75 cm total length, 60 cm effective), with a separation voltage of 27.5 kV for 12 min. Each day, before the analyses were performed, the capillary was sequentially flushed at 20 psi with MeOH for 5 min, ultrapure water for 2 min, 1 mol/L HCl for 5 min, ultrapure water for 2 min, 1 mol/L NaOH for 10 min, ultrapure water for 2 min and finally with the BGE for 5 min. Between analyses, the capillary was flushed at 20 psi with 1 mol/L NaOH for 3 min, with ultrapure water for 0.5 min and then with the BGE for 1.5 min. All the solutions injected onto the capillary were sterilized using a disposable 0.22 μm PES membrane syringe filter (Millipore, Co. Cork, Ireland). Samples were introduced onto the capillary by hydrodynamic injections for 5 s at 0.5 psi. Electropherograms were acquired on 32 Karat software.
2.5. Microdialysis Experiments
2.5.1. Vascular and Brain Probes
Microdialysis samples were obtained from the brain utilizing microdialysis probes with 2 mm membranes purchased from CMA (North Chelmsford, MA, USA). The extraction efficiency of carbamathione through the microdialysis probes were estimated by delivery experiments [38]. Delivery experiments were carried out by perfusing 1 μmol/L carbamathione through the microdialysis probes in vivo at 1 μL/min, and determining the percentage that diffused through the membrane.
2.5.2. Animals and Surgery
All experiments were carried out in accordance with IACUC animal protocols. Male Sprague Dawley rats weighing 300–400 g were used for all experiments. The rats were housed in temperature controlled rooms with access to food and water ad libitum prior to surgery. The rats were initially anesthetized by isofluorane inhalation followed by an s.c. injection of a ketamine (67.5 mg/kg)/xylazine (3.4 mg/kg)/acepromazine (0.67 mg/kg) mixture. Booster doses of ketamine (1:4 dilution with saline solution) were administered by i.m. injections for the anesthetized experiments. Incision sites were prepared by shaving away as much hair as possible. The rat’s body temperature was maintained during the surgical procedure by placing the animal on microwaveable heating pads. After the surgical procedures, the rats were administered 0.5 to 3 mL/kg of saline s.c. to prevent dehydration.
The femoral vein of the rat was cannulated for i.v. dosing. A small midline skin incision was made on the inside of the leg and the femoral blood vessels were located. The large blue vein was cleared from fine connective tissue by blunt dissection and cotton swab. The femoral vein was externalized by placing a spatula under it perpendicular to the axis of the vein. A 1 cm section of femoral vein was temporarily ligated with silk ligatures. Using a pair of fine spring scissors a nick was made between ligatures and PE-10 cannula was inserted into the femoral vein to the vena cava lumen. The femoral vein was ligated on either side of the cut. The femoral cannula was then filled with saline solution and stoppered until dosing. The brain probe was implanted as previously described [11]. The rat was placed in a stereotaxic apparatus to implant the brain probe. The coordinates of the insertion site, the nucleus accumbens, relative to the bregma line were +2.2 mm anterior, +1.5 mm lateral and −6.5 mm ventral, according to the rat stereotaxic atlas [39]. A guide cannula was lowered into the nucleus accumbens using a micromanipulator and fixed in place using skull screws and dental cement. The guide cannula was later replaced with the brain probe.
2.5.3. Carbamathione Dosing and Microdialysis Sample Collection
Microdialysis samples were collected using a CMA 100 microinfusion pump and a HoneyComb fraction collector (Bioanalytical Systems Inc., West Lafayette, IN, USA). Connection of the microinjection pump and the fraction collector to the microdialysis probes was accomplished with tubing connectors (Bioanalytical Systems Inc., West Lafayette, IN, USA). After implantation, the brain probes were perfused with aCSF at 1 μL/min. The collection of 5 min samples was initiated after a 3 h waiting period for anesthetized experiments. For dosing purposes, the carbamathione dose (200 mg/kg) was prepared by adding a few drops of 1 mol/L NaHCO3 solution and bringing the volume up to 1 mL with saline solution. After the i.v. administration of carbamathione through the femoral cannula, microdialysis samples were collected for three hours. The dead volume between the microdialysis probe and the sample collection vial was determined in order to correct the time axis for this delay. All times reported are corrected for this delay. At the end of the experiments, the rats were sacrificed by placement in an isofluorane chamber for approximately thirty minutes. Rat brains were harvested in order to perform a histological confirmation of brain probe position.
2.6. Method Validation
Calibration standards for method validation contained GABA, Glu and carbamathione prepared in concentration range of 10−9–10−6 mol/L, 10−9–10−6 mol/L and 10−8–10−5 mol/L respectively. Calibration plots were plotted as the ratio of the peak area of the compound of interest to the peak area of the internal standard versus concentration (number of concentrations of each analyte, n=7). The limits of detection and quantification were calculated as the analyte concentration that resulted in peaks with signal-to-noise ratio of 3 and 10 respectively. Intra-day and inter-day reproducibility were determined using standards of Glu, GABA and carbamathione prepared in aCSF and microdialysis samples. The accuracy of the method was calculated from the analysis of standards in aCSF, microdialysis samples and microdialysis samples spiked with known concentrations of standards (in triplicate).
2.7. Data Analysis
Times presented in figures correspond to real time collection of fractions since administration of carbamathione was timed to consider the dead volume of the microdialysis system. Linear regression analysis was performed to test the linearity of the calibration curves. Changes in concentration of Glu and GABA were expressed as percent of the basal concentration, measured before drug or vehicle administration. Data are given as mean ± SEM. Comparison between treated and control rats were achieved on percentage transformed data using ANOVA and post-hoc comparison by Tukey-Kramer test. The level of significance was set at P< 0.05 for all comparisons.
3. Results and Discussion
3.1. Microdialysis Sampling Considerations
The extraction efficiency of the implanted microdialysis probes were evaluated by delivery of the compound of interest. Based on the delivery experiments, the in vitro and in vivo extraction efficiencies (mean ± SEM, n=3) for carbamathione were determined to be 11.47 ± 1.05% and 10.83 ± 1.55% respectively. The concentrations of carbamathione determined in the microdialysis samples were corrected for the extraction efficiency of the probe used. The in vitro extraction efficiency (mean ± SEM, n=3) for GABA and Glu was estimated to be 9.51 ± 0.83% and 12.96 ± 1.12% respectively. The concentrations of GABA and Glu were expressed as percent (mean ± SEM) of baseline concentrations in order to monitor changes from basal levels upon administration of carbamathione.
3.2. Analytical Considerations
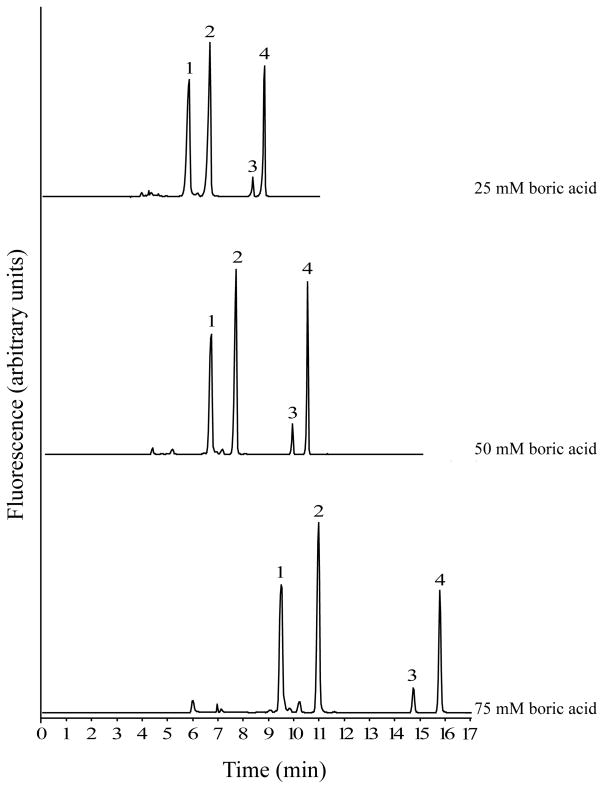
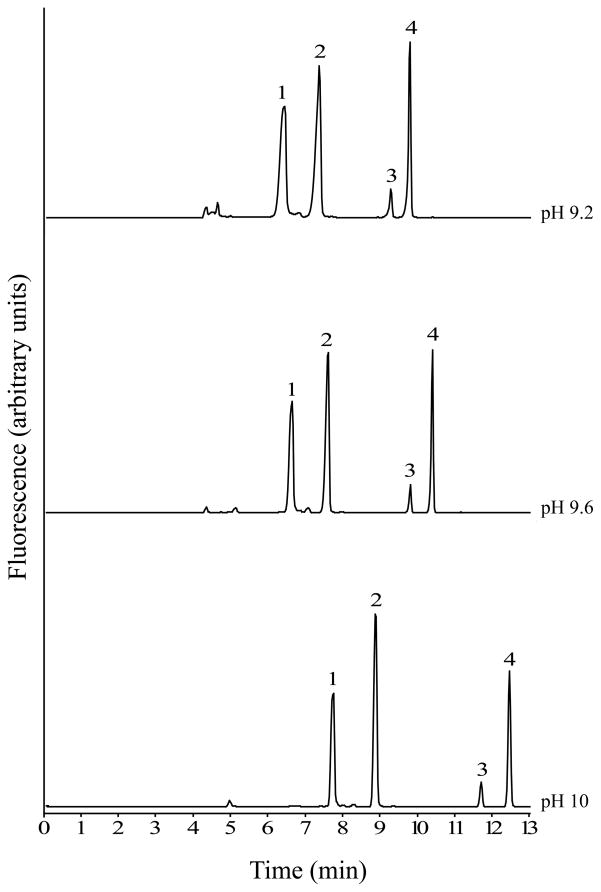
Experiments to optimize the separation buffer were carried out using standards of GABA, Glu and carbamathione prepared in aCSF and rat brain microdialysis samples. The separation of GABA, Glu, carbamathione and the IS was studied by varying the concentration and pH of the boric acid solution. Increasing the concentration of boric acid and increasing the pH both resulted in increased resolution and migration times (Fig. 2 and 3). However, when 75 mmol/L boric acid or a buffer at pH 10 was used, the currents generated at higher separation voltages (> 22.5 kV) resulted in joule heating. When 25 mmol/L boric acid or a pH 9.2 buffer was used, poor peak shapes were observed with a marked increase in the peak widths of GABA and carbamathione (Fig. 3). The run buffer ultimately chosen for the separation was 50 mmol/L boric acid at pH 9.6 because it represented a good compromise between run time and peak resolution. In addition, the currents produced with this buffer did not result in joule heating when voltages up to 30 kV were applied. The resolution data with this buffer indicated good separation between standards (R > 1.5) for all pairs tested).
Figure 2.
Figure 3.
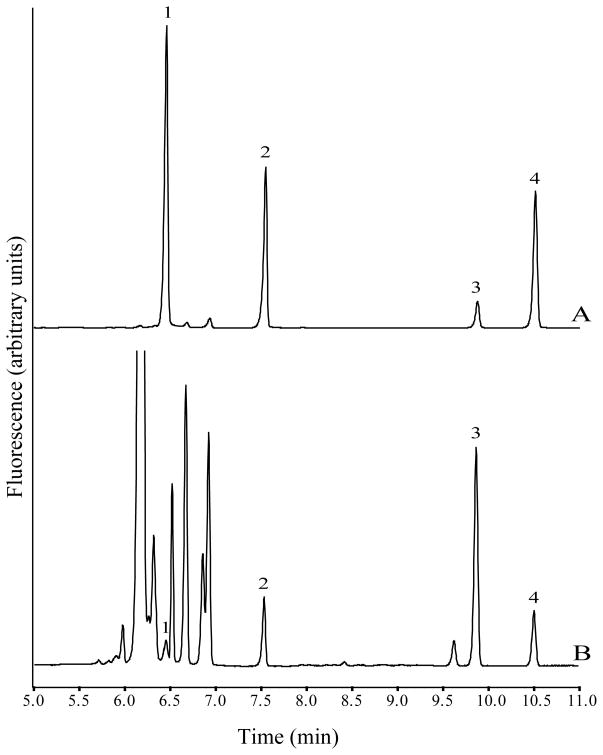
Peak identification in microdialysis samples were carried out by comparing migration times to those of standards (Fig. 4). In addition, when exogenous Glu and GABA were added to the microdialysis samples the peak heights for Glu and GABA increased and no additional peaks were observed. Background peaks associated with NDA derivatization did not interfere with any of the analytes of interest.
Figure 4.
A 5 s sample hydrodynamic injection at 0.5 psi was chosen as it appeared to be a good compromise between separation and sensitivity (data not shown). It was observed that if time of injection was increased, the width of the peaks increased and analytes were less separated. Voltages between 20–30 kV were tested and the best separation was obtained from at 27.5 kV (data not shown).
In summary, separations were carried out using 50 mmol/L boric acid buffer at pH 9.6 and a running voltage of 27.5 kV in 75 × 50 μm id fused-silica capillary (60 cm effective). Separations were performed at room temperature. Fig. 4B shows a typical electropherogram of derivatized microdialysis sample from the rat brain nucleus accumbens spiked with IS.
3.3. Method Validation
Validation was carried out in accordance to instructions for good laboratory practice [40, 41]. The following validation parameters such as linearity, precision, intra-day repeatability, inter-day repeatability, accuracy, limits of detection and quantification were determined for GABA, Glu and carbamathione in standards as well as brain microdialysis samples. The final results are shown in Table 1. The regression coefficient of the calibration obtained with standard solutions and microdialysis samples showed good linearity and led to the routine use of three point calibration curves. Limits of detection and quantification were significantly lower than concentrations measured in microdialysis samples from the nucleus accumbens.
Table 1.
Validation parameters for aCSF and microdialysis samples
| aCSF | GABA | Glu | Carbamathione |
|---|---|---|---|
| Calibration range (mol/L) | 10−9–10−6 | 10−9–10−6 | 10−8–10−5 |
| Regression coefficient of calibration (r2) | 0.9969 | 0.9981 | 0.9990 |
| Intra-assay repeatability (%RSD)a | 9.7 | 8.4 | 7.5 |
| Intra-day repeatability (%RSD)a | 6.2 | 3.9 | 4.8 |
| Inter-day repeatability (%RSD)b | 8.0 | 3.1 | 5.3 |
| Accuracy (%)c | 2.2–1.1 | 1.5–0.9 | 4.1–1.5 |
| Limits of detection (mol/L) | 1×10⁻⁸ | 6×10⁻⁹ | 1.5×10⁻⁸ |
| Limits of quantification (mol/L) | 5×10⁻⁸ | 3×10⁻⁹ | 6×10⁻⁸ |
| Microdialysis Samples | GABA | Glu | Carbamathione |
|---|---|---|---|
| Calibration range (mol/L)d | 10−9–10−6 | 10−9–10−6 | 10−8–10−5 |
| Regression coefficient of calibration (r2) | 0.9950 | 0.9978 | 0.9970 |
| Intra-assay repeatability (%RSD)a | 11.5 | 9.4 | 8.8 |
| Intra-day repeatability (%RSD)a | 7.5 | 6.7 | 6.1 |
| Accuracy (%)c | 7.6–3.6 | 2.8–1.1 | 3.0–1.9 |
n = 10
n = 3, tested concentrations of 10−7–5 × 10⁻⁷ mol/L
ten days, replicates per day
3.4. Analysis of in vivo microdialysis samples by CE/LIF
The basal concentratios of GABA in microdialysis samples from the nucleus accumbens of rat brain have previously been reported as 50 nmol/L by Huang et al. [33] and as 76 nmol/L by Hemmati et al. [35], while the concentration of Glu was reported as 1.23 μM [33] and 2.46 μM [35]. In this study, basal GABA concentrations were 83.5 ± 12.9 nmol/L and basal Glu concentrations were 1.06 ± 0.23 μmol/L. These values are within reasonable agreement with those previously reported.
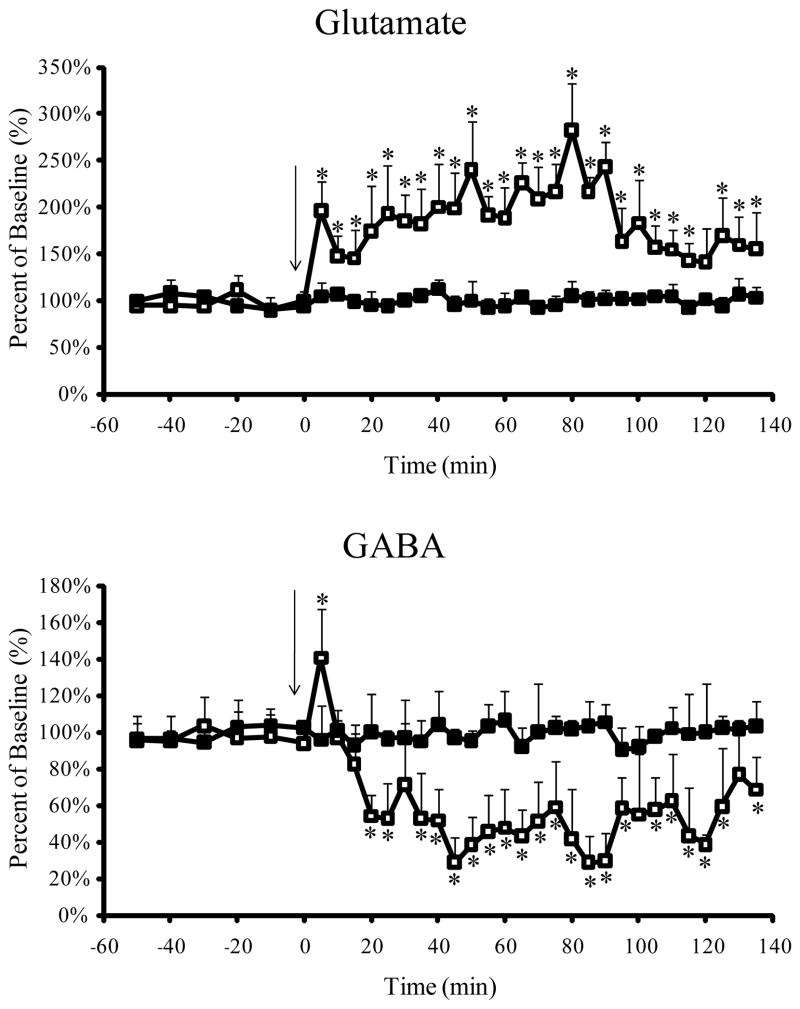
The CE-LIF method developed allowed for the study of carbamathione-induced changes in GABA and Glu simultaneously with determination of the drug in the brain. For this purpose 200 mg/kg carbamathione was administered i.v. as a bolus dose and brain microdialysis samples were collected. The effect of carbamathione administration on basal levels of GABA and Glu are shown in Fig. 5. Basal Glu concentrations were significantly increased by 91% (P< 0.05 Tukey Kramer test) from the first 5 min fraction after carbamathione administration. The increase in Glu concentration from basal levels continued over the next 2 h after carbamathione administration with a peak increase of 177% (P < 0.05 Tukey Kramer test) at the sixteenth fraction (i.e. + 80 min). Basal GABA concentrations were significantly increased by 44% (P < 0.05 Tukey Kramer test) from the first fraction following carbamathione administration, but during the next 15 min were reduced by 46% (P < 0.05 Tukey Kramer test). GABA concentrations continued to remain reduced over the next 2 h following carbamathione administration. The lowest concentration of GABA was obtained in the eighteenth fraction (i.e. + 90 min) where basal GABA concentrations were significantly reduced by 76% (P < 0.05 Tukey Kramer test).
Figure 5.
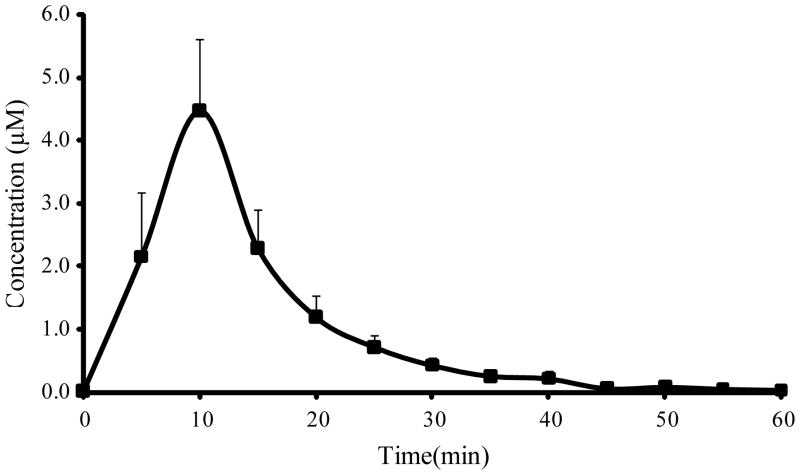
Since carbamathione is also a primary amine and can be derivatized by NDA it was included in the CE-LIF analysis of brain samples. This allowed the clearance of carbamathione from the brain to be monitored. Fig. 6 shows concentration in brain microdialysis samples versus time profile for carbamathione after the i.v. administration of carbamathione (200 mg/kg, n=5). Carbamathione concentrations increased to a peak after 10 min and then proceeded to fall exponentially. The pharmacokinetic parameters of carbamathione in brain are given in Table 2. It is important to note that the half-life of carbamathione in the brain is only 5.54 ± 0.73 min with most of the drug being cleared from the brain at 45 min after administration. However, the changes to basal concentrations of GABA and Glu upon carbamathione administration were observed to last for over 2 h (Fig. 5). This finding suggests that carbamathione may be broken down rapidly to produce more long lived metabolites that cause some of the more sustained changes from basal levels observed in GABA and Glu.
Figure 6.
Table 2.
Pharmacokinetic parameters of carbamathione in rat brain following carbamathione administration (200 mg/kg, i.v., n=5). Data expressed as mean ± SEM.
| Pharmacokinetic Parameters | Carbamathione |
|---|---|
| Cmax (μmol/L) | 4.47 ± 1.14 |
| tmax (min) | 10 |
| t1/2 (min) | 5.54 ± 0.73 |
| Kelim (1/min) | 0.13 ± 0.01 |
| AUC (μmol/L min) | 166 ± 39.6 |
Cmax = maximum concentration, tmax = time to maximum concentration, t1/2 = elimination half-life, Kelim = elimination constant, AUC = area under the dialysate concentration versus time profile
4. Concluding Remarks
The present work shows the application of a CE-LIF method for the simultaneous detection of GABA, Glu and carbamathione in rat brain dialysate. The analytical method was validated and it exhibited good linearity, accuracy and reproducibility with nanomolar detection limits. The inclusion of carbamathione in the analysis gives the added advantage of following the clearance of the drug and correlating it with changes observed in the brain neurotransmitters. Although this system has been demonstrated specifically for the determination of GABA and Glu, it can potentially be applied to any primary amine analyte in brain dialysate. By changing separation conditions, other amino acids could potentially be added to the analysis. Future studies will focus on the addition of dopamine to the present analysis because dopamine has been shown to be one of the neurotransmitters involved in the pathways associated with addiction [42, 43]. In addition, studies to determine the metabolites of carbamathione will also be carried out.
Supplementary Material
Acknowledgments
This work was supported in part by a grant from the National Institute on Drug Abuse of the National Institutes of Health to MDF, grant number DA 021727. The authors also wish to acknowledge Dr. John V. Schloss of the University of New England for his assistance in the synthesis of S-(N, N-diethylcarbamoyl) glutathione (carbamathione) and Dr. Michael Thompson of the pathology laboratory at Lawrence Memorial Hospital for his assistance with the rat brain histology.
Abbreviations
- GABA
γ-aminobutyric acid
- DETC-MeSO
S-methyl N, N-diethylthiolcarbamate sulfoxide
- ALDH2
aldehyde dehydrogenase
- NMDA
AAP, α-aminoadipic acid
- Cmax
maximum concentration
- tmax
time to maximum concentration
- t1/2
elimination half-life
- Kelim
elimination constant
- AUC
area under the dialysate concentration versus time profile
References
- 1.Hald J, Jacobsen E. Lancet. 1948;2:1001–1004. doi: 10.1016/s0140-6736(48)91514-1. [DOI] [PubMed] [Google Scholar]
- 2.Carroll KM, Fenton LR, Ball SA, Nich C, Frankforter TL, Shi J, Rounsaville BJ. Archives of general psychiatry. 2004;61:264–272. doi: 10.1001/archpsyc.61.3.264. [DOI] [PMC free article] [PubMed] [Google Scholar]
- 3.Carroll KM, Nich C, Ball SA, McCance E, Frankforter TL, Rounsaville BJ. Addiction (Abingdon, England) 2000;95:1335–1349. doi: 10.1046/j.1360-0443.2000.95913355.x. [DOI] [PubMed] [Google Scholar]
- 4.Carroll KM, Nich C, Ball SA, McCance E, Rounsavile BJ. Addiction (Abingdon, England) 1998;93:713–727. doi: 10.1046/j.1360-0443.1998.9357137.x. [DOI] [PubMed] [Google Scholar]
- 5.Petrakis IL, Carroll KM, Nich C, Gordon LT, McCance-Katz EF, Frankforter T, Rounsaville BJ. Addiction (Abingdon, England) 2000;95:219–228. doi: 10.1046/j.1360-0443.2000.9522198.x. [DOI] [PubMed] [Google Scholar]
- 6.Hart BW, Faiman MD. Biochemical pharmacology. 1992;43:403–406. doi: 10.1016/0006-2952(92)90555-w. [DOI] [PubMed] [Google Scholar]
- 7.Madan A, Faiman MD. J Pharmacol Exp Ther. 1995;272:775–780. [PubMed] [Google Scholar]
- 8.Madan A, Parkinson A, Faiman MD. Drug Metabolism and Disposition. 1995;23:1153–1162. [PubMed] [Google Scholar]
- 9.Nagendra SN, Faiman MD, Davis K, Wu JY, Newby X, Schloss JV. The Journal of biological chemistry. 1997;272:24247–24251. doi: 10.1074/jbc.272.39.24247. [DOI] [PubMed] [Google Scholar]
- 10.Nagendra SN, Madan A, Faiman MD. Biochem Pharmacol. 1994;47:1465–1467. doi: 10.1016/0006-2952(94)90350-6. [DOI] [PubMed] [Google Scholar]
- 11.Kaul S, Williams TD, Lunte CE, Faiman MD. J Pharm Biomed Anal. 2010;51:186–191. doi: 10.1016/j.jpba.2009.07.026. [DOI] [PMC free article] [PubMed] [Google Scholar]
- 12.Ningaraj NS, Chen WQ, Schloss JV, Faiman MD, Wu JY. Journal of biomedical science. 2001;8:104–113. doi: 10.1007/BF02255978. [DOI] [PubMed] [Google Scholar]
- 13.Dewey SL, Morgan AE, Ashby CR, Horan B, Kushner SA, Logan J, Volkow ND, Fowler JS, Gardner EL, Brodie JD. Synapse. 1998;30:119–129. doi: 10.1002/(SICI)1098-2396(199810)30:2<119::AID-SYN1>3.0.CO;2-F. [DOI] [PubMed] [Google Scholar]
- 14.Dewey SL, Morgan AE, Ashby CR, Logan J, Kushner SA, Kornetsky C, Volkow ND, Fowler JS, Brodie JD. J Nucl Med. 1998;39:99p–100p. [Google Scholar]
- 15.Uys JD, LaLumiere RT. Cns Neurol Disord-Dr. 2008;7:482–491. doi: 10.2174/187152708786927868. [DOI] [PubMed] [Google Scholar]
- 16.Wirkner K, Poelchen W, Koles L, Muhlberg K, Scheibler P, Allgaier C, Illes P. Neurochem Int. 1999;35:153–162. doi: 10.1016/s0197-0186(99)00057-1. [DOI] [PubMed] [Google Scholar]
- 17.Hyytia P, Koob GF. European journal of pharmacology. 1995;283:151–159. doi: 10.1016/0014-2999(95)00314-b. [DOI] [PubMed] [Google Scholar]
- 18.Karila L, Gorelick D, Weinstein A, Noble F, Benyamina A, Coscas S, Blecha L, Lowenstein W, Martinot JL, Reynaud M, Lepine JP. Int J Neuropsychoph. 2008;11:425–438. doi: 10.1017/S1461145707008097. [DOI] [PubMed] [Google Scholar]
- 19.McFarland K, Kalivas PW. Journal of Neuroscience. 2001;21:8655–8663. doi: 10.1523/JNEUROSCI.21-21-08655.2001. [DOI] [PMC free article] [PubMed] [Google Scholar]
- 20.Spanagel R. Physiol Rev. 2009;89:649–705. doi: 10.1152/physrev.00013.2008. [DOI] [PubMed] [Google Scholar]
- 21.Tsai G, Coyle JT. Annu Rev Med. 1998;49:173–184. doi: 10.1146/annurev.med.49.1.173. [DOI] [PubMed] [Google Scholar]
- 22.Piepponen TP, Skujins A. J Chromatogr B. 2001;757:277–283. doi: 10.1016/s0378-4347(01)00156-6. [DOI] [PubMed] [Google Scholar]
- 23.Smolders I, Sarre S, Michotte Y, Ebinger G. J Neurosci Meth. 1995;57:47–53. doi: 10.1016/0165-0270(94)00124-y. [DOI] [PubMed] [Google Scholar]
- 24.Manica DP, Lapos JA, Jones AD, Ewing AG. Analytical Biochemistry. 2003;322:68–78. doi: 10.1016/j.ab.2003.07.002. [DOI] [PubMed] [Google Scholar]
- 25.Benturquia N, Parrot S, Sauvinet V, Renaud B, Denoroy L. J Chromatogr B Analyt Technol Biomed Life Sci. 2004;806:237–244. doi: 10.1016/j.jchromb.2004.03.061. [DOI] [PubMed] [Google Scholar]
- 26.Parrot S, Bert L, Mouly-Badina L, Sauvinet V, Colussi-Mas J, Lambas-Senas L, Robert F, Bouilloux JP, Suaud-Chagny MF, Denoroy L, Renaud B. Cellular and molecular neurobiology. 2003;23:793–804. doi: 10.1023/A:1025009221285. [DOI] [PMC free article] [PubMed] [Google Scholar]
- 27.Zhou SY, Zuo H, Stobaugh JF, Lunte CE, Lunte SM. Analytical chemistry. 1995;67:594–599. doi: 10.1021/ac00099a017. [DOI] [PubMed] [Google Scholar]
- 28.Sauna ZE, Shukla S, Ambudkar SV. Mol Biosyst. 2005;1:127–134. doi: 10.1039/b504392a. [DOI] [PubMed] [Google Scholar]
- 29.Denoroy L, Parrot S, Renaud L, Renaud B, Zimmer L. J Chromatogr A. 2008;1205:144–149. doi: 10.1016/j.chroma.2008.07.043. [DOI] [PubMed] [Google Scholar]
- 30.O’Brien KB, Esguerra M, Klug CT, Miller RF, Bowser MT. Electrophoresis. 2003;24:1227–1235. doi: 10.1002/elps.200390158. [DOI] [PubMed] [Google Scholar]
- 31.Siri N, Lacroix M, Garrigues JC, Poinsot V, Couderc F. Electrophoresis. 2006;27:4446–4455. doi: 10.1002/elps.200600165. [DOI] [PubMed] [Google Scholar]
- 32.Dang FQ, Chen Y. Sci China Ser B. 1999;42:663–669. [Google Scholar]
- 33.Huang M, Li Z, Dai J, Shahid M, Wong EH, Meltzer HY. Neuropsychopharmacology. 2008;33:2934–2945. doi: 10.1038/npp.2008.20. [DOI] [PubMed] [Google Scholar]
- 34.Moghaddam B, Adams B, Verma A, Daly D. Journal of Neuroscience. 1997;17:2921–2927. doi: 10.1523/JNEUROSCI.17-08-02921.1997. [DOI] [PMC free article] [PubMed] [Google Scholar]
- 35.Hemmati P, Shilliam CS, Hughes ZA, Shah AJ, Roberts JC, Atkins AR, Hunter AJ, Heidbreder CA. Neurochem Int. 2001;39:199–208. doi: 10.1016/s0197-0186(01)00026-2. [DOI] [PubMed] [Google Scholar]
- 36.Jin L, Davis MR, Hu P, Baillie TA. Chemical research in toxicology. 1994;7:526–533. doi: 10.1021/tx00040a008. [DOI] [PubMed] [Google Scholar]
- 37.Schloss, J. V., in: USPTO (Ed.), A61K 038/05; A61K 031/325, U.S.A. 2007.
- 38.Zhao YP, Liang XZ, Lunte CE. Analytica Chimica Acta. 1995;316:403–410. [Google Scholar]
- 39.Paxinos G, Watson C. The Rat Brain in Stereotaxic Coordinates. Academic Press; New York: 1982. [Google Scholar]
- 40.Karnes HT, Shiu G, Shah VP. Pharm Res. 1991;8:421–426. doi: 10.1023/a:1015882607690. [DOI] [PubMed] [Google Scholar]
- 41.O’Shea TJ, Weber PL, Bammel BP, Lunte CE, Lunte SM, Smyth MR. J Chromatogr. 1992;608:189–195. doi: 10.1016/0021-9673(92)87123-p. [DOI] [PubMed] [Google Scholar]
- 42.Di Chiara G, Bassareo V, Fenu S, De Luca MA, Spina L, Cadoni C, Acquas E, Carboni E, Valentini V, Lecca D. Neuropharmacology. 2004;47:227–241. doi: 10.1016/j.neuropharm.2004.06.032. [DOI] [PubMed] [Google Scholar]
- 43.Koob GF, Le Moal M. Annu Rev Psychol. 2008;59:29–53. doi: 10.1146/annurev.psych.59.103006.093548. [DOI] [PubMed] [Google Scholar]
Associated Data
This section collects any data citations, data availability statements, or supplementary materials included in this article.


