

Abstract
Ribosomally synthesized and posttranslationally modified peptides (RiPPs), especially from microbial sources, are a large group of bioactive natural products that are a promising source of new (bio)chemistry and bioactivity.1 In light of exponentially increasing microbial genome databases and improved mass spectrometry (MS)-based metabolomic platforms, there is a need for computational tools that connect natural product genotypes predicted from microbial genome sequences with their corresponding chemotypes from metabolomic data sets. Here, we introduce RiPPquest, a tandem mass spectrometry database search tool for identification of microbial RiPPs, and apply it to lanthipeptide discovery. RiPPquest uses genomics to limit search space to the vicinity of RiPP biosynthetic genes and proteomics to analyze extensive peptide modifications and compute p-values of peptide-spectrum matches (PSMs). We highlight RiPPquest by connecting multiple RiPPs from extracts of Streptomyces to their gene clusters and by the discovery of a new class III lanthipeptide, informatipeptin, from Streptomyces viridochromogenes DSM 40736 to reflect that it is a natural product that was discovered by mass spectrometry based genome mining using algorithmic tools rather than manual inspection of mass spectrometry data and genetic information. The presented tool is available at cyclo.ucsd.edu.
Discovery of microbial natural products by use of genome information is a promising approach to find new pharmaceutically valuable and ecologically important molecules.2 Genome mining consists of a “prediction step” in which secondary metabolic pathways and their corresponding products are predicted from a genome sequence and a “connection step” in which an unknown natural product (chemotype) is linked to its biosynthetic gene cluster (genotype) based on information derived from the prediction step.3 In current genome mining approaches, the “prediction step” has been starting to be automated by use of computational tools such as antiSMASH to rapidly characterize biosynthetic gene clusters in microbial genome sequences.4 However, the “connection step” is time-consuming because only one target pathway is characterized in its product, for example, by genome manipulation or heterologous pathway expression. Here, we introduce the first genome mining tool that automates both prediction and connection steps for the discovery of ribosomally synthesized and posttranslationally modified peptides (RiPPs), specifically, lanthipeptides, from genome sequenced microbes and their metabolomes.
RiPPs are a rapidly expanding group of natural products produced through the Post Ribosomal Peptide Synthesis (PRPS) pathway.1 Among RiPPs, lanthipeptides are a prominent group of peptides with pharmaceutical and food industrial applications.5 Lanthipeptides are structurally defined by the thioether amino acids lanthionine, methyllanthionine and labionin (Supporting Information (SI) Figure S1). Lanthionine and methyllanthionine are introduced by dehydration of a serine or threonine to generate a dehydroalanine or dehydrobutyrine and addition of a cysteine thiol, catalyzed by a dehydratase and a cyclase, respectively.1,5 During lanthipeptide biosynthesis, a precursor gene lanA is translated by the ribosome to yield a precursor peptide LanA that consists of a N-terminal leader peptide and a C-terminal core peptide sequence. The core peptide is posttranslationally modified by the lanthionine biosynthetic machinery and other enzymes, proteolytically cleaved from the leader peptide to yield the mature lanthipeptide and exported out of the cell by transporters (SI Figure S1).1,5 Lanthipeptides are divided into four classes based on their lanthionine synthetase genes. Class I lanthipeptides are formed by a separate dehydratase (LanB) and lanthionine cyclase (LanC), class II lanthipeptides by a bifunctional lanthionine synthetase (LanM) with a dehydratase and a cyclase domain, class III and class IV lanthipeptides by a lanthionine synthetase with a lyase, a kinase, and a cyclase domain where class III lanthipeptide synthetases (LanKC) lack zinc-binding residues in the cyclase domain.1 Interestingly, class III lanthipeptides are structurally characterized by a special lanthionine modification, called labionin. Labionin is a triamino acid derived from a Ser(1)-X3-Ser(2)-X2–3-Cys motif. It consists of a Ser(2)-Cys lanthionine bridge and a Ser(1)-Ser(2) methylene bridge via a quartenary α-carbon at Ser(2), thus forming two ring systems within a peptide chain (SI Figure S1).1,6
The automated detection of lanthipeptides has been historically difficult due to their complex posttranslational modifications and high molecular weight.7 Increased understanding of lanthipeptide biosynthesis and accelerated sequencing of microbial genomes enabled characterization of lanthipeptides by genome mining of lanthionine synthetase genes.8,9 Recent studies suggest that RiPPs such as lanthipeptides are widely distributed among bacterial genomes and that many microbial lanthipeptides remain to be discovered.9−11
Since RiPPs are directly encoded in the genome as are proteins, a proteomic approach could be used to connect a RiPP chemotype with its genotype, that is, by matching a tandem MS spectrum of the RiPP with a peptide in the protein database of the target genome by a MS/MS database search tool. However, common proteomic database search tools such as Sequest12 and Mascot13 fail to identify RiPPs because (i) they have difficulty identifying highly modified peptides,14 (ii) they have difficulty identifying poorly fragmented spectra typical for RiPPs with complex modifications, and (iii) they are unable to identify nonlinear peptides.11 Moreover, genes encoding lanthipeptides are typically shorter than 100 amino acids and are often missed by existing gene prediction tools and not included in a target protein databases.15
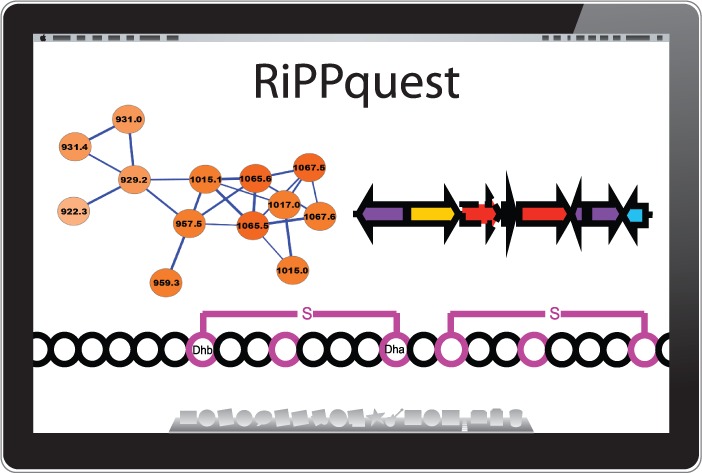
A recent study introduced a peptidogenomic approach for the rapid characterization of RiPPs by MS-guided genome mining.11 Herein, de novo tandem MS sequence tags of RiPPs were obtained by manual MS/MS analysis and searched against the 6-frame translation of a target genome under consideration of biosynthetic and gas phase modifications of target core peptide sequences. The manual peptidogenomic approach relies on characterization of long MS/MS sequence tags of 4–5 amino acids (aa) and a reduction of the search space in the 6-frame translation of a microbial genome by consideration of only <100 aa-long ORFs. Since long sequence tags are often not present in macrocyclic RiPPs such as lanthipeptides and since manual peptidogenomic analysis of large metabolic LC-MS/MS data sets is limited, we implemented the peptidogenomic approach in a MS/MS database search tool, called RiPPquest, with computation of statistical significance for identified Peptide-Spectrum Matches (PSMs) to enable analysis of larger data sets (Figure 1). To overcome the weaknesses of proteomic MS/MS database tools to identify RiPPs, RiPPquest was specified in peptide database generation and peptide-spectrum matching for a connection of lanthipeptide MS/MS data with lanthipeptide gene clusters in microbial genomes.
Figure 1.

Workflow implemented in the RiPPquest algorithm for automated peptidogenomics of RiPPs. (a) Prediction of lanthipeptide gene clusters in microbial genome sequence. (b) Generation of 10 kb windows centered at LANC-domain of gene clusters. (c) Prediction of ORFs in each gene cluster. (d) Selection of all candidate precursor peptides ORFs <100 aa. (e) Generation of candidate core peptides via C-terminal half of each selected ORF. (f) Generation of all biosynthetic and gas phase products of each core peptide, exemplified by peptide TFCRS. (g) Generation of MS/MS peptide database of predicted lanthipeptide products. (h) MS/MS analysis of microbial extract. (i) Matching of MS/MS data with MS/MS lanthipeptide spectral database with computed p-values. (j) Molecular network analysis of MS/MS data to identify peptide homologues and to confirm PSMs.
Results and Discussion
RiPPquest Workflow
The RiPPquest workflow (Figure 1) starts with generation of a lanthipeptide database from a target microbial genome (Figure 1a–g). First, all lanthipeptide gene clusters are predicted in the target genome (Figure 1a). We selected the LANC-like domain (Pfam PF05147) for Pfam domain search of lanthipeptide gene clusters in RiPPquest due to its high specificity to lanthipeptide pathways (SI Figure S2). Then, ORFs <100 aa were predicted in the 6-frame translation of a 10 kb window centered at the LANC-like domain (Figure 1b–d). Only the C-terminal half of the selected ORFs were considered in the core peptide database (Figure 1e). Subsequently, MS/MS spectra of all possible mature lanthipeptides were computed for each putative core peptide based on possible biosynthetic transformations and gas phase reactions in lanthipeptides (Figure 1f,g, Methods, SI Methods). Next, peptide-spectrum matches were scored in order to identify candidate lanthipeptide chemotype-genotype connections between the LC-MS/MS data and the genome-derived lanthipeptide database (Figure 1i). We chose to score PSMs using a scoring function used in de novo peptide sequencing PepNovo.16 In the brute force approach, one forms PSMs between each spectrum in the spectral data set and each modified core peptide if the parent masses of the spectrum and the modified core peptide are close to each other, that is, within 0.5 Da. Because it is time-consuming to compare each spectrum against each possible modified peptide for large spectral data sets, we use the spectral alignment technique to efficiently find modifications of the core peptide that best matches the spectrum.17−20 In the next step, PSM scores were converted to p-values to make lanthipeptide chemotype-genotype connections more reliable. While PSM scores are useful for selecting top-scoring PSMs, they are notoriously unreliable for estimating the statistical significance of PSMs.21 To convert scores into p-values, RiPPquest uses a recently developed algorithm to obtain statistical matches for nonlinear peptides called MS-DPR used in the evaluation of PSMs.22 While there are other methods for evaluating p-values, MS-DPR (Direct Probality Distribution) is the only approach available today for evaluating p-values of PSMs formed by nonlinear, for example, cyclic peptides. Finally, a molecular network was generated from the MS/MS data set to identify homologues of characterized lanthipeptide from top-scored PSMs (Figure 1j). Molecular network is a visualization of spectra as familial groupings of corresponding molecules.23,24,29 Edges in a molecular network connect nodes corresponding to spectra that represent molecules, in this case peptides, differing from each other by a mutation or a modification. Such pairs of spectra connected by edges in the molecular network are revealed using the spectral alignment approach.18,20 Molecular networking enables discovery of uncharacterized homologues of known peptides, and families of related peptides and increases reliability of RiPPquest peptide identification. Most classes of RiPPs form families of related peptides, making molecular networks helpful in RiPP analysis.24
Connection of Lanthipeptide Chemotypes with Their Genotypes by RiPPquest
We tested the RiPPquest algorithm in the connection of lanthipeptide chemotypes with their genotypes in microbial genomes by analysis of LC-ESI-MS/MS, LC-HCD-MS/MS, and ESI-MS/MS data sets of organic extracts from 16 genome sequenced Streptomyces strains (SI Table S1). Genome mining revealed a total of 49 candidate lanthipeptide biosynthetic gene clusters in the 16 Streptomyces strains (SI Figure S3). The automated peptidogenomic pipeline identified six known lanthipeptides families from the target strains: SRO-2212 and SRO-3108 from Streptomyces roseosporus NRRL 15998,11 AmfS from S. griseus IFO 13350,25 SapB from S. coelicolor A32 and S. lividans TK24,7 and SAL-2242 from S. albus J107411 (Table 1; SI Figure S4). The sheer number of lanthipeptide analogues was unexpected and not discovered manually.
Table 1. Top Lanthipeptides Discovered by the RiPPquest Automated Peptidogenomics Pipelinea.
| peptide | species | MS/MS type | MS/MS precursor [m/z] | z | p-value | annotation |
|---|---|---|---|---|---|---|
| informati-peptin | S. viridochromogenes DSM 40 736 | CID | 1065.56 | 2 | 9.2 × 10⁻⁸ | TDGGGASTVSLLSCISAASVLLCL (6 Dehyd) |
| S. viridochromogenes DSM 40 736 | HCD | 1065.54 | 2 | 0.005 | TDGGGASTVSLLSCISAASVLLCL (6 Dehyd) | |
| S. viridochromogenes DSM 40 736 | CID | 1015.02 | 2 | 0.013 | DGGGASTVSLLSCISAASVLLCL (6 Dehyd) | |
| S. viridochromogenes DSM 40 736 | HCD | 1015.02 | 2 | 0.03 | DGGGASTVSLLSCISAASVLLCL (6 Dehyd) | |
| S. viridochromogenes DSM 40 736 | CID | 957.51 | 2 | 0.0026 | GGGASTVSLLSCISAASVLLCL (6 Dehyd) | |
| S. viridochromogenes DSM 40 736 | HCD | 957.50 | 2 | 0.0098 | GGGASTVSLLSCISAASVLLCL (6 Dehyd) | |
| S. viridochromogenes DSM 40 736 | CID | 928.49 | 2 | 0.0003 | GGASTVSLLSCISAASVLLCL (6 Dehyd) | |
| S. viridochromogenes DSM 40 736 | HCD | 928.99 | 2 | 0.012 | GGASTVSLLSCISAASVLLCL (6 Dehyd) | |
| AmfS | S. griseus IFO 13 350 | CID | 1028.04 | 2 | 2.5 × 10⁻¹⁰ | GSQVSLLVCEYSSLSVVLCTP (4 Dehyd) |
| SRO-2212 | S. roseosporus NRRL 15 998 | CID | 1107.07 | 2 | 6.3 × 10⁻¹⁰ | TGSQVSLLVCEYSSLSVVLCTP (4 Dehyd) |
| S. roseosporus NRRL 15 998 | HCD | 1107.06 | 2 | 5.3 × 10⁻⁷ | TGSQVSLLVCEYSSLSVVLCTP (4 Dehyd) | |
| S. roseosporus NRRL 15 998 | HCD | 738.37 | 3 | 6.9 × 10⁻⁵ | TGSQVSLLVCEYSSLSVVLCTP (4 Dehyd) | |
| S. roseosporus NRRL 15 998 | CID | 1056.55 | 2 | 2.0 × 10⁻⁹ | GSQVSLLVCEYSSLSVVLCTP (4 Dehyd) | |
| S. roseosporus NRRL 15 998 | HCD | 1065.53 | 2 | 0.001 | GSQVSLLVCEYSSLSVVLCTP (3 Dehyd) | |
| S. roseosporus NRRL 15 998 | HCD | 710.693 | 3 | 0.001 | GSQVSLLVCEYSSLSVVLCTP (3 Dehyd) | |
| S. roseosporus NRRL 15 998 | CID | 1142.58 | 2 | 3.8 × 10⁻⁶ | ATGSQVSLLVCEYSSLSVVLCTP (4 Dehyd) | |
| S. roseosporus NRRL 15 998 | HCD | 1142.57 | 2 | 0.013 | ATGSQVSLLVCEYSSLSVVLCTP (4 Dehyd) | |
| S. roseosporus NRRL 15 998 | HCD | 1028.02 | 2 | 5.0 × 10⁻⁵ | SQVSLLVCEYSSLSVVLCTP (4 Dehyd) | |
| SRO-3108 | S. roseosporus NRRL 15 998 | CID | 1555.68 | 2 | 1.2 × 10⁻⁶ | TTWACATVTLTVTVCSPTGTLCGSCSMGTRGCC (9 Dehyd) |
| S. roseosporus NRRL 15 998 | HCD | 1564.17 | 2 | 0.02 | TTWACATVTLTVTVCSPTGTLCGSCSMGTRGCC (9 Dehyd) | |
| S. roseosporus NRRL 15 998 | CID | 1582.81 | 2 | 1.0 × 10⁻⁷ | {TTWAC}+54ATVTLTVTVCSPTGTLCGSCSMGTRGCC (9 Dehyd) | |
| S. roseosporus NRRL 15 998 | CID | 1636.71 | 2 | 0.001 | {TTWAC}+162ATVTLTVTVCSPTGTLCGSCSMGTRGCC (9 Dehyd) | |
| S. roseosporus NRRL 15 998 | CID | 1037.11 | 2 | 0.0001 | TTWACATVTLTVTVCSPTGTLCGSCSMGTRGCC (9 Dehyd) | |
| S. roseosporus NRRL 15 998 | HCD | 1037.11 | 3 | 0.0007 | TTWACATVTLTVTVCSPTGTLCGSCSMGTRGCC (9 Dehyd) | |
| S. roseosporus NRRL 15 998 | CID | 1055.59 | 3 | 0.001 | {TTWAC}+54ATVTLTVTVCSPTGTLCGSCSMGTRGCC (9 Dehyd) | |
| S. roseosporus NRRL 15 998 | CID | 1067.92 | 3 | 0.0001 | TVTVCSPTGTLCGSCSMGTRGCC (5 Dehyd) | |
| S. roseosporus NRRL 15 998 | HCD | 1067.42 | 2 | 7.7 × 10⁻⁷ | TVTVCSPTGTLCGSCSMGTRGCC (5 Dehyd) | |
| S. roseosporus NRRL 15 998 | CID | 1123.99 | 2 | 4.6 × 10⁻⁷ | LTVTVCSPTGTLCGSCSMGTRGCC (5 Dehyd) | |
| S. roseosporus NRRL 15 998 | CID | 1166.47 | 2 | 0.0002 | TLTVTVCSPTGTLCGSCSMGTRGCC (6 Dehyd) | |
| S. roseosporus NRRL 15 998 | CID | 1215.54 | 2 | 0.0003 | VTLTVTVCSPTGTLCGSCSMGTRGCC (6 Dehyd) | |
| S. roseosporus NRRL 15 998 | CID | 1256.13 | 2 | 0.038 | TVTLTVTVCSPTGTLCGSCSMGTRGCC (7 Dehyd) | |
| S. roseosporus NRRL 15 998 | CID | 1075.42 | 2 | 0.009 | TVTVCS{PTGTLCGSCSMG}+16TRGCC (4 Dehyd) | |
| S. roseosporus NRRL 15 998 | CID | 1174.49 | 2 | 5.6 × 10⁻⁸ | TLTVTVCSPTGTLCGSCSMGTRGCC (5 Dehyd) | |
| SapB | S. coelicolor A3(2) | CID | 1013.99 | 1 | 0.02 | TGSRASLLLCGDSSLSITTCN (4 Dehyd) |
| SapB | S. lividans TK24 | HCD | 934.96 | 2 | 0.016 | SRASLLLCGDSSLSITTCN (4 Dehyd) |
| S. lividans TK24 | HCD | 1013.99 | 2 | 4.0 × 10⁻⁵ | TGSRASLLLCGDSSLSITTCN (4 Dehyd) | |
| SAL-2242 | S. albus J1074 | HCD | 1062.53 | 2 | 5.7 × 10⁻⁵ | GSQISLLICEYSSLSVTLCTP (4 Dehyd) |
| S. albus J1074 | HCD | 1113.06 | 2 | 0.015 | TGSQISLLICEYSSLSVTLCTP (5 Dehyd) | |
| S. albus J1074 | HCD | 1122.06 | 2 | 0.017 | TGSQISLLICEYSSLSVTLCTP (4 Dehyd) |
Number of dehydrations involved in lanthipeptide processing are shown in each case. Abbreviations: m/z, mass-to-charge ratio; z, precursor ion charge; dehydr, dehydration. Corresponding annotated spectra are shown in SI Figure S4.
Characterization of an Unknown Lanthipeptide Chemotype and Genotype from Streptomyces viridochromogenes DSM 40736 by RiPPquest
In addition to known lanthipeptides, RiPPquest yielded a PSM of an unknown lanthipeptide from LC-MS/MS data of an n-butanol extract of S. viridochromogenes DSM 40736, which was previously inspected manually11(Figure 2A). Analysis of the corresponding gene cluster of the identified peptide revealed a lanthionine synthetase SSQG_07268, which lacks zinc ligand residues and thus indicates a class III lanthipeptide (Figure 2B, SI Table S2). We termed the new peptide informatipeptin, as it is the first natural product chemotype to be connected to its genotype in a microbial genome sequence by a genome mining algorithm. From FT-MS/MS analysis and sequence similarity to other class III lanthipeptides from S. chartreusis, S. erythraea, C. acidiphila, S. coelicolor, and S. griseus (SI Figures S5 and S6), we deduced that the Ser21/Ser24/Cys28-motif and the Ser30/Ser33/Cys37-motif are converted to either labionin or lanthionine. This leaves us with four structural candidates of two lanthionines, two labionins, or one lanthionine and one labionin in the peptide (Figure 2C). Based on the closest sequence similarity to avermipeptins from S. avermitilis and their characterized one lanthionine-one labionin modification,26 we predict the same Lan/Lab ratio in informatipeptin. The fact that RiPPquest found all these peptides, including a new lanthipeptide in a single study illustrates the power of automated peptidogenomics for RiPP studies and that natural products can be discovered informatically.
Figure 2.

Characterization of class III lanthipeptide informatipeptin from Streptomyces viridochromogenes DSM 40736 by RiPPquest. (a) PSM of informatipeptin. (b) Gene cluster analysis of informatipeptin. (c) Predicted structures of informatipeptin. Abbreviation: N/A = not annotated.
Molecular network analysis revealed a plethora of compounds clustering with known lanthipeptides (SI Figure S7). The automated peptidogenomics pipeline revealed that many of these compounds are lanthipeptides with stepwise N-terminal leader processing and different dehydration numbers (Table 1). In this case of informatipeptin, up to six different N-terminal derivatives could be observed using mass spectrometry (SI Figure S8), which has been observed for other class III lanthipeptides such as the avermipeptins.26 The putative cleavage site-promiscuous peptidase could be SSQG-07264. To date, only one class III lanthipeptide protease has been characterized,27 which cleaves a similar leader peptide as the predicted informatipeptin leader peptide.
Conclusion
In this study, we introduced RiPPquest, the first genome mining algorithm for RiPP discovery. RiPPquest enables automated prediction of lanthipeptide gene clusters and connection to the corresponding chemotypes in a LC-MS/MS data set via a MS/MS database search tool approach. Cycloquest, a recent MS/MS database search tool for identifying cyclic ribosomal peptides requires well fragmented spectra and is limited to peptides with a small number of modifications.28 In contrast, RiPPquest aims at discovering peptides with poor fragmentation and extensive number of modifications by characterization of the core peptides from genome sequences. Herein, RiPPquest capitalizes on the observation that the genes for RiPP precursor peptides usually appears in the vicinity of its specific biosynthetic enzymes in the genome. By reducing the search space to the RiPP gene clusters, one can perform a database search allowing for higher number of modifications.
In addition to the identification of many known lanthipeptides in various Streptomyces strains (Table 1), RiPPquest discovered a new class III lanthipeptide informatipeptin from Streptomyces viridochromogenes DSM 40736. In contrast to the previous approaches where the compounds were analyzed after isolation,11 RiPPquest enables analysis of MS/MS data collected on bacterial extracts simultaneously. This systematic approach enables discovery of putative differentially proteolyzed forms of lanthipeptides, missed by previous isolation-based approaches. While we focused on lanthipeptides throughout this study, the general pipeline can work for other types of RiPPs, since most RiPP classes have specific conserved biosynthetic gene clusters and go through specific modifications during their maturation.
Several factors may contribute to the gap between the 49 putative lanthipeptide gene clusters discovered at the genotype level and only seven confirmed at the chemotype level. First, not all the candidate gene clusters found informatically are lanthipeptide gene clusters. Similar domains are found in other genes, and therefore, there is an overestimated search space. Perhaps tools such as BAGEL3 that is designed to find RiPPs at the genomic level can assist in improving these discoveries.32 Second, gene expression for some of these clusters may be limited to specific environmental conditions. Third, sample preparation may be a determining factor in success of RiPP discovery. For example, among an n-butanol and a methanol extract data sets both collected on S. viridochromogenes DSM 40736, only the former contains spectra corresponding to informatipeptin. Our molecular network analysis revealed numerous distinct compounds related to known lanthipeptides. RiPPquest assigned these compounds to less abundant variants of the known lanthipeptides with alternative numbers of dehydrations and promiscuous N-terminal leader processing. This emphasizes the ability of computational mass spectrometry in discovering less abundant homologues that other methods fail to capture. Ultimately, the RiPPquest approach can greatly accelerate characterization of lanthipeptides, if further extended, of RiPPs leading to discovery of new peptide (bio)chemistry and bioactivity.
Methods
Cultivation and Extraction of Actinobacteria
We obtained 16 Streptomyces strains described in the Genome Data sets section (Supporting Information). Strains were grown on ISP2 agar plates (4 g yeast extracts, 10 g malt extract, 4 g d-glucose, 18 g agar, and 1000 mL water). Each agar plate was inoculated with each bacterial strain by 4 parallel streaks. The plates were incubated for 10 d at 28 °C. The agar was sliced into small pieces, covered with equal amount of Milli-Q water and n-butanol in a 50 mL centrifuge tube and shaken at 225 rpm for 12 h at 28 °C. The n-butanol layer was subsequently collected using transfer pipet and dried in vacuo.
MS/MS Analysis of Microbial Extracts
Collision-induced dissociation (CID) MS/MS data sets were collected with or without liquid chromatography (LC) separation in-line with mass spectrometry. For LC-MS, capillary columns were prepared by drawing a 360 μm O.D., 100 μm I.D. deactivated, fused silica tubing (Agilent) with a Model P-2000 laser puller (Sutter Instruments) (Heat, 330, 325, 320; Vel, 45; Del, 125) and were packed at 600 psi to a length of about 10 cm with C18 reverse-phase resin suspended in methanol. The column was equilibrated with 95% of solvent A (water, 0.1% AcOH) and loaded with 10 μL (10 ng/μL in 10% CH3CN) of bacterial butanol extract by flowing 95% of solvent A and 5% of solvent B (CH3CN, 0.1% AcOH) at 200 μL/min for 15 min. A gradient was established with a time-varying solvent mixture [(min, % of solvent A): (20,95), (30,60), (75,5)] and directly electrosprayed into the LTQ-FT MS inlet (source voltage, 1.8 kV; capillary temperature, 180 °C). The first scan was a high resolution broadband scan. The subsequent six scans were low resolution data-dependent on the first scan. In each data-dependent scan, the top intensity ions excluded the ones in exclusion list were selected to be fragmented by CID which generated hundreds of fragmentation spectra collected as individual data events. The resulting .RAW files were converted to .mzXML using the program ReAdW (http://tools.proteomecenter.org).
Higher-energy collisional dissociation (HCD) data sets were acquired from samples prepared in 20% acetonitrile before injection. The constant flow capillary RPLC system used for peptide separations was similar to the previous report.30 Briefly, the HPLC system consisted of a custom configuration of Agilent 1200 nanoflow pumps (Agilent Technologies), 2-position Valco valves (Valco Instruments Co., Houston, TX), and a PAL autosampler (Leap Technologies, Carrboro, NC), allowing for fully automated sample analysis across four separate HPLC columns (3-μm Jupiter C18 stationary phase, Phenomenex, Torrence, CA). Mobile phases consisted of 0.1% formic acid in water (A) and 0.1% formic acid acetonitrile (B). Flow rate through the capillary HPLC column was set as 300 nL/min. The HPLC system was equilibrated with 100% mobile phase A, and the following gradient was started 40 min after injection (5 μL sample loop): 0–2 min, 0–8% buffer B; 2–20 min, 8–12% buffer B; 20–75 min, 12–80% buffer B; 75–97 min, 80–95% buffer B. ESI using an etched fused-silica tip31 was employed to interface the RPLC separation to a LTQ Orbitrap Velos mass spectrometer (Thermo Scientific, San Jose, CA). Precursor ion mass spectra (automatic gain control was set to 1 × 10⁶) were collected for 400–2000 m/z range at a resolution of 60 K followed by data-dependent HCD MS/MS (resolution 7.5 K, normalized collision energy 45%, isolation window 2.5 Th, activation time 0.1 ms, AGC 5 × 10⁴) of the ten most abundant ions. A dynamic exclusion time of 30 s was used to discriminate against previously analyzed ions.
Genome Mining of Lanthipeptide Gene Clusters
For each LANC-like domain in the microbial genome, a window of 10 kb centered at this domain is selected to form a database of putative core lanthipeptides for follow up MS/MS database search. Since lanthipetides usually appear in short ORFs, we further restrict our analysis to ORFs < 100 aa in the 6-frame translation of the genome. Because core lanthipeptides always appear at the C-terminus of an ORF, we only consider the peptide sequence of the C-terminal half of an ORF. This reduction the database size in RiPPquest searches is important since lanthipeptides are often poorly fragmented and identification of such poorly fragmented spectra in searches against large databases is problematic.
MS Analysis of Lanthipeptide Modifications
The most essential lanthipeptide modifications are dehydration of serine and threonine, and formation of the lanthionine and methyllanthionine bridges. Furthermore, a thiol elimination mechanism for lanthionine PTMs during mass spectrometry yields Cys and Dha at the position of Ser and Cys, respectively, in the core peptide.11 Figure 1f,g shows all possible modified (mature) peptides for a hypothetical core lanthipeptide Thr-Phe-Cys-Arg-Ser. From a mass spectrometry standpoint, there are eight possible products by accumulation of PTMs, resulting in six possible scenarios for observed mass shifts in mass spectrometry (allowing Ser → Dha, Ser → Cys, Cys → Dha, and Thr → Dhb).
Scoring Peptide Spectrum Matches
All MS/MS database search tools score Peptide-Spectrum Matches (PSMs) with the goal to find out how well the experimental spectrum is explained by the theoretical spectrum formed by the fragment ions of the peptide (Figure 1i). We have chosen to score PSMs using an advanced scoring function used in de novo peptide sequencing PepNovo.16
Converting Scores to p-Values
To convert scores into p-values, RiPPquest uses a recently developed MS-DPR approach for evaluating p-values of PSMs.22
Spectral Networks
Spectral networks are a visualizion of spectra as familial groupings of corresponding peptides. Edges in a spectral network connect nodes corresponding to spectra that represent peptides differing from each other by a mutation or a modification. Such pairs of spectra connected by edges in the spectral network are revealed using the spectral alignment approach.24
Acknowledgments
This work was supported by the U.S. National Institutes of Health 3-P41-GM103484 (PP, NB) GM097509 (PCD, BSM, and NB), and GMS10RR029121 (PCD). A portion of the research was performed using EMSL, a national scientific user facility sponsored by the Department of Energy’s Office of Biological and Environmental Research and located at Pacific Northwest National Laboratory.
Glossary
Abbreviations
- RiPP
ribosomally synthesized and posttranslationally modified peptides
- PSM
peptide-spectrum match
- PRPS
postribosomal peptide synthesis
- MS
mass spectrometry
- Ser
serine
- Cys
cysteine
- aa
amino acid
- MS/MS
tandem mass spectrometry
- N/A
not annotated
- ORF
open reading frame
- LC
liquid chromatography
- ESI
electrospray ionization
- Thr
threonine
- Dha
dehydroalanine
- Dhb
dehydrobutyrine
Supporting Information Available
Additional Methods, genome mining of lanthipeptide gene clusters, annotations of lanthipeptide MS/MS spectra, MS/MS and precursor peptide analysis of informatipeptin, spectral networks of MS/MS data sets for lanthipeptide characterization, informatipeptin gene cluster analysis. This material is available free of charge via the Internet at http://pubs.acs.org.
The authors declare no competing financial interest.
Funding Statement
National Institutes of Health, United States
Supplementary Material
References
- Arnison P. G.; Bibb M. J.; Bierbaum G.; Bowers A. A.; Bugni T. S.; Bulaj G.; Camarero J. A.; Campopiano D. J.; Challis G. L.; Clardy J.; Cotter P. D.; Craik D. J.; Dawson M.; Dittmann E.; Donadio S.; Dorrestein P. C.; Entian K. D.; Fischbach M. A.; Garavelli J. S.; Göransson U.; Gruber C. W.; Haft D. H.; Hemscheidt T. K.; Hertweck C.; Hill C.; Horswill A. R.; Jaspars M.; Kelly W. L.; Klinman J. P.; Kuipers O. P.; Link A. J.; Liu W.; Marahiel M. A.; Mitchell D. A.; Moll G. N.; Moore B. S.; Müller R.; Nair S. K.; Nes I. F.; Norris G. E.; Olivera B. M.; Onaka H.; Patchett M. L.; Piel J.; Reaney M. J.; Rebuffat S.; Ross R. P.; Sahl H. G.; Schmidt E. W.; Selsted M. E.; Severinov K.; Shen B.; Sivonen K.; Smith L.; Stein T.; Süssmuth R. D.; Tagg J. R.; Tang G. L.; Truman A. W.; Vederas J. C.; Walsh C. T.; Walton J. D.; Wenzel S. C.; Willey J. M.; van der Donk W. A. (2012) Ribosomally synthesized and post-translationally modified peptide natural products. Nat. Prod. Rep. 30, 108–160. [DOI] [PMC free article] [PubMed] [Google Scholar]
- Winter J. M.; Behnken S.; Hertweck (2011) Genomics-inspired discovery of natural products. C. Curr. Opin. Chem. Biol. 15, 22–30. [DOI] [PubMed] [Google Scholar]
- Zerikly M.; Challis G. L. (2009) Strategies for the discovery of new natural products by genome mining. ChemBioChem 10, 625–633. [DOI] [PubMed] [Google Scholar]
- Medema M. H.; Blin K.; Cimermancic P.; de Jager V.; Zakrzewski P.; Fischbach M. A.; Weber W.; Takano E.; Breitling R. (2011) antiSMASH: Rapid identification, annotation, and analysis of secondary metabolite biosynthesis gene clusters in bacterial and fungal genome sequences. Nucleic Acids Res. 39, W339–346. [DOI] [PMC free article] [PubMed] [Google Scholar]
- Willey J. M.; van der Donk W. A. (2007) Lantibiotics: Peptides of diverse structure and function. Annu. Rev. Microbiol. 61, 477–501. [DOI] [PubMed] [Google Scholar]
- Meindl K.; Schmiederer T.; Schneider K.; Reicke A.; Butz D.; Keller S.; Gühring H.; Vértesy L.; Wink J.; Hoffmann H.; Brönstrup M.; Sheldrick G. M.; Süssmuth R. D. (2010) Labyrinthopeptins: A new class of carbacyclic lantibiotics. Angew. Chem., Int. Ed. 49, 1151–4. [DOI] [PubMed] [Google Scholar]
- Kodani S.; Hudson M. E.; Durrant M. C.; Buttner M. J.; Nodwell J. R.; Willey J. M. (2004) The SapB morphogen is a lantibiotic-like peptide derived from the product of the developmental gene ramS in Streptomyces coelicolor. Proc. Natl. Acad. Sci. U.S.A. 101, 11448–11453. [DOI] [PMC free article] [PubMed] [Google Scholar]
- McClerren A. L.; Cooper L. E.; Quan C.; Thomas P. M.; Kelleher N. L.; van der Donk W. A. (2006) Discovery and in vitro biosynthesis of haloduracin, a two-component lantibiotic. Proc. Natl. Acad. Sci. U.S.A. 103, 17243–8. [DOI] [PMC free article] [PubMed] [Google Scholar]
- Begley M.; Cotter P. D.; Hill C.; Ross R. P. (2009) Identification of a novel two-peptide lantibiotic, lichenicidin, following rational genome mining for LanM proteins. Appl. Environ. Microbiol. 75, 5451–60. [DOI] [PMC free article] [PubMed] [Google Scholar]
- Velásquez J. E.; van der Donk W. A. (2011) Genome mining for ribosomally synthesized natural products. Curr. Opin. Chem. Biol. 15, 11–21. [DOI] [PMC free article] [PubMed] [Google Scholar]
- Kersten R. D.; Yang Y. L.; Cimermancic P.; Nam S. J.; Fenical W.; Fischbach M. A.; Moore B. S.; Dorrestein P. C. (2011) A mass spectrometry-guided genome mining approach for natural product peptidogenomics. Nat. Chem. Biol. 7, 794–802. [DOI] [PMC free article] [PubMed] [Google Scholar]
- Eng J. K.; McCormack A. L.; Yates J. R. (1994) An approach to correlate tandem mass spectral data of peptides with amino acid sequences in a protein database. J. Am. Soc. Mass Spectrom. 5, 976–989. [DOI] [PubMed] [Google Scholar]
- Perkins D. N.; Pappin D. J.; Creasy D. M.; Cottrell J. S. (1999) Probability-based protein identification by searching sequence databases using mass spectrometry data. Electrophoresis 20, 3551–67. [DOI] [PubMed] [Google Scholar]
- Duncan M. W.; Aebersold R.; Caprioli R. M. (2010) The pros and cons of peptide-centric proteomics. Nat. Biotechnol. 28, 659–664. [DOI] [PubMed] [Google Scholar]
- Warren A. S.; Archuleta J.; Feng W. C.; Setubal J. C. (2010) Missing genes in the annotation of prokaryotic genomes. BMC Bioinformatics 11, 131. [DOI] [PMC free article] [PubMed] [Google Scholar]
- Frank A. M.; Pevzner P. A. (2005) PepNovo: De novo peptide sequencing via probabilistic network modeling. Anal. Chem. 77, 964–973. [DOI] [PubMed] [Google Scholar]
- Frank A. M.; Pesavento J. J.; Mizzen C. A.; Kelleher N. L.; Pevzner P. A. (2008) Interpreting top-down mass spectra using spectral alignment. Genome Res. 80, 2499–2505. [DOI] [PubMed] [Google Scholar]
- Pevzner P. A.; Dancik V.; Tang C. L. (2000) Mutation-tolerant protein identification by mass spectrometry. J. Comput. Biol. 7, 777–787. [DOI] [PubMed] [Google Scholar]
- Pevzner P. A.; Mulyukov Z.; Dancik V.; Tang C. (2001) Efficiency of database search for identification of mutated and modified proteins via mass spectrometry. Genome Res. 11, 290–299. [DOI] [PMC free article] [PubMed] [Google Scholar]
- Tsur D.; Tanner S.; Zandi E.; Bafna V.; Pevzner P. A. (2005) Identification of post-translational modifications by blind search of mass spectra. Nat. Biotechnol. 23, 1562–7. [DOI] [PubMed] [Google Scholar]
- Kim S.; Gupta N.; Pevzner P. A. (2008) Spectral probabilities and generating functions of tandem mass spectra: A strike against decoy databases. J. Proteome Res. 7, 3354–3363. [DOI] [PMC free article] [PubMed] [Google Scholar]
- Mohimani H.; Kim S.; Pevzner P. A. (2013) A new approach to evaluating statistical significance of spectral identifications. J. Proteome Res. 12, 1560–1568. [DOI] [PMC free article] [PubMed] [Google Scholar]
- Bandeira N.; Tsur D.; Frank A.; Pevzner P. A. (2007) Protein identification by spectral networks analysis. Proc. Natl. Acad. Sci. U.S.A. 104, 6140–6145. [DOI] [PMC free article] [PubMed] [Google Scholar]
- Watrous J.; Roach P.; Alexandrov T.; Heath B. S.; Yang J. Y.; Kersten R. D.; van der Voort M.; Pogliano K.; Gross H.; Raaijmakers J. M.; Moore B. S.; Laskin J.; Bandeira N.; Dorrestein P. C. (2012) Mass spectral molecular networking of living microbial colonies. Proc. Natl. Acad. Sci. U.S.A. 109, 1743. [DOI] [PMC free article] [PubMed] [Google Scholar]
- Ueda K.; Oinuma K.; Ikeda G.; Hosono K.; Ohnishi Y.; Horinouchi S.; Beppu T. (2002) AmfS, an extracellular peptidic morphogen in Streptomyces griseus. J. Bacteriol. 184, 1488–1452. [DOI] [PMC free article] [PubMed] [Google Scholar]
- Völler G. H.; Krawczyk J. M.; Pesic A.; Krawczyk B.; Nachtigall J.; Süssmuth R. D. (2012) Characterization of new Class III lantibiotics—Erythreapeptin, avermipeptin, and griseopeptin from Saccharopolyspora erythraea, Streptomyces avermitilis, and Streptomyces griseus demonstrates stepwise n-terminal leader processing. ChemBioChem 13, 1174–1183. [DOI] [PubMed] [Google Scholar]
- Völler G. H.; Krawczyk B.; Ensle P.; Süssmuth R. D. (2013) Involvement and unusual substrate specifity of a prolyl oligopeptidase in class III lanthipeptide maturation. J. Am. Chem. Soc. 135, 7426–29. [DOI] [PubMed] [Google Scholar]
- Mohimani H.; Liu W. T.; Mylne J. S.; Poth A. G.; Colgrave M. L.; Tran D.; Selsted M. E.; Dorrestein P. C.; Pevzner P. A. (2011) Cycloquest: Identification of cyclopeptides via database search of their mass spectra against genome databases. J. Proteome Res. 10, 4505–12. [DOI] [PMC free article] [PubMed] [Google Scholar]
- Nguyen D. D.; Wu C.-H.; Moree W. J.; Lamsa A.; Medema M. H.; Zhao X.; Gavilan R. G.; Aparicio M.; Atencio L.; Jackson C.; Ballesteros J.; Sanchez J.; Watrous J. D.; Phelan V. V.; van de Wiel C.; Kersten R. D.; Mehnaz S.; De Mot R.; Shank E. A.; Charusanti P.; Nagarajan H.; Duggan B. M.; Moore B. S.; Bandeira N.; Palsson B.Ø.; Pogliano K.; Gutiérrez M.; Dorrestein P. C. (2013) MS/MS networking guided analysis of molecule and gene cluster families. Proc. Natl. Acad. Sci. U.S.A. 110, E2611–20. [DOI] [PMC free article] [PubMed] [Google Scholar]
- Livesay E.; Tang K.; Taylor B.; Buschbach M.; Hopkins D.; LaMarche B.; Zhao R.; Shen Y.; Orton D.; Moore R.; Kelly R.; Udseth H.; Smith R. (2008) Fully automated four-column capillary LC-MS system for maximizing throughput in proteomic analyses. Anal. Chem. 80, 294–302. [DOI] [PMC free article] [PubMed] [Google Scholar]
- Kelly R.; Page J.; Luo Q.; Moore R.; Orton D.; Tang K.; Smith R. (2006) Chemically etched open tubular and monolithic emitters for nanoelectrospray ionization mass spectrometry. Anal. Chem. 78, 7796–7801. [DOI] [PMC free article] [PubMed] [Google Scholar]
- Heel A. J.; De Jong A.; Montalbán-López M.; Kok J.; Kuipers O. P. (2013) BAGEL3: Automated identification of genes encoding bacteriocins and (non)bactericidal posttranslationally modified peptides. Nucleic Acids Res. 41, W448–53. [DOI] [PMC free article] [PubMed] [Google Scholar]
Associated Data
This section collects any data citations, data availability statements, or supplementary materials included in this article.