Abstract
We measured the spatial pattern of particle number (PN) concentrations downwind from the Los Angeles International Airport (LAX) with an instrumented vehicle that enabled us to cover larger areas than allowed by traditional stationary measurements. LAX emissions adversely impacted air quality much farther than reported in previous airport studies. We measured at least a 2-fold increase in PN concentrations over unimpacted baseline PN concentrations during most hours of the day in an area of about 60 km2 that extended to 16 km (10 miles) downwind and a 4- to 5-fold increase to 8–10 km (5–6 miles) downwind. Locations of maximum PN concentrations were aligned to eastern, downwind jet trajectories during prevailing westerly winds and to 8 km downwind concentrations exceeded 75 000 particles/cm3, more than the average freeway PN concentration in Los Angeles. During infrequent northerly winds, the impact area remained large but shifted to south of the airport. The freeway length that would cause an impact equivalent to that measured in this study (i.e., PN concentration increases weighted by the area impacted) was estimated to be 280–790 km. The total freeway length in Los Angeles is 1500 km. These results suggest that airport emissions are a major source of PN in Los Angeles that are of the same general magnitude as the entire urban freeway network. They also indicate that the air quality impact areas of major airports may have been seriously underestimated.
Introduction
Previous studies that directly measured the impact of aviation activity on air quality have mostly conducted measurements in close proximity of airports. Few studies have reported significant air quality impacts extending beyond a kilometer.1−4 Carslaw et al. 20061 analyzed differences in pollutant concentrations by wind speed and direction along with differences in aircraft and ground traffic activity at Heathrow Airport in London. They found airport contributions of up to 15% of total oxides of nitrogen (NOx) at a site 1.5 km downwind of the nearest runway. At Hong Kong International Airport, Yu et al. 20042 used nonparametric regression analysis on pollutant concentrations by wind speed and direction. They calculated that aircraft nearly doubled sulfur dioxide concentrations 3 km away and also increased concentrations of carbon monoxide and respirable suspended particles under similar wind speeds and directions. Fanning et al. 20073 measured particle numbers concentrations in the 10–100 nm range and found significant increases above background at 1.9, 2.7, and 3.3 km downwind of the Los Angeles International Airport (LAX) blast fence. Although measurements were stationary and not concurrent, they also noted that takeoffs produced high concentrations and downwind gradients within 600 m of the blast fence. Dodson et al. 20094 found that aircraft activity at a regional airport in Warwick, RI contributed 24–28% of the total black carbon (BC) measured at five sites 0.16–3.7 km from the airport.
Several other airport and aviation emissions studies focused on quantifying the air quality impacts from jet takeoffs5,6 and measured air pollutant concentrations very close to runways. Of particular relevance to this study, Hsu et al. 20137 linked flight activity at LAX with 1 min average PN concentrations. Their models suggested that aircraft produced a median PN concentration of nearly 150 000 particles/cm3 at the end of the departure runway. PN concentrations decreased rapidly with distance to 19 000 particles/cm3 at a location 250 m downwind and to 17 000 particles/cm3 at a location 500 m further downwind. The rapid drop-off in concentration, however, may have reflected an increasing offset from the centerline of impacts with greater downwind measurement distance. Similar magnitude PN concentrations and correlations with departures were reported by Westerdahl et al. 20088 and Zhu et al. 20119 at sites located within 100–200 m of the Hsu et al. 20137 measurements.
Our study was motivated by mobile monitoring platform (MMP) based observations of large but gradual increases in PN concentrations as we approached locations under LAX jet landing trajectories on multiple transects up to 10 km downwind of LAX. We hypothesized that emissions from LAX activities were increasing PN concentrations over much larger areas and longer downwind distances than previously observed in studies that focused on near freeway and jet takeoff impacts to air quality. An extensive monitoring campaign confirmed that LAX-related emissions increased PN concentrations downwind at least 2-fold to 16 km. This large, previously undiscovered spatial extent of the air quality impacts downwind of major airports may mean a significant fraction of urban dwellers living near airports likely receive most of their outdoor PN exposure from airports rather than roadway traffic.
Materials and Methods
Monitoring Area
LAX is the sixth busiest airport in the world and third busiest in the United States. About 95% of flights take off and land into the prevailing westerly/west-southwesterly (W/WSW) onshore winds10 (i.e., 263 degrees, the direction of runway alignment2) using two sets of parallel runways separated by about 1.5 km. In the busiest hours, 40–60 jets per hour arrive during hours 0700–1900 and depart during hours 0800–2100. Reduced activity is typical for the early morning and late evening hours. 20–40 jets per hour arrive during hours 0600 and 1000–0100 and depart during hours 0700 and 2200–2300. During other hours typically fewer than five jets per hour arrive or depart.10
The airport complex is about 4.5 km east to west (E-W) and about 2.5 km north to south (N–S) and is surrounded by major roadways and freeways, as highlighted in Figure 1 (Figure S.1 in Supporting Information (SI) shows a map of this area with street name labels). The Federal Aviation Administration noise contours of the modeled annual 65 dB A-weighted equivalent (LAeq) noise threshold are shown11 extending eastward along the predominant downwind direction and reflect the jet trajectories used for landing. They also extend west of the airport over the Pacific Ocean (not shown).
Figure 1.
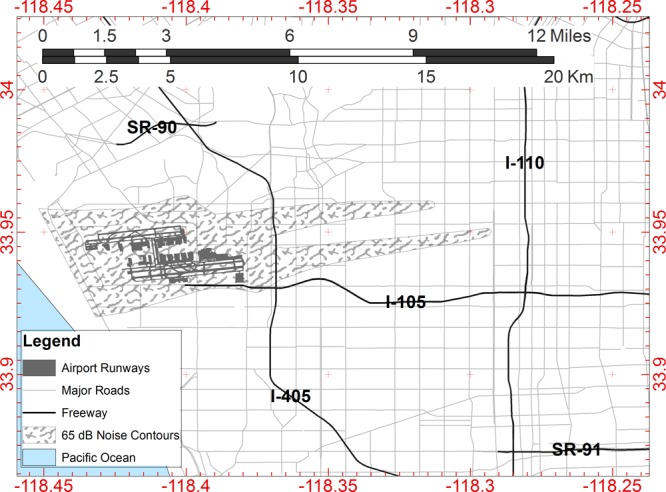
Los Angeles International Airport and 65 dB noise contours indicating eastern jet trajectories.
Mobile Monitoring
Monitoring consisted of transects 4–16 km in length, nearly perpendicular (i.e., N–S) to the direction of the prevailing winds, at varying downwind distances. Different monitoring routes were required to fully capture the changes in impact locations due to shifts in wind direction. A general downwind direction was chosen based on meteorological predictions but transect lengths and locations were determined during the monitoring run based on observations of the rate of change of PN concentrations. For each transect, monitoring was extended several hundred meters beyond the location where baseline PN concentrations appeared stable.
Measurements were conducted over 29 days with the University of Southern California (USC) MMP, a gasoline-powered hybrid vehicle. A second MMP, the University of Washington (UW) MMP, a gasoline-powered minivan, joined the monitoring on 3 days (June 22, 27 and July 1, 2013). Table 1 gives monitoring dates and times.
Table 1. Sampling Days, Time Periods and Meteorological Conditions during Sampling.
| datea | time | sampling distance from LAX (km) | WDb | WS (m/s) | urban background PNc | ratio of impacted to unimpacted baseline PN, 10 km downwind |
|---|---|---|---|---|---|---|
| 4/6/2011 | 14:30–16:45 | 8–12 | WSW, W | 5.0 ± 1.8 | 15 000 | 2.0 |
| 4/10/2011 | 15:00–17:30 | 8–12 | W | 6.9 ± 1.2 | 10 000 | 4.5 |
| 5/24/2011 | 09:00–11:00 | 8–12 | Calm, W | 1.0 ± 2.5 | 10 000 | 3.0 |
| 5/27/2011 | 12:15–14:45 | 8–12 | WSW, W | 6.3 ± 1.3 | 10 000 | 4.7 |
| 1/26/2012 | 17:28–20:22 | 8–12 | WSW, W | 2.9 ± 2.1 | 20 000 | 6.0 |
| 9/29/2012 | 13:30–17:30 | 0–8 | W | 6.1 ± 1.1 | 10 000 | 3.7 |
| 9/30/2012 | 15:45–18:30 | 0–8 | W | 6.1 ± 0.4 | 5000 | 5.2 |
| 6/11/2013 | 14:14–15:14 | 2.5–8.5 | WSW, W | 6.7 ± 0.0 | 15 000 | 5.0 |
| 6/12/2013 | 13:30–16:30 | 2.5–10.5 | W | 4.0 ± 0.4 | 15 000 | 4.0 |
| 6/22/2013 | 11:47–18:50d | 0–8 | WSW, W | 5.7 ± 0.4 | 10 000 | 4.4 |
| 6/27/2013 | 11:49–18:00d | 0–8 | WSW, W | 5.3 ± 0.7 | 10 000 | 4.0 |
| 7/01/2013 | 10:30–18:30d | 0–8 | W, ESE | 3.8 ± 1.0 | 15 000 | 3.8e |
| 8/6,7/2013 | 23:56–02:45 | 0–8 | WSW, W, S | 3.3 ± 0.7 | 10 000 | 3.3 |
| 8/13/2013 | 06:30–15:00 | 0–8 | Calm, WSW, W, NNE, NE, ENE, E, ESEf | 3.0 ± 2.0 | 10 000 | 4.0 |
| 8/15/2013 | 08:30–15:30 | 0–16 | Calm, WSW,W | 2.5 ± 2.1 | 20 000 | 3.8 |
| 8/16/2013 | 09:45–20:50 | 0–16 | SW, WSW,W, WNW | 4.4 ± 1.3 | 10 000 | 3.0 |
| 8/23,24/2013 | 12:00–01:30 | 0–16 | SSW, WSW,W | 4.4 ± 2.2 | 20 000 | 4.0, 5.0 |
| 8/24,25/2013g | 17:30–01:00 | 0–16 | Calm, SSW, SW, WSW,W, ESE | 3.1 ± 2.1 | 15 000 | 6.0 |
| 11/1/2013 | 16:00–19:50 | 0–12 | SSE, W, WSW | 3.7 ± 0.7 | 10 000 | 3.8e |
| 12/3/2013 | 19:45–00:20 | 0–12 | WSW, W, WNW | 8.8 ± 1.4 | 5000 | 6.0 |
| 12/5/2013 | 13:00–18:30 | 0–12 | WSW, W, WNW | 5.5 ± 0.6 | 10 000 | 2.8 |
| 12/9/2013 | 16:00–00:00 | 0–10 | N, NNE | 2.7 ± 0.6 | 20 000 | n/a |
| 12/10/2013 | 15:30–21:30 | 0–10 | WNW,N, NW | 3.1 ± 1.1 | 20 000 | 5.0 |
| 12/14/2013 | 17:00–20:30 | 0–10 | W, Calm | 2.1 ± 0.5 | 20 000 | data lost |
| 12/15,16/2013 | 22:00–02:00 | 0–10 | N, NE, ESE | 2.9 ± 1.0 | 17 500 | n/a |
| 12/16/2013 | 10:00–16:00 | 0–12 | N, W | 2.8 ± 1.6 | 10 000 | 4.5 |
| 12/18/2013 | 17:30–20:30 | 0–10 | WSW, SSW, SSE | 3.3 ± 1.3 | 10 000 | 6.0 |
| 12/20/2013 | 16:30–20:00 | 0–10 | WSW, Calm, E | 2.6 ± 1.3 | 15 000 | 4.0 |
| 12/23/2013 | 15:15–19:00 | 0–12 | W, Calm, E | 2.8 ± 1.3 | 10 000 | 11.0 |
The runs for which maps are presented are formatted in bold.
Predominant wind direction is formatted as bold.
Urban background value concentrations are reported to nearest 2500 particles/cm3 and are the average baseline values in the unimpacted areas away from local traffic sources
Concurrent MMP sampling times: June 22:1320−1720, June 27:1325−1510, July 1:1240−1640.
Monitoring route did not cover the full N–S extent of the impact on Western Av (10 km downwind) on these days, values have been reported for Crenshaw Blvd. (8 km downwind).
Easterly flow was recorded in morning hours (until 1000) and westerly later morning to afternoon
08/25/2013 was not counted as an additional monitoring day because only 1 h of monitoring (0000–0100) was conducted on this date
Most measurements were conducted during times of onshore westerly winds, typically strongest during 1100–1600, but we also conducted measurements during early morning and late night hours when air traffic was low and onshore winds were reduced (August 13, 16, 23, 24 and 25, December 03, 09, 15 and 16, 2013). Monitoring focused on the area east of LAX (i.e., the predominant downwind direction) but included several runs along the boundary of the airport in the upwind direction and south of the airport complex during occasions of northerly winds in winter months.
Instrumentation
Concentration measurements included PN, BC, NO, NO2, NOx, and particle surface UV-photoionization potential (measured using Ecochem Photoelectric Aerosol Sensor [PAS] that responds to elemental carbon and particle-bound polycyclic aromatic hydrocarbons [PB–PAH]). Instrument details are provided in SI (Table S.1 and S.2). Instruments were powered by two deep-cycle marine batteries via DC-to-AC inverter. Our power arrangement allowed for 5 h of run time if all instruments were running. For sampling runs that were anticipated to exceed 5 h, several instruments were shut down to extend battery life and the Condensation Particle Counter (CPC) was run on the vehicle’s 12 V cell phone power outlet. If other instruments were turned on later, the required warm-up time was 25 min.
Instrument clock times were regularly synchronized to be within 1 s of the global positioning system device time, which also recorded speed and location. Measurements from instruments with a delayed response time were advanced to match the instantaneous instruments and the GPS time and location recorded at 1 s intervals. For pollutant measurements recorded at 10 s intervals, all locations within the recording interval were assigned the pollutant value reported for that interval.
Meteorological Data
Minute and hourly wind speed and wind direction data were obtained from the Automated Surface Observing Systems monitor at LAX airport (latitude 33.943 and longitude −118.407). Due to the 16 km distance between eastern edge of the study area and the meteorological station located at LAX, we could not assume that wind speed and direction were identical to those measured at LAX, but wind direction in this region of Los Angeles tends to be similar over large areas during daytime.12
The average wind direction at LAX is WSW (252°).12 Daytime southwesterly sea breezes typically occur 16 h per day in the summer (0900–0100 for June–August), decreasing to 6 h in the winter (1200–1800 in December). Only during the winter months (November–February, 0000–0900) are light easterly off-shore winds common.12 Wind speed and direction during the monitoring periods are summarized in Table 1. Wind roses based on 1 min data are shown in Figure S.2 and S.3 of the SI.
Data Processing
MMP measurements included a localized traffic emissions signal representing microscale and middle scale variations (10–100 m and 100–500 m, respectively) and an underlying “baseline” pollutant concentration that varied gradually over the neighborhood scale (500 m–4 km).13 Watson et al. 199713 derived these categories by considering the spatial scales of impact of various types of air pollution sources. We adopted a smoothing methodology to estimate baseline PN concentrations that excluded the microscale and middle scale impacts due to local sources, usually specific vehicles.
Baseline PN concentrations were derived from our mobile measurements by taking a rolling 30-s fifth percentile value of the 1-s concentration time series, and assigning that value to the measured location. This removed the microscale and middle scale impacts from traffic sources such as specific vehicle plumes. Baseline concentrations for a run were relatively spatially uniform outside of the LAX impact areas, with coefficients of variation (CV) of less than 5%. In comparison, the raw PN concentrations on roadways outside the LAX impact areas had CVs on the order of 40%. On rare occasions, the MMP was behind a high emitter for longer than 30 s. Such events, only if verifiable by video and field notes, were censored. However, less than 0.5% of data were censored in this manner, generated from about a dozen instances of prolonged influence from high emitting vehicles. An illustration of both raw and smoothed concentration time series is presented in the SI (Figures S.4–S.7). The figures in this text are based on smoothed data.
Results and Discussion
Spatial Pattern and Extent of Elevated PN Concentrations
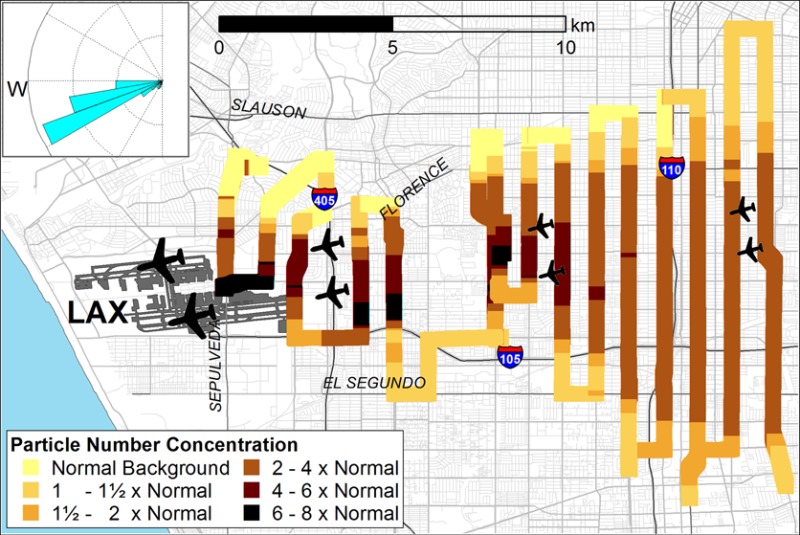
Downwind of LAX we observed gradual but large increases in baseline PN concentrations occurring over transect distances of multiple kilometers. PN concentrations were elevated 4-fold or more above nearby unimpacted baseline concentrations up to 10 km in the downwind direction from LAX. Figure 2 shows an example of the spatial pattern of the elevated PN concentrations.
Figure 2.
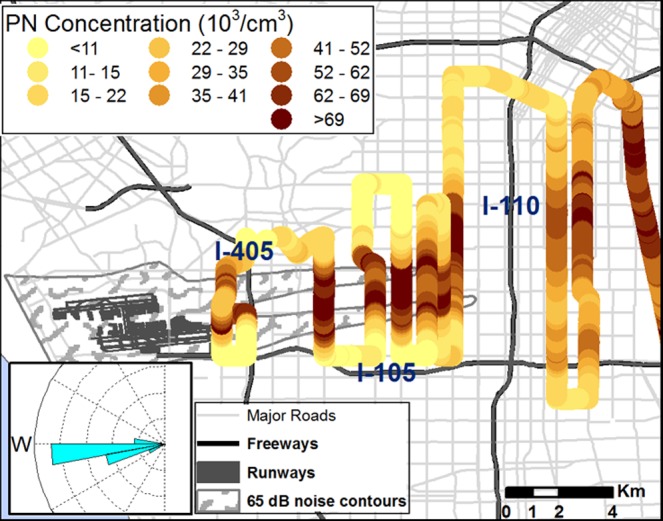
Spatial pattern of PN concentration (colored by deciles) for the afternoon and evening hours of August 23, 2013.
The size of the impacted areas with high PN concentration increases was remarkable. At 16 km downwind, a 2-fold increase in PN concentration over baseline concentrations was measured across 6.5 km. Assuming a trapezoidal shaped plume with parallel edges of length 1.5 and 6.5 km, PN concentrations were at least doubled over an area of 60 km2. Eight km downwind, a 5-fold increase in PN concentrations over baseline concentrations extended across 3 km and covered a total area of 24 km2. (Concentrations in this large area exceeded 71 000 particles/cm3, the average concentration on Los Angeles freeways.14) Within 3 km of the airport boundary, concentrations were elevated nearly 10-fold, exceeding 100 000 particles/cm3, with concentrations of 150 000 particles/cm3 occurring over a several km2 area.
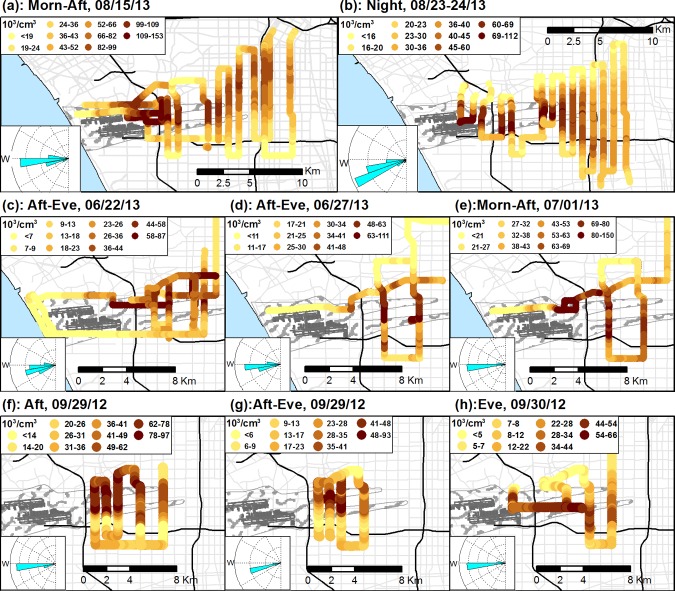
This pattern of elevated PN concentrations over large areas east of LAX was consistently observed during periods when there were both westerly winds and high air traffic volumes, typically all daylight hours and well into the night. Figure 3 shows the consistency of the patterns over eight monitoring runs at various times of day, displayed in each row by similarity of spatial scale.
Figure 3.
Spatial pattern of impact during different monitoring events. Wind direction during monitoring is shown in insets on bottom left. PN concentrations are classified and colored by deciles.
In directions other than the downwind direction, no large areas of elevated PN concentrations were observed. Figures 3(c)–(e) include concentrations measured upwind of the LAX boundary (these are indicated by faint yellow lines within the noise contour); the concentrations recorded were typical of the coastal baseline concentrations, less than 10 000 particles per cm3 (also see Figure S.8 in SI). Of possible other PN sources, a large refinery is located south of the airport but we did not observe elevated PN or other pollutant concentrations directly downwind of this source. In general, industrial point sources of pollution in the Los Angeles Air Basin are very tightly regulated by the South Coast Air Quality Management District.
We did not observe distinct day versus night differences, as might be expected based on the large change in meteorologically driven dilution between day and night for ground level sources. It appeared that the distant impacts we observed downwind of LAX required sufficient wind speeds for the jet climbing and landing emissions to reach the ground, as observed in Yu et al., 20042 at LAX and Hong Kong International Airports and Carslaw et al. 20061 at Heathrow Airport. At LAX, this probably corresponded to the development of the on-shore sea breezes that typically started 4–6 h after sunrise and lasted until 3–6 h after sunset.12
We also did not see the impacts of individual jets at the distances monitored, but the merging of individual jet impacts is not unexpected at distances of multiple km. Considering the frequency of landings and takeoffs (>90 per hour from 0900–210010), at an average wind speed of 4 m/s, for example, an incoming parcel of air will travel only about 160 m before another jet landing or takeoff occurs. Under normal daytime air turbulence and the enhanced turbulence produced by jets,15,16 significant mixing is expected over a 5–10 km distance (20–40 min). The generally smooth increases and decreases observed across the length of transects at such distances are additional evidence that mixing of plumes occurs. Examples of these smooth concentration increases for individual transects are shown in Figures S.6 and S.7 in the SI.
The consistent and distinctive spatial pattern of elevated concentrations was aligned to prevailing westerly winds and landing jet trajectories, and roughly followed the shape of the contours of noise from landing jets, indicating that landing jets probably are an important contributor to the large downwind spatial extent of elevated PN concentrations. As defined by the International Civil Aviation Organization, typical engine thrust during landing is 30%, as compared to 100% for takeoff and 85% for the climbing phase.6 Stettler et al. 20116 calculated 18% of total NOx emissions from landings, with 12% from taxiing and holding, 18% from takeoff, and 52% from the climb and climb out phases, respectively. When the extra upwind distance of the climb and climb out phases are taken into account, the landing approach emissions likely produce a significant fraction of the increased PN concentrations observed downwind.
Influence of Wind Direction on Location of Impact
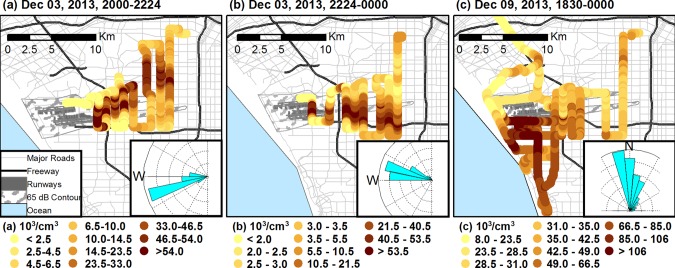
The downwind location of the impact changed with shifts in the prevailing wind direction, although significant shifts in wind direction during the daytime are not typical of this area of Los Angeles.12 Figure 4(a) and (b) illustrate one such change in impacted locations due to a shift in wind direction on a gusty day with frontal weather that also resulted in cleaner upwind baseline PN concentrations of less than 5000 particles/cm3. The impacted locations were aligned along the NE direction during 2000–2220 h when winds were from W to WSW (250–280°). The impact then moved southwards between 2220–0000 h as winds turned more W to WNW (280–330°). During this shift, the impact centerline moved by 5.5 km on transects 8–10 km east of LAX.
Figure 4.
Change in location of impact due to shift in wind direction. Wind direction during monitoring is shown in insets on bottom left. PN concentrations are classified and colored by deciles.
Monitoring was also conducted during N to NE prevailing winds that tend to occur late at night in November and December (2100–2300).12 This N to NE wind direction resulted in impacts that were centered south of the airport (Figure 4(c)). The PN concentrations in this southerly impact were roughly twice as high as on other days, in part because the baseline PN concentrations reflected urban air from northerly winds instead of marine air from westerly winds.
Diurnal wind patterns change little by season in Los Angeles basin.12 Onshore westerly winds are common during midday hours, even in winter. As a result, areas of elevated PN concentrations downwind and east of LAX likely occur in all seasons. Monitoring in different seasons demonstrated the consistent year round presence of this impact. Examples of similarly extensive impacts in non-summer months are shown in the SI (Figures S.8 and S.9).
Other Pollutants
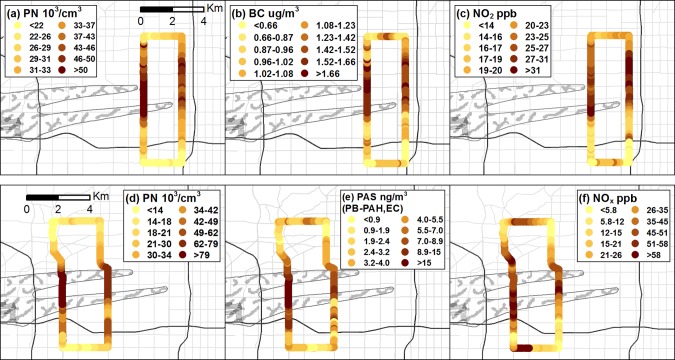
Over large areas downwind of LAX, concentrations of pollutants other than PN were also elevated. Figure 5(a)–(c) show nearly indistinguishable spatial patterns for PN, BC, and NO2 concentration measured simultaneously at distances of 9.5–12 km from LAX. This suggests a common source for these pollutants, although the BC concentration increases were not large when compared to PN and NOx, about 0.5–1 μg/m3 at 8–10 km downwind. While jet aircraft are not known to produce large amounts of BC, two studies found elevated BC from plane takeoffs at LAX. Zhu et al. 20119 measured an increase of about 1 μg/m3 of BC due to plane activity 140 m downwind of the runway. Westerdahl et al. 20088 measured increases in BC concentration of several μg/m3 during takeoff events near the eastern LAX boundary, but also observed elevated BC concentrations at all times. At a smaller airport, Dodson et al. 20094 found median contributions of about 0.1 μg/m3, about one-quarter of total BC measured at five sites ranging in downwind distance from 0.3−3.7 km, and also observed departures producing about twice the impact as arrivals. Therefore, it appears some jets at LAX are capable of producing measurable increases in BC, particularly at takeoffs.
Figure 5.
Spatial pattern of simultaneously measured pollutants during 1400–1530 on June 27, 2013. Concentrations are classified and colored by deciles. Panels (a)–(c) show data measured by the UW MMP and (d)–(f) show data measured by the USC MMP.
Spatial patterns of simultaneously measured PN and PAS response (PB–PAH and EC) were also similar on transects 4.5–7.5 km from LAX (Figure 5(d)–(e)). The NOX elevation pattern was less regular (Figure 5(f)). This was likely due to smaller LAX related contributions compared to baseline concentrations, thus reducing the signal-to-noise ratio.
Overall, the top quartile concentrations (highly impacted) of all pollutants were about three times higher than the lowest quartile within 7.5 km from LAX and two times higher at 12 km distance. In addition, concurrent sampling with the two mobile platforms demonstrated high temporal (SI Figure S.10) and spatial consistency (SI Figure S.11) for PN measurements.
Comparison of LAX and Freeway PN Impacts
PN concentration increases from ground level line sources such as freeways, under conditions of daytime crosswind dilution, decrease exponentially with increasing downwind distance and return to baseline concentrations within 200–300 m.17 The two N–S freeways (I-405 and I-110 that run perpendicular to the prevailing winds) did not contribute appreciably to elevated PN concentrations in areas where we observed large impacts from LAX on PN concentrations. This is illustrated in Figure 6, which contains two enlargements to show the increase in PN number concentrations over approximately 250 m distance downwind of I-405, a distance and an increase in PN concentration that is not discernible at the scale of Figures 2 and 3. The panel in Figure 6(c) at 1:10 000 scale shows the PN concentration increase of about 24 000/cm3. The maximum PN concentration was not immediately downwind of the freeway because at this location there is an elevated overpass and some distance is needed for emissions to reach the ground.
Figure 6.
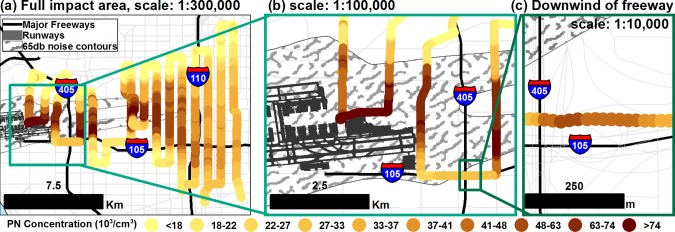
Comparison of the spatial scale of freeway impacts compared to airport impacts for monitoring during nighttime on August 23–24, 2013.
For the days we captured the fullest downwind extent of the impact under typical daytime wind conditions (August 15, 23, and 24), we calculated an integrated PN impact above baseline PN concentrations of 2.3, 1.6, and 1.1 × 10⁶ (particles/cm3) × km2, respectively. See Table S.3(a)–(c) of SI for calculations. Impacted areas were calculated using ArcGIS spatial analysis tools and were conservatively defined as areas where increased PN concentration were at least double the baseline concentrations measured north and south of the impact zone. The resulting impact areas were 30–65 km2. For comparison, a less conservative criterion for defining the impact area such as a 50% or 33% increase over baseline PN concentrations increased the impacted area by 40% and 80%, respectively.
To calculate PN impacts downwind of freeways, we combined the exponential regression fit of near-freeway measurements made downwind of I-405 by Zhu et al. 2002a18 with updated average daytime on-freeway PN concentrations taken from Li et al. 201314 (71 000 particles/cm3). PN concentrations were at least double the baseline PN concentrations of 15 000–20 000 particles/cm3 for 90–130 m downwind.3 This resulted in a concentration-weighted impact area of 2930–3930 (particles/cm3) × km2 per km of freeway length.
Based on these concentration-weighted impact areas, 280–790 km of freeway are needed to produce the equivalent PN-concentration-weighted impact area of LAX. (The less conservative criteria resulted in ranges of freeway length of 340–1000 km and 430–1100 km for thresholds of 50% and 33%, respectively.) There are only about 1500 km of freeways and highways in Los Angeles County.19 Therefore, LAX should be considered one of the most important sources of PN in Los Angeles. For comparison, within the 60 km2 area of elevated PN concentrations downwind and east of LAX, the 15–25 km of freeways contributed less than 5% of the PN concentration increase.
Recommendations for Other Studies
LAX is in a region of Los Angeles with highly consistent wind direction. This provided the several hours necessary for a single mobile platform to monitor a sufficient number of transects to cover the large area impacted by LAX emissions. At airport locations where the prevailing wind direction frequently shifts during the day, multiple platforms would be necessary to quickly capture the full spatial extent of emissions impacts to surrounding air quality.
The emissions from LAX are likely not unique on a per-activity basis. The large area of impact from LAX suggests that air pollution studies involving PN, localized roadway impacts, or other sources whose impacts are in the influence zone of a large airport should carefully consider wind conditions and whether measurements are influenced by airport emissions.
Source apportionment of specific airport sources or activities was beyond the scope of our study but would be necessary to evaluate the effectiveness of possible mitigation options. Differing NO2 to NOx ratios at different levels of engine thrust20 might be used to distinguish the contributions of jet landing, idling or takeoff activities. Takeoff and idling emission also differ in surface properties (i.e., the ratio of active surface area to surface bound photoionizable species)21 and particle size distributions differ between aircraft and ground support equipment emissions.21
Acknowledgments
This work was funded by National Institute of Environmental Health Sciences (NIEHS) Grant 1K25ES019224-01 and 5P30ES007048 to the University of Southern California and by US EPA Grant RD-83479601-0. This publication’s contents are solely the responsibility of the grantee and do not necessarily represent the official views of NIEHS or US EPA. Further, NIEHS and U.S. EPA do not endorse the purchase of any commercial products or services mentioned in the publication. We thank Andrea Hricko of USC for helpful comments.
Supporting Information Available
Map of monitoring area (Figure S.1), the instruments used (Tables S.1–S.2), wind roses (Figures S.2 and S.3), illustration of data processing (Figures S.4–S.7), additional maps illustrating the spatial pattern (Figures S.8 and S.9), concurrent sampling with two mobile measurement platforms (Figures S.10 and S.11) and calculations for comparing freeway impact (Table S.3 (a)–(c)) are presented in the Supporting Information. This material is available free of charge via the Internet at http://pubs.acs.org.
Author Present Address
∥ S.A.F.: Keck School of Medicine, Department of Preventive Medicine, University of Southern California, 2001 North Soto Street, Los Angeles, CA 90089-9013, United States.
The authors declare no competing financial interest.
Funding Statement
National Institutes of Health, United States
Supplementary Material
References
- Carslaw D. C.; Beevers S. D.; Ropkins K.; Bell M. C. Detecting and quantifying aircraft and other on-airport contributions to ambient nitrogen oxides in the vicinity of a large international airport. Atmos. Environ. 2006, 40285424–5434. [Google Scholar]
- Yu K. N.; Cheung Y. P.; Cheung T.; Henry R. C. Identifying the impact of large urban airports on local air quality by nonparametric regression. Atmos. Environ. 2004, 38274501–4507. [Google Scholar]
- Fanning E., Yu R. C., Lu R., Froines J.. Monitoring and Modeling of Ultrafine Particles and Black Carbon at the Los Angeles International Airport; California Air Resources Board, 2007.
- Dodson R. E.; Houseman E. A.; Morin B.; Levy J. I. An analysis of continuous black carbon concentrations in proximity to an airport and major roadways. Atmos. Environ. 2009, 43243764–3773. [Google Scholar]
- Klapmeyer M. E.; Marr L. C. CO2, NOx and particle emissions from aircraft and support activities at a regional airport. Environ. Sci. Technol. 2012, 46, 10974–110981. [DOI] [PubMed] [Google Scholar]
- Stettler M. E. J.; Eastham S.; Barrett S. R. H. Air quality and public health impacts of UK airports. Part I: Emissions. Atmos. Environ. 2011, 45, 5415–5424. [Google Scholar]
- Hsu H. H.; Adamkiewicz G.; Houseman E. A.; Zarubiak D.; Spengler J. D.; Levy J. I. Contributions of aircraft arrivals and departures to ultrafine particle counts near Los Angeles International Airport. Sci. Total Environ. 2013, 444, 347–355. [DOI] [PubMed] [Google Scholar]
- Westerdahl D.; Fruin S. A.; Fine P. M.; Sioutas C. The Los Angeles International Airport as a source of ultrafine particles and other pollutants to nearby communities. Atmos. Environ. 2008, 42, 3143–55. [Google Scholar]
- Zhu Y.; Fanning E.; Yu R. C.; Zhang Q.; Froines J. R. Aircraft emissions and local air quality impacts from takeoff activities at a large international airport. Atmos. Environ. 2011, 45, 6526–33. [Google Scholar]
- California State Airport Noise Standards Quarterly Report, First Quarter, Los Angeles World Airports, September 18, 2013. http://www.lawa.org/welcome_lax.aspx?id=1090 (accessed December 03, 2013).
- Los Angeles County Regional Planning Department, Airport Land Use Commission, DRP_Airport_Influence_Areas. http://egis3.lacounty.gov/dataportal/2011/02/09/airport-influence-areas/ (accessed April 19, 2014).
- Fisk C. J.Diurnal and Seasonal Wind Variability for Selected Stations in Southern California Climate Regions, 20th Conference on Climate Variability and Change; American Meteorological Society: New Orleans, January 20–24, 2008; http://ams.confex.com/ams/pdfpapers/135164.pdf (accessed November 11, 2013). [Google Scholar]
- Watson J. G.; Chow J. C.; DuBois D. W.; Green M. C.; Frank N. H.; Pitchford M. L.. Guidance for Network Design and Optimal Site Exposure for PM2.5 and PM10, Report No. EPA-454/R-99-022; U.S. Environmental Protection Agency, Research Triangle Park, NC. 1997. [Google Scholar]
- Li L.; Wu J.; Hudda N.; Sioutas C.; Fruin S. A.; Delfino R. J. Modeling the concentrations of on-road air pollutants in southern California. Environ. Sci. Technol. 2013, 47169291–9299. [DOI] [PMC free article] [PubMed] [Google Scholar]
- Graham A.; Raper D. W. Transport to ground of emissions in aircraft wakes. Part I: Processes. Atmos. Environ. 2006, 40, 5874–85. [Google Scholar]
- Graham A.; Raper D. W. Transport to ground of emissions in aircraft wakes. Part II: Effect on NOx concentrations in airport approaches. Atmos. Environ. 2006, 40, 5824–36. [Google Scholar]
- Karner A.; Eisinger A.; Niemeier D. Near-roadway air quality: Synthesizing the findings from real-world data. Environ. Sci. Technol. 2010, 44, 5334–5344. [DOI] [PubMed] [Google Scholar]
- Zhu Y.; Hinds W. C.; Kim S.; Shen S.; Sioutas C. Concentration and size distribution of ultrafine particles near a major highway. J. Air Waste Manage. Assoc. 2002a, 36274323–4335. [DOI] [PubMed] [Google Scholar]
- California Department of Transportation. http://www.dot.ca.gov/dist07/aboutus/profile/d7p_print.html (accessed November 11, 2013).
- Herndon S. C.; Shorter J. H.; Zahniser M. S.; Nelson D. D. J.; Jayne J. T.; Brown R. C.; Miake-Lye R. C.; Waitz I. A.; Silva P.; Lanni T.; Demerjian K. L.; Kolb C. E. NO and NO2 emissions ratios measured from in use commercial aircraft during taxi and take-off. Environ. Sci. Technol. 2004, 38, 6078–84. [DOI] [PubMed] [Google Scholar]
- Herndon S. C.; Onasch T. B.; Frank B. P.; Marr L. C.; Jayne J. T.; Canagaratna M. R.; Grygas J.; Lanni T.; Anderson B. E.; Worsnop D.; Miake-Lye R. C. Particulate emissions from in-use commercial aircraft. Aerosol Sci. Technol. 2005, 398799–809 10.1080/02786820500247363. [DOI] [Google Scholar]
Associated Data
This section collects any data citations, data availability statements, or supplementary materials included in this article.


