Abstract
Polymer composition and morphology can affect the way polymers interact with biomolecules, cell membranes, and intracellular components. Herein, diblock, triblock, and statistical polymers that varied in charge center type (primary and/or tertiary amines) were synthesized to elucidate the role of polymer composition on plasmid DNA complexation, delivery, and cellular toxicity of the resultant polyplexes. The polymers were synthesized via RAFT polymerization and were composed of a carbohydrate moiety, 2-deoxy-2-methacrylamido glucopyranose (MAG), a primary amine group, N-(2-aminoethyl) methacrylamide (AEMA), and/or a tertiary amine moiety, N,N-(2-dimethylamino)ethyl methacrylamide (DMAEMA). The lengths of both the carbohydrate and cationic blocks were kept constant while the primary amine to tertiary amine ratio was varied within the polymers. The polymers were characterized via nuclear magnetic resonance (NMR) and size exclusion chromatography (SEC), and the polyplex formulations with pDNA were characterized in various media using dynamic light scattering (DLS). Polyplexes formed with the block copolymers were found to be more colloidally stable than statistical copolymers with similar composition, which rapidly aggregated to micrometer sized particles. Also, polymers composed of a higher primary amine content were more colloidally stable than polymers consisting of the tertiary amine charge centers. Plasmid DNA internalization, transgene expression, and toxicity were examined with each polymer. As the amount of tertiary amine in the triblock copolymers increased, both gene expression and toxicity were found to increase. Moreover, it was found that increasing the content of tertiary amines imparted higher membrane disruption/destabilization. While both block and statistical copolymers had high transfection efficiencies, some of the statistical systems exhibited both higher transfection and toxicity than the analogous block polymers, potentially due to the lack of a hydrophilic block to screen membrane interaction/disruption. Overall, the triblock terpolymers offer an attractive composition profile that exhibited interesting properties as pDNA delivery vehicles.
Introduction
In the past decade, there has been an increase in the search and development of alternative vehicles to condense and carry nucleic acids into cells. The delivery and expression of exogenous genetic material have shown potential in the fields of gene therapy, cancer treatment, organ transplants, and vaccinations.1−5 Delivery vehicles must be able to self-assemble with and protect nucleic acids from degradation, traverse vascular, cellular, and intracellular barriers, and finally efficiently deliver their payloads to the nucleus of cells where they can be transcribed and translated into protein.1 Polymeric platforms have the potential to be developed as vehicles because the properties can be readily altered to enhance specificity and efficacy, and they can be manufactured in bulk;6 yet, much work is still needed to refine potential platforms for clinical application.
Typically, amines have been used to prepare cationic polymers for polyplex formation. Cationic polymers, such as polyethylenimine (PEI),7,8 poly-l-lysine (PLL),9 and polyamidoamine (PAMAM),10,11 have been heavily studied for nucleic acid complexation in a fashion that promotes uptake, internalization, and transfection of cells. These polymers all have different compositions of charge centers ranging from primary, secondary, and tertiary amines. The difference in chemical properties of these polycations are of interest as they have different pKa values and hydrophobicity profiles, which can affect cell membrane interaction, the polymer–nucleic acid binding strength, and dissociation of these species once within the cell.12−16 PEI (linear PEI, pKa = 8.44), a commercially available gene delivery vehicle, contains secondary amines along the backbone and has a general high transfection efficiency; however, it is toxic to some cell types.15,17,18 The incorporation of carbohydrate moieties along a polycation backbone has been shown to reduce the cytotoxic response of polycation vehicles.17−20 In addition, glycopolymers have also been shown to interact with lectins, mimic biological functions, and offer specificity in delivery.17,21,22 Previously, a series of diblock copolymers containing a fixed length of carbohydrate block (2-deoxy-2-methacrylamido glucopyranose (MAG)) copolymerized with a cationic block consisting of primary amine (N-(2-aminoethyl) methacrylamide (AEMA)) were shown by our group to compact pDNA into polyplexes. These vehicles were found to be colloidally stable in physiological salt and serum conditions and exhibited high pDNA and siRNA internalization with low toxicity profiles. Interestingly, the efficacy for gene expression (pDNA) and gene knockdown (siRNA) was highly dependent on the cationic block length.23 For pDNA, shorter AEMA block lengths lead to higher expression; it was speculated that the increase in cationic block length led to tighter binding and poor pDNA release once inside the cell. However, the opposite trend was found for siRNA, signifying that the short linear nucleic acid motif required a longer cationic block for stable encapsulation and effective gene knockdown.
Incorporating other charge center types (such as tertiary amines) and arrangement of these charges along the polycation backbone (i.e., statistical versus block) alters the pKa value of the polycation. Indeed, this property can alter the strength of nucleic acid binding, pDNA release, polyplex charge, and possibly cellular interaction and toxicity. For example, 2-(N,N-dimethylamino)ethyl methacrylate has been incorporated into polymer vehicles and shown to successfully condense pDNA into polyplexes and facilitate transfection.24−27 Incorporation of a tertiary amine into a polymeric vehicle is also thought to contribute to a buffering effect once within the acidic endosomal membranes in cells, whereas incorporating primary amine-containing aminoethyl methacrylate groups is thought to have a lower buffering effect.28,29 Tertiary amines, such as N,N-(2-dimethyl-aminoethyl) methacrylamide (DMAEMA), may also impart a slight steric effect in comparison to primary amines (AEMA) when comparing the binding of these cationic centers to the polyanionic DNA backbone.16 Also, it has been reported that polymers containing a combination of AEMA and DMAEMA have an enhanced association with the cellular membrane due to hydrophobic interactions.29 The two methyl groups on DMAEMA may allow insertion of the cationic amine into the phospholipid membrane, which can cause a negative Gaussian curvature.30 Furthermore, statistical polymers composed of AEMA and 3-gluconamidopropyl methacrylamide have been shown to be less toxic and have higher gene expression than their block copolymer counterparts.19 Dispersing the cationic charge throughout the entire length of the polymer, rather than confining it all into a block, may decrease binding affinity and promote pDNA release once within the cell.
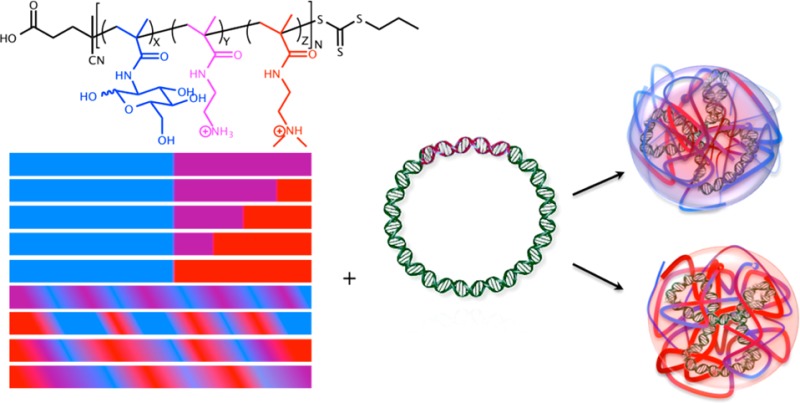
To further understand the role of polymer composition in polyplex formation, delivery efficiency, and cellular cytotoxicity, a series of carbohydrate-containing polycations with varying ratios of primary and/or tertiary amines were synthesized via radical addition–fragmentation chain transfer (RAFT) polymerization. Diblock, triblock, and statistical co- and terpolymers were created that contain a carbohydrate moiety (MAG), a primary amine (AEMA), and/or a tertiary amine (DMAEMA). Both the carbohydrate and cationic block lengths were kept constant, while the content ratio of primary to tertiary amines was varied within the polymer models (Figure 1). The goal of this study was to understand and compare the role of (i) charge center composition (primary versus tertiary amines) and (ii) polymer structure (statistical versus block) on polyplex formation, pDNA delivery, and, in particular, cell membrane interaction and toxicity. Herein, we show that these factors play a large role in determining the efficiency of these delivery vehicles. Polycations containing primary amines (AEMA) promote tight pDNA binding and form colloidally stable polyplexes. While these structures have a lower buffering effect in the cellular pH range, they still promote high delivery and cell viability. Polyplexes formulated with polymers containing tertiary amine (DMAEMA) charges were found to have higher cellular internalization profiles but were significantly more toxic to cells (due to membrane destabilization). In addition, block versus statistical motifs were examined, and it was found that as the amount of DMAEMA in the charge block increased, colloidal stability of the polyplexes and cell viability both significantly decreased.
Figure 1.
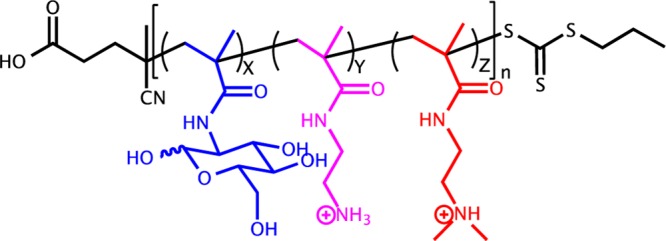
Synthesized copolymer structure. Monomers are MAGX (blue), AEMAY (purple), and DMAEMAZ (red); and the polymer is poly(GX-PY-TZ). N is the total number of repeat units in the polymer.
Materials and Methods
Materials and Reagents
All solvents were purchased from Thermo Fisher Scientific. Cell culture media and supplements were purchased from Life Technologies (Grand Island, NY). Human cervix adenocarcinoma (HeLa) cells were purchased from ATCC (Rockville, MD). For a comparison to previous literature and as a standard, JetPEI (linear PEI, PolyPlus Transfections, Illkirch, France) and Glycofect (Techulon, Blacksburg, VA) polymers were also analyzed with the synthesized polymers. Glycofect is a degradable polymer (Mw = 4.6 kDa; degree of polymerization, n = 11, made at N/P = 20); JetPEI likely does not degrade during the time course of the experiment (Mw ≈ 22 kDa; N/P = 5). Polymers were analyzed with gel permeation chromatography (GPC) (Agilent, Santa Clara CA) equipped with refractive index and multiple angle light scattering detectors (Wyatt, Santa Barbara, CA) and nuclear magnetic resonance (NMR) (Bruker, Billerica, MA). A Bruker Avance III NMR equipped with BBFO Smart Probe operating at 500 MHz for 1H and 125 MHz for 13C was used for structural characterization. Polyplexes were analyzed with a gel electrophoresis kit (Invitrogen, Carlsbad, CA) and imaged using a Spectroline Bi-O-Vision UV transilluminator (Westbury, NY) and photographed with a 33 mm lens 8 MP digital camera (Cupertino, CA). Zeta potential and dynamic light scattering (DLS) were measured on a Malvern Zetasizer Nano ZS (Worcestershire, UK). Lysed cells were analyzed on a BioTek Plate Reader (Winooski, VT) for absorbance and luminescence. Transfected cells were run on a BD FACSVerse (BD Biosciences, San Jose, CA) with dual lasers (λ = 488 and 640 nm), seven detectors, and analyzed using FlowJo software (Ashland, OR). 2-Deoxy-2-methacrylamido glucopyranose (MAG)31 and 4-cyano-4-(propylsulfanylthiocarbonyl)sulfanylpentanoic acid (CPP)32 were synthesized as previously published. N-(2-Aminoethyl) methacrylamide (AEMA) and N,N-(2-dimethylamino)ethyl methacrylamide (DMAEMA) were purchased from Polyscience (Warrington, PA), and 4,4′-azobis(4-cyanovaleric acid) (V-501) was purchased from Sigma-Aldrich (St. Louis, MO) and recrystallized twice from methanol.
Polymer Synthesis
Polymers were synthesized by combining the monomer(s), chain transfer agent (CTA), and initiator at 1000:10:1 molar ratio, respectively, in 4:1 0.1 M acetate buffer (pH 5.2)/ethanol at 70 °C. The carbohydrate block was chain extended with AEMA and/or DMAEMA in 1 M acetate buffer (pH 5.2) at 70 °C.
Block Copolymers
In a 50 mL round-bottomed flask equipped with a magnetic stir bar, MAG (1.0 g, 4.04 mmol), CPP (11.22 mg, 40.4 μmols), and V-501 (1.13 mg, 4.04 μmols) were added in 40 mL 4:1 0.1 M sodium acetate buffer (pH 5.2)/ethanol. The vial was sealed with a rubber septum and purged with N2(g) for 2 h before being heated in a hot oil bath at 70 °C for 1 h. The reaction was quenched by exposure to air and purified via extensive dialysis with a molecular weight cut off (M.W.C.O.) membrane of 3500 g/mol against water for 4 days and then lyophilized. Poly-block(MAG) was characterized with GPC and NMR (Supporting Information Figures S2–S7).
Poly-b(MAG46) (80 mg in each vial) was used as the macroCTA and chain extended with AEMA and/or DMAEMA in 1 M acetate buffer (pH 5.2) at 70 °C for varying amounts of time. The five block copolymers were purified against water (pH 4) in a dialysis membrane for 4 days and then lyophilized. Polymers were characterized with GPC and NMR.
Statistical Copolymers
In four separate 10 mL glass ampules, equal molar amounts of (a) MAG/AEMA; (b) MAG/DMAEMA; (c) MAG/AEMA/DMAEMA; and (d) AEMA/DMAEMA/2×MAG (twice the molar equivalence of MAG to AEMA or DMAEMA) was added. The total monomer concentration was 0.25 M, dissolved in 4:1 0.1 M acetate buffer (pH 5.2)/ethanol. CPP and V-501 were added according to the previously specified ratios. Magnetic stir bars were added, and the ampules were subjected to four freeze–pump–thaw cycles before being sealed and placed in a 70 °C oil bath for 2.5 h. The reaction was stopped by quenching the ampule in liquid nitrogen and breaking open the seal. The polymers were purified against water (pH 4) via extensive dialysis (M.W.C.O. 3500 g/mol membrane) for 4 days and then lyophilized before being characterized with GPC and NMR (Supporting Information, Figures S8–S11). An example reaction of (c) MAG/AEMA/DMAEMA is as follows: MAG (140 mg, 0.566 mmol), AEMA (93 mg, 0.566 mmol), and DMAEMA (88 mg, 0.566 mmol) were dissolved in 6.795 mL of 4:1 acetate buffer (pH 5.2)/ethanol solution. The chain transfer agent CPP (4.7 μg, 17 μmol) and initiator V-501 (0.48 μg, 1.7 μmol) were added last before the vial went through 4 freeze–pump–thaw cycles and was sealed and heated in an oil bath at 70 °C.
Kinetics
The kinetics of polymerization of each monomer and the reactivity ratios between the monomers were determined by NMR at 70 °C with pulses at regular intervals at specified times. The kinetics of each monomer was determined by plotting the conversion of each monomer to polymer over time. Monomer consumption was pseudo-first-order (linear) when plotted.12 For the reactivity ratios, monomers were combined in a pair wise manner and polymerized with V-501 in D2O sodium acetate buffer (pH 5.2). The feed monomer mole fraction ranged from 0.10 to 0.90. The NMR tube was sealed with a rubber septum and purged with nitrogen gas for 30 min. An initial NMR was taken at room temperature, then the probe was heated to 70 °C, locked, and shimmed on a dummy sample before the insertion of the sample tube. The vinyl peak integration was monitored, and the decrease in this signal was used to calculate monomer conversion into the polymer (Figure S12, Supporting Information). Total monomer conversion was kept below 10%. A Mayo–Lewis plot for f1 and F1 was utilized to determine the reactivity ratios (r1 and r2) (the relative probabilities of monomer self-propagation to cross-propagation).33−35 GPC was used to determine the molecular weight of the polymers, while 1H NMR was used to determine the molecular content of the polymers.
Titrations
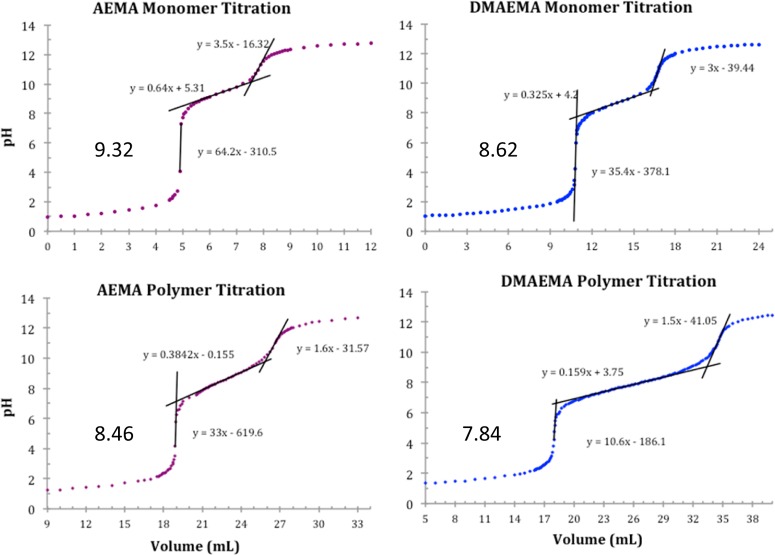
To measure the pKa of the monomers, 0.10 M solutions of the AEMA and DMAEMA monomers were made in Millipore water. The solution was first acidified to pH 1.0 with 1.00 M hydrochloric acid, and then 0.20 M NaOH was added in known increments at 25 °C, and the pH was monitored with a AB15 digital pH electrode (Accumet Basic, Fisher Scientific, Pittsburgh, PA). The potentiometer was standardized with buffers at pH 4, pH 7, and pH 10. Solutions of the same concentration (0.10 M, on a per monomer basis) of the homopolymers containing AEMA and DMAEMA were also made and similarly analyzed for pKa and buffering capability in the same manner as that described above (Figure 2).
Figure 2.
Potentiometric titration curves of AEMA and DMAEMA monomers and homopolymers. The solutions were acidified to pH 1 with 1 M HCl and titrated with 0.20 mol L–1 NaOH. The pKa of the AEMA and DMAEMA were 9.32 and 8.62, respectively, while the pKa of the primary and tertiary amine homopolymers were 8.46 and 7.84, respectively.
Polyplex Formation and Characterization
The polymers were solubilized in ultrapure H2O to a determined N/P ratio/concentration before being used further in biological assays. All polyplexes were formed by adding equal volumes of polymer solution to 0.02 μg/μL pDNA solution, and the samples were then incubated for 45 min at room temperature. To determine the N/P ratio at which each polymer condenses the negatively charged phosphate groups on the backbone of DNA, a gel electrophoretic shift assay was performed at N/P ratios from 0 to 10 in a 0.6% agarose gel containing ethidium bromide (6 μL/100 mL TAE buffer).
DLS
The size of the polyplexes was measured by dynamic light scattering (DLS) at 633 nm on a Malvern Instruments Zetasizer Nano ZS (Worcestershire, UK) in water, Opti-MEM, and DMEM with 10% FBS. Stability was determined by measuring the size of the polyplexes at 0 h, 2 h, 4 h, and 6 h in water and media containing salts and proteins.
Cell culture studies were done using HeLa cells. Cells were seeded at 100,000 cells/well in DMEM with 10% FBS in a 12 well plate (Corning, MA). Cells were cultured for 24 h at 37 °C and 5% CO2 to allow the cells to adhere to the plate before being washed with PBS and transfected with polyplexes. The total volume of the polyplex solution added was 600 μL (200 μL of polyplex solution and 400 μL of Opti-MEM). After 4 h, 1 mL of DMEM with 10% FBS was added. Twenty-four hours post-transfection, the cells were washed with PBS, and fresh DMEM (1 mL) was added. Forty-eight hours post-transfection, the cells were analyzed in various assays to understand the toxicity and delivery efficiency of the polymers (described below).
Toxicity
The MTT assay has long been used as a reliable colorimetric assay for cell viability.18,36 MTT assays were completed per the manufacturer’s instructions. In brief, 48 h post-transfection, the cells were washed with PBS and then 1 mL of DMEM containing 0.5 mg of 3-(4,5-dimethyl-2-thiazolyl)-2,5-diphenyltetrazolium bromide (MTT) reagent was added to each well. The cells were incubated for 1 h before being washed with PBS again, and 600 μL of DMSO was added to dissolve the purple formazan. The plate was gently rocked for 10 min, and 200 μL of the DMSO solution was removed and pipetted into a clear 96 well plate and analyzed by a BioTek (Winooski, VT) plate reader at 570 nm.
Gene Expression
Polyplexes were made with gWiz-Luc luciferase reporter plasmid DNA (Photinus pyralis) (Aldevron, Fargo, ND), coding for the firefly luciferase gene. Forty-eight hours post-transfection, the cells were washed with PBS and lysed with 100 μL 1× luciferase cell culture lysis reagent. After 30 min of incubation, 5 μL of lysed cells was pipetted into an opaque 96 well plate. After adding 95 μL of luciferin reagent to each well, the luminescence was measured with the BioTek plate reader.
Cell Viability, Membrane Permeabilization, and pDNA Internalization
A general protocol was used to analyze the polyplex formulations for toxicity, ability to permeabilize the cell membrane, and promote pDNA internalization. pCMV-LacZ pDNA was labeled with Cy5 per the manufacturer’s instructions (Mirus Bio LLC, Madison, WI). Cells were plated at 100,000 cells/well in 1 mL of DMEM in a 12 well plate. The cells were washed with PBS prior to transfection. Polyplexes (200 μL) were added to the cells in Opti-MEM (400 μL). Four hours post-transfection, the cells were washed with PBS and trypsinized (500 μL) for 10 min before DMEM (500 μL) was added. The cells were transferred to a falcon tube and centrifuged at 1000g for 10 min at 4 °C. Most of the media was removed, and 1 mL 1× binding buffer (eBioscience, San Diego, CA) was added to each falcon tube and vortexed before being centrifuged again for 10 min at 4 °C. The media was removed, and 100 μL of 1× binding buffer containing 2 μL of Annexin V (eBioscience) was added. The falcon tubes were vortexed and allowed to sit at room temperature for 10 min before another 1 mL aliquot of 1× binding buffer was added. The falcon tubes were then centrifuged again. The media were removed, and 100 μL of 1× binding buffer containing 5 μL of 7-AAD viability staining solution (BD Biosciences, San Jose, CA) and 50 μL of CountBright absolute counting beads (Life Technologies, Grand Island, NY) was added. Each sample was vortexed again before being analyzed on the Flow Cytometer. Twenty-thousand events were collected per falcon tube, and the experiment was performed in triplicate. The data were analyzed in FlowJo software, and gates were determined from the double negative (cells only) and negative staining samples (cells + Annexin V, cells + 7AAD, and cells + Cy5 pDNA) as seen in the Supporting Information (Figure S23–S25b). Cells were gated using curved quadrants to account for error profiles caused by the photomultiplier tube (a feature in the FlowJo data analysis software package).
Microscopy
Cells were plated on Delta T dishes (Bioptechs Inc., Butler, PA) 24 h pretransfection at 50,000 cells in 1 mL of DMEM. Cells were washed with PBS before being transfected with 100 μL of polyplex solution (0.01 μg/μL pDNA) at an N/P ratio of 10 in 1 mL of Opti-MEM. The Delta T dish was covered with a Delta T heated glass lid and fitted to the EVOS Digital Microscope adapter stage (AMG Life Technologies, Grand Island, NY) and warmed to 37 °C. Carbon dioxide gas was supplied to the Delta T dish at 1 mL/min. The cells were viewed at 40× magnification under transmitted light and fluorescence at 628 nm. Images of the cells were captured every 10 s for 4 h and later compiled at 60 fps into a 24 s movie clip. Cells were also transfected with a green fluorescent protein (GFP) encoding plasmid (pZGreen) (Clontech), and cells were imaged 48 h post-transfection at 40× objective under transmitted light and fluorescence at 470 and 350 nm.
Results and Discussion
Synthesis and Characterization of Polymers
Synthesis
The block and statistical copolymer models were synthesized via RAFT polymerization. RAFT is compatible with aqueous solvents and gives excellent control over the degree of polymerization without using harmful metal catalysts.1,6,31,37−39 The first polymer synthesized was the polyMAG CTA (MAG is denoted as G in the polymers) poly(G46). The purified polymer was characterized with 1H NMR (Figures S1 and S2, Supporting Information) and shows the disappearance of the vinyl resonances at σ 5.5 (1H) and 5.7 (1H) ppm and the appearance of the methylene groups, CH2 (2H), in the polymer backbone from 1.5–2.3 ppm. GPC analysis revealed the Mn to be 11.7 kDa (n = 46) and a low dispersity index (Đ = 1.02) signifying high control in the polymerization. The poly(G46) macroCTA was then chain extended with primary amine monomers (AEMA denoted as P in the polymers) and/or the tertiary amine monomers (DMAEMA denoted as T in the polymers). The statistical copolymers were prepared by adding the monomers with CTA and initiator together and then heating under a nitrogen atmosphere. To ensure that the statistical copolymers had a composition similar to that of the monomer feed ratio, the polymerizations were run to high conversions, thus leading to longer polymers with slightly higher dispersities. Data for the nine block and statistical copolymer analogues are shown in Table 1, and 1H NMR spectra can be found in the Supporting Information (Figures S3–S7).
Table 1. Molecular Characterization of the Synthesized Block and Statistical Copolymers.

Molecular weight (Mn) and dispersity (D) determined by gel permeation chromatography.
Number of repeating units (n) in each polymer determined by 1H NMR spectroscopy in D2O at 500 MHz with a relaxation delay of 10 s.
After the copolymers were synthesized and purified, 1H NMR (Figures S8–S11, Supporting Information) was utilized to characterize the polymer composition, while GPC was used to analyze the molecular weight and dispersity. The four statistical copolymers are represented in Table 1. Although the composition of the statistical copolymers can be determined with NMR and GPC, the ordering of the repeating units can only be understood as a function of monomer relative reactivity ratios.35 The reactivity of AEMA, DMAEMA, and MAG was examined in a pairwise fashion using conventional free-radical polymerization. By varying the molar fraction feed (f1) of monomer (r1 and r2) and monitoring the polymer composition (F1), the reactivity ratios could be calculated using the nonlinear Mayo–Lewis equation.33,34
| 1 |
The reactivity ratios of the three monomers (Table 2) show that the statistical copolymers are slightly gradient in nature; being that rMAG > rAEMA and rDMAEMA. These data signify that the MAG monomer prefers to react with itself in the presence of the other two monomers, and AEMA and DMAEMA prefer to cross-propagate in the presence of MAG; however, they do not have a preference for reacting with the other charged monomer or themselves. This leads to polymers that likely have a higher concentration of glucose moieties on one end of the polymer and alternating AEMA and DMAEMA charged moieties in the case of the statistical copolymers synthesized with all the monomers.
Table 2. Reactivity Ratios of the Three Monomers Used in the Statistical Copolymers, Determined by Altering the Feed Ratio (f1) of Each Monomer and Polymerizing Using a Free-Radical Approach at 70 °C in 500 MHz Variable Temperature NMRa.
|
r2 |
|||
|---|---|---|---|
| r1 | MAG | AEMA | DMAEMA |
| MAG | 1.54 | 0.88 | |
| AEMA | 0.30 | 0.63 | |
| DMAEMA | 0.19 | 0.61 | |
The r1 and r2 values were calculated from eq 1. r1 = (k11/k12), and r2 = (k22/k21).
Titrations
Many previous studies have shown that the charge center type within polymeric vehicles has a large effect on the polymer-pDNA binding strength (polyplex stability), the interactions of the polymer with the cell membrane, and the buffering capacity in the biological pH range. Thus, incorporating primary and/or tertiary amines within these polymer structures alters the pKa of the polymers significantly and, thus, the above properties. To determine and compare the pKa values of the AEMA and DMAEMA monomers and homopolymers, titrations were performed (Figure 2). As expected, the tertiary amine DMAEMA monomer and polymer were found to have a lower pKa than that of the primary amine AEMA derivatives. It was also found that the homopolymers of these monomers had a lower pKa than the monomers themselves (Table 3). This phenomenon has been studied in detail by Lee et al.40 The values of DMAEMA in Table 3 closely match those reported by van de Wetering et al., who reported pKa values of 8.5 and 7.8 for the monomer and polymer, respectively.1,41 Both the primary and tertiary amine groups are fully ionized in the monomers at a pH of 5.2, which was the rationale for selecting this pH for statistical and block copolymer synthesis. The higher pKa of the primary amine moieties leads us to hypothesize that polyplexes formed with AEMA charge centers could be more tightly bound than that of polyplexes formed with polymers containing DMAEMA. Additionally, the two methyl groups on the tertiary amine (particularly when not protonated) may also provide more of a hydrophobic character to the polymer, which could influence interactions with the cell surface and various biomolecules.
Table 3. AEMA and DMAEMA pKa Values of the Monomers and Polymersa.
| monomer | polymer | |
|---|---|---|
| AEMA | 9.32 | 8.46 |
| DMAEMA | 8.62 | 7.84 |
The pKa values were determined by adding 0.20 mol L–1 NaOH at 25 °C to a solution of AEMA and DMAEMA monomer and homopolymer.
Polyplex Formation
The N/P ratio is a molar ratio between positively charged nitrogens (N) on the polymer and negative phosphate (P) groups on the backbone of the pDNA. It should be noted that the N/P ratio (the concentration of amines) in solution is being compared between the different polymer systems (and the polymers are being compared at the same N/P value); therefore, depending on the composition of the polymer, the concentration of the polymer chains in solution will not be the same between the different systems analyzed (i.e., polymers containing a higher content of amines are typically less concentrated in solution). From the gel mobility shift assays (Figures S15 and S16 in the Supporting Information), it can be observed that the free pDNA (0 N/P) travels through the gel to the positive electrode but by 5 N/P, the pDNA is completely bound by the polymers, as it is stationary in the loading well. The zeta potential (Figure S27, Supporting Information) was also measured for the polyplexes formulated at 5 N/P. The zeta potential for all polyplexes was positive, generally found to be between +10 mV and +35 mV for the polyplex solutions. Moving forward, two N/P ratios (5 and 10) were chosen to assess complex stability from aggregation in water, Opti-MEM, and DMEM (containing 10% FBS). Previously, we have shown that polyplexes formed with diblocks of MAG and varying lengths of AEMA were stable in cell culture media and did not flocculate over time.23 It has also been shown by others that polyplexes formed with poly(N,N-(2-dimethylamino)ethyl methacrylate) have a size to N/P ratio relationship; at lower N/P ratios, the polyplexes were larger (∼1000 nm), but at high N/P ratios, the polyplexes were uniformly smaller (<200 nm in water and ∼600 nm in serum containing solution).42 Our polyplexes were formed at N/P ratios of 5 and 10 to assess the biological relevance of the complexes with respect to complex stability, toxicity, cellular internalization, and transgene expression.
The stability of these polyplexes was determined by monitoring the size/aggregation of particles in water, Opti-MEM, and DMEM containing 10% FBS over the period of 6 h. All of the polyplex types were stable in water as the size did not change (generally around 100 nm) over the course of 6 h. When the polyplexes were added to cell culture media (Opti-MEM; Figure 3 and Figure S28, Supporting Information), some of the polyplex formulations aggregated with time, which was highly dependent on the polymer chemistry and tertiary polyplex structure. The perikinetic flocculation seen in Opti-MEM is most likely occurring because the increased concentration of salts in solution decreases the Debye length.
Figure 3.
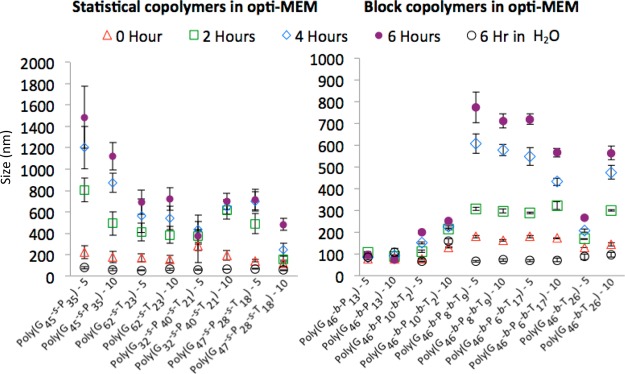
DLS measurements show the hydrodynamic diameter of the polyplexes formed at 5 and 10 N/P with the statistical and block copolymers developed herein. Polyplex size was analyzed in water and Opti-MEM, and the size was measured by dynamic light scattering (DLS) at 633 nm on a Malvern Instruments Zetasizer Nano ZS at 173° back angle scatter; time zero is when the polyplexes (formulated in water) were added to Opti-MEM. Error bars are the standard deviation of all the data collected, a minimum of three replicates. A table of this data can be found in the Supporting Information (Figure S28).
It was presumed that all of the block copolymers would promote colloidal stability in the polyplex formulations by coating the core–shell polyplex structure with a hydrophilic polymer. This was clearly noticed in polyplex formulations with the AEMA charge centers [poly(G46-b-P13)] compared to the analogous polyplexes formed with DMAEMA poly(G46-b-T26). However, this was not the case with two of the triblock copolymers, which aggregated to ∼700 nm. It appears that polyplexes formed from the block polymers composed of all three monomers had colloidal stability that diminished as more of the DMAEMA monomer was incorporated, leading to polyplexes that rapidly aggregated.
This signifies that the polymers containing primary amine charges likely have a higher binding affinity to the pDNA in the diblock copolymer, while the hydrophilic glycopolymer shields the polyplex from flocculation. When comparing the difference between the statistical and block copolymers, all the polyplexes formulated with the statistical copolymers aggregated over time in media; however, the statistical copolymers containing some fraction of DMAEMA formed smaller aggregates. Interestingly, statistical copolymers containing the MAG and AEMA, poly(G45-s-P35), revealed the most rapid and largest aggregation to particles over a micrometer in size. The lower aggregation seen in some of the other statistical copolymer formulations can be attributed to the reactivity ratios between the three monomers. As previously mentioned, the statistical copolymers likely have a gradient nature to their composition due to the reactivity ratios between the monomers (the MAG monomers are likely clustered at one end of the polymer). The short cationic block composed of both primary and tertiary amines (triblocks) seems to not bind as tightly as the diblocks containing just one type of amine.
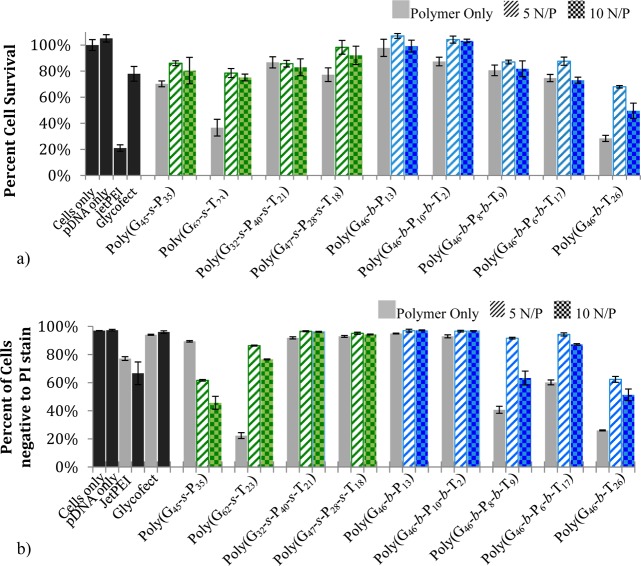
Maintaining cell viability is one important component to obtaining higher delivery efficiency. To investigate the cytotoxicity of polyplexes at N/P ratios of 5 and 10, MTT assays were performed with HeLa cells. The cell viability was measured 48 h post-transfection (Figure 4a). A clear toxicity trend was observed; polyplex toxicity increased as the amount of tertiary amine in the polymer increased, particularly with the block copolymers. Rawlinson et al. reported that the cytotoxicity of pDMAEMA is cell type and molecular weight dependent.43 With the statistical copolymers, a similar trend was noticed but was not as pronounced. Although the composition of poly(G62-s-T23) and poly(G46-b-T26) are similar, the poly(G62-s-T23) model is likely slightly less toxic possibly due to the cationic amine being spread throughout the polymer backbone with the glucose moiety. Ahmed and Narain have examined similar polymers created with AEMA and monomers containing glucose and showed that a trend exists similar to that which we have observed; statistical copolymers are less toxic than their block copolymer counterparts.17,19 When considering the effect of free polymer on toxicity, it was interesting to note that both the statistical [poly(G62-s-T23)] and block [poly(G46-b-T26)] analogues containing only the tertiary amine charged groups caused a large portion of the cells to die (when not complexed with pDNA into polyplexes). Indeed, the toxicity of free polymer was higher than that when the same concentration of polymer was contained in a polyplex. Thus, free polymer in solution interacts strongly with cells, which may be internalized, and these interactions/pathways may be different from those when the polymer is complexed with pDNA in a polyplex. This high toxicity was not observed in the MTT assays with the polymer only samples that contained the primary amine moieties.
Figure 4.
(a) MTT assay (percent cell survival) of cells treated with polymer only or polyplexes formulated at N/P ratios of 5 or 10. Samples were analyzed 48 h post-transfection. (b) The percent of cells whose membranes are intact and not permeable to propidium iodide stain as determined via flow cytometry. Cells were treated with polymer only or polyplexes at N/P ratios of 5 and 10. Samples were analyzed 4 h post-transfection. All data are standardized to cells only, and control and error bars are the standard deviation of three replicates.
The integrity of the cell membrane and thus cell viability were also evaluated by adding propidium iodide (PI) stain to the cells 4 h post-transfection (Figure 4b). Cells exposed to polymer only (no pDNA) and polyplexes were evaluated for membrane permeability by the number of cells positive to PI (PI is only internalized into cells with compromised membranes).44 Again, it was noticed that as the amount of tertiary amine increased in the polymers, cell permeability to PI increased; this was particularly evident for the block copolymer formulations. When observing the effect of polymer only (no pDNA) with cells, poly(G62-s-T23), poly(G46-b-P8-b-T9), poly(G46-b-P6-b-T17), and poly(G46-b-T26) interacted with the cells to a high degree. Also, for polyplexes formulated with the block copolymers at N/P 10, as the tertiary amine content increased, PI permeability increased indicating that the tertiary amine polymers have a very high membrane destabilization effect. Most of the statistical copolymers appeared more benign to cells (with the exception of polyplexes made from poly(G45-s-P35) and the polymer only formulation of poly(G62-s-T23); spacing the charge with the glucose units may soften the interaction of the charged polymers with the cell membrane so that they are not as lytic. On the contrary, poly(G45-s-P35) polyplexes appeared to cause membrane destabilization, but the block copolymer analogue poly(G46-b-P13) did not. This could be due to two factors: (i) the block system had a smaller number of charges copolymerized and/or (ii) having a primary amine (high pKa) close to the polyplex surface (as with the polyplex formulation with the statistical copolymer) could increase the interactions with the cell membrane, causing destabilization. In the block formulation, the charge is buried in the polyplex core (complexed to pDNA), and the glucose shell on the polyplex surface may not have such a strong interaction/destabilizing effect with the cell membrane. These results indicate that cells that are PI positive may not necessarily be dead but rather have compromised membranes from interaction with the polymers, specifically the tertiary amine rich polymers. It should be noted that destabilization in the cell membrane could be caused by direct polymer interactions with the cell membrane or from cytotoxic effects of the polymer (from the tertiary amines).
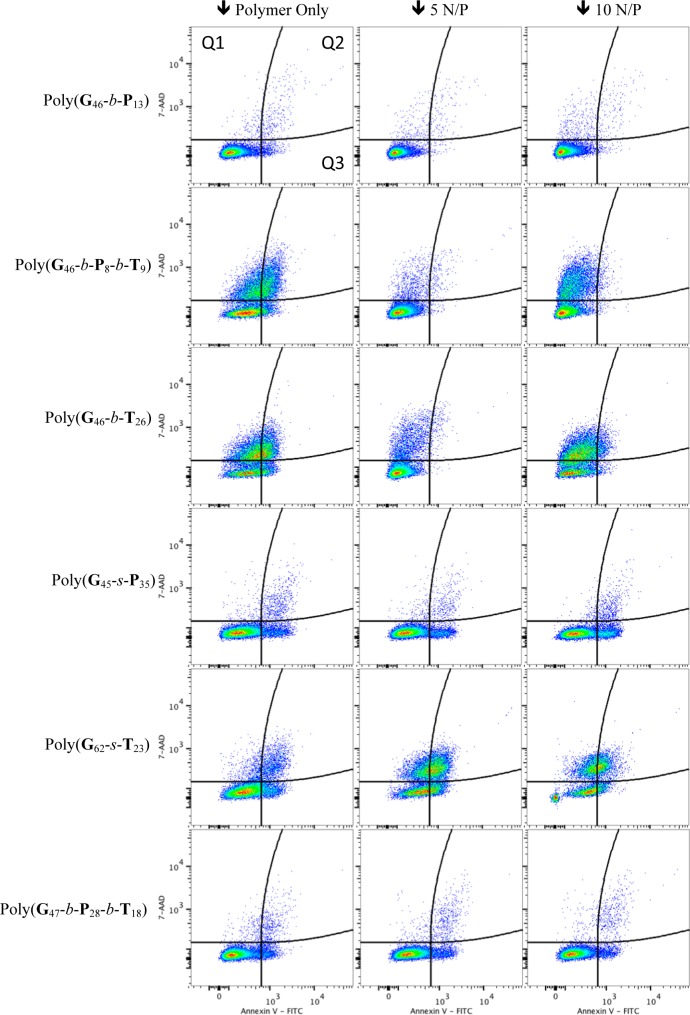
To further examine and understand the toxicity and membrane destabilization, assays were performed with these formulations to monitor whether cells were going through apoptosis. An Annexin V assay was completed to determine whether cells were expressing phosphatidylserine, a marker for apoptosis, on their surface.45,46 The Annexin protein has a low Kd for phosphatidylserine (5 × 10⁻¹⁰ M), a protein only found on the cytoplasmic side of the phospholipid bilayer except during apoptosis.47 The Annexin V assay was performed in conjugation with a dye exclusion assay to establish the cell membrane integrity during the experiment. While the Annexin protein is large (36 kDa), a small molecule dye, 7-AAD, was utilized to distinguish between cells with compromised membranes and dead/necrotic cells. This assay allows us to gain information on whether the polymers/polyplexes are causing small holes/destabilizing the phospholipid membrane (7AAD positive) and/or if the polymers/polyplexes have triggered apoptosis (Annexin V positive) or necrosis (cells positive for both 7AAD and Annexin V).44
The flow cytometry data (Figures 5, S23, and S24, Supporting Information) showed very compelling evidence that some cells did have destabilized membranes/small holes (without causing a large population to be apoptotic), meaning that 7-AAD could pass through the membrane but were not positive for Annexin V. These populations came from cells treated with polymers containing tertiary amines: poly(G62-s-T23), poly(G46-b-P8-b-T9), poly(G46-b-P6-b-T17), and poly(G46-b-T26) (Figures 5, S23, and S24 (Supporting Information), and red bars in Figure 6). The tertiary amine diblock [poly(G46-b-T26)] at 10 N/P showed the highest membrane disruption; only 6.6% of the cells were dead, but 65% of the cells had destabilized membranes, showing cellular internalization of 7AAD without cells being positive for Annexin V. The amount of Annexin V positive (apoptotic) cells indicates more information about the cytotoxicity of each polymer/polyplex formulation with HeLa cells. It was found that the two statistical formulations poly(G45-s-P35) and poly(G62-s-T23) caused a portion of the cell population (about 20%) to undergo apoptosis (Figure 6). With respect to the block copolymers, the polyplex formulations were not toxic to cells (<7% dead); however, the polymer only samples of poly(G46-b-P8-b-T9), poly(G46-b-P6-b-T17), and poly(G46-b-T26) caused between 18 and 30% of the cells to die. A similar trend was noticed in the MTT and PI assays (Figure 4). It was indeed evident from these data that the control polyplex formulation with JetPEI caused over 60% of the cells analyzed to be dead and show signs of apoptotic markers on their surface after only 4 h of polyplex exposure and that it was the most toxic formulation examined here (similar to the MTT results in Figure 4). With the exception of poly(G45-s-P35), all other formulations (polymers and polyplexes) with the high primary amine content [poly(G32-s-P40-s-T21), poly(G47-s-P28-s-T18), poly(G46-b-P13), and poly(G46-b-P10-b-T2)] were found to be quite benign to the cells (Figure 6).
Figure 5.
Flow cytometry analysis of cells for membrane permeability (7-AAD positive), apoptosis (Annexin V positive), and necrosis (both 7-AAD and Annexin V positive). Data are plotted as 7-AAD (y-axis) versus Annexin V (x-axis). Pseudocolor represents the density of 20,000 events plotted. Quadrant 1 (Q1) depicts cells that are only 7-AAD positive (seen as red bars in Figure 6), Q2 denotes cells that are 7-AAD and Annexin V positive (double positive gray bars in Figure 6), and Q3 denotes apoptotic cells that are only Annexin V positive (blue bars in Figure 6).
Figure 6.
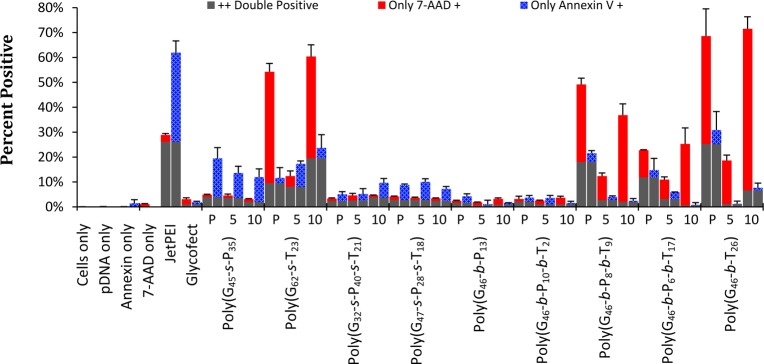
Percentage of cells that are fluorescent for 7-AAD positive (height at the top of the red bar) and Annexin V positive (height of blue bar). Each sample is represented by two bars. Cells that are double positive (cells in Q2 in Figure 5) are depicted as gray bars. Red bars correspond to percent of cells in Q1 and blue bars to Q3 in Figure 5. P, 5, and 10 correspond to the polymer only sample, the 5 N/P sample, and the 10 N/P sample for each polymer listed below. Error bars are the standard deviation of the data collected in triplicate.
These data further support our hypothesis that the tertiary amine polymers interact with the cell in a nonspecific manner and induce pore formation in the cellular membrane, leading to high toxicity. Hong et al. has reported and imaged (with AFM) this behavior in cell membranes with polycations.48 Interestingly, at 5 N/P, close to the complexation point, the cells had a higher survival rate (lower Annexin V signal than polymer only samples), whereas at 10 N/P apoptosis increases, due in part to the excess polymer in solution. This further reiterates that polyplexes and polymers enter the cell in a different fashion, interact with the membrane, and cause toxic side effects in alternative ways.
Cellular internalization of the polyplex formulations was determined by monitoring Cy5-labeled pDNA. The percent of Cy5 positive live cells (Figure S20a, Supporting Information) indicates that the synthesized delivery vehicles were generally quite effective at delivering the Cy5-labeled pDNA into the cells. Some interesting trends were noticed with these data. While poly(G46-b-P13) at 5 N/P was the poorest polyplex formulation to promote cell entry (25% Cy5-pDNA positive cells), the internalization was much higher at a higher N/P ratio (10 N/P) as 75% of HeLa cells were positive for Cy5-pDNA. For the analogous tertiary amine system, poly(G46-b-T26), polyplex internalization was very high at N/P 5 (∼90%) but lower at 10 N/P (43%); most of the cells positive for Cy5-pDNA were also found to be PI positive. All other polyplex formulations revealed high internalization percentages (80–90+ %) with the exception of JetPEI polyplexes (∼25%); this polymer was also found to be highly toxic, and cells positive for Cy5 were also PI positive.
It is generally thought that genetic cargo mostly enters the nucleus during mitosis when the nuclear membrane disassembles; however, it has been shown in previous research that polymers that induce membrane permeability also have higher expression efficiencies.49 Previous work by our group demonstrated that PEI polyplexes induced plasma membrane permeabilization within half an hour of transfection and nuclear membrane permeabilization by 4 h post-transfection; this led to apoptosis and an increase in cellular toxicity/death but also appears to increase gene expression.49 Knowing that the tertiary amine causes the plasma membrane to destabilize (and here it is also linked to toxicity), it was thought that the polymers containing the tertiary amines may also have higher delivery efficiency/gene expression. To test this hypothesis, HeLa cells were transfected with polyplexes formulated with pDNA containing the firefly luciferase gene. It was observed (Figure 7) that the poly(G45-s-P35), poly(G47-s-P28-s-T18), poly(G46-b-P8-b-T9), and poly(G46-b-P6-b-T17) all revealed relatively high gene expression. Because of high membrane permeability, it was expected that poly(G46-b-T26) would have revealed higher expression; however, only half of the cells survived the transfection assay (MTT assay, Figure 4a). The two triblock polymers, poly(G46-b-P8-b-T9) and poly(G46-b-P6-b-T17), had high gene expression, likely because these polymers are nontoxic and may contain a slightly lower fraction of tertiary amines (to aid in permeabilizing cell membranes). It was surprising to find that poly(G45-s-P35) had a much higher expression profile than poly(G62-s-T23). While we currently do not understand this trend, we speculate that the statistical copolymer composed of only tertiary amine charges, poly(G62-s-T23), may dissociate before the polyplex can traffic to the nucleus. For a similar reason, this could be why the statistical copolymer made with only primary amines, poly(G45-s-P35), had higher gene expression than the block copolymer analogue, poly(G46-b-P13). Similar to previous work by Ahmed and Narain,19 we have found that spreading the charge throughout the polymer in a statistical fashion can lead to increased gene expression (particularly with primary amine charges). We conclude that the incorporation of tertiary amines in cationic polymer vehicles does promote higher gene expression, due to their ability to permeabilize cell membranes. However, incorporating a large fraction of tertiary amines leads to an increase in cytotoxicity, apoptosis, and cell death. Thus, the composition of amine types on this vehicle class should be balanced by including mostly primary amines that facilitate stable polyplex formation and are more benign to the cell.
Figure 7.
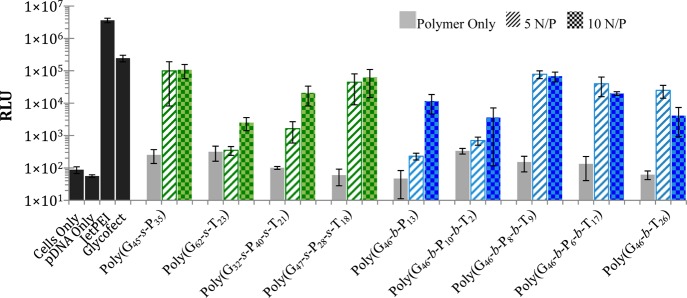
Luciferase gene expression measured 48 h post-transfection in HeLa cells. Luminescence measured by a BioTek plate reader. RLU is the relative light units. Error bars are the standard deviation of three replicates.
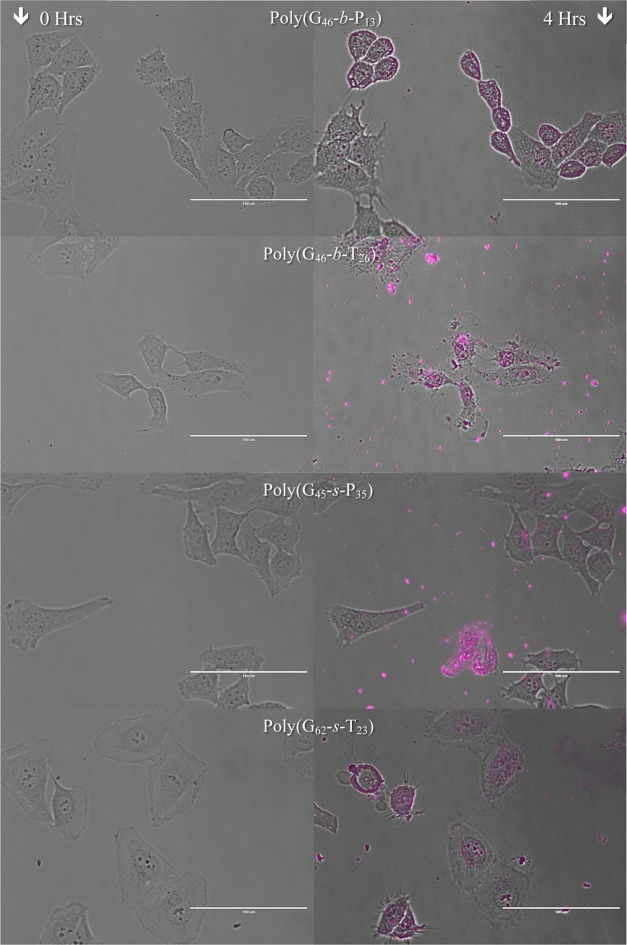
To monitor cells during the transfection process, selected polyplexes formulated with Cy5-pDNA were added to cultured HeLa cells and imaged for 4 h (with the exception of Jet-PEI transfection, which was imaged for 1.5 h due to severe toxicity and cell death by this time). The images were compiled into time-lapse videos to visualize cell behavior and morphology during this time period (Figure 8 shows the DIC image at t = 0 and an overlay of the DIC and Cy-5 channel images at 4 h; time-lapse movie files are available in the Supporting Information). In Figure 8 and the movie files, the toxicity of some formulations was clearly evident. For cells exposed to JetPEI polyplexes, all cells appeared to be under severe stress as early as 30 min post-transfection (the cells start blebbing, and the cells shrink/shrivel up; movie S1, Supporting Information).50 When the Cy5 channel was observed, the polyplexes appeared to interact with the cell membrane, the cytoplasm, and the nucleus (Figure S26, Supporting Information). Of the polymer vehicles synthesized for this study, the most toxic formulation appeared to be poly(G46-b-T26), which agrees with the MTT (Figure 4), 7-AAD, and Annexin V assays (Figures 5, 6, S23, and S24, Supporting Information). After 4 h, almost all of the cells appeared to have polyplexes within or on the cell surface, and most of the cells appear dead (severely shriveled/lysed; Figure 8 and movie S2, Supporting Information). Similarly, poly(G62-s-T23) also caused the cells to bleb and shrivel (Figure 8 and movie S3, Supporting Information). Cells exposed to poly(G46-b-P13) polyplexes did not appear to bleb (similar to previous toxicity studies); however, a slight decrease in cell volume was noted (Figure 8 and movie S4, Supporting Information). The formulation with poly(G45-s-P35) did not appear toxic to cells over the 4 h time course of this experiment (Figure 8 and movie S5 (Supporting Information); no blebbing or decrease in cell volume was noticed even though polyplexes were clearly internalized within cells).
Figure 8.
Microscopy images taken at the time polyplexes were added and 4 h post-transfection for selected formulations. Purple overlay on the second column is fluorescence microscopy taken at 628 nm. The scale bar represents 100 μm.
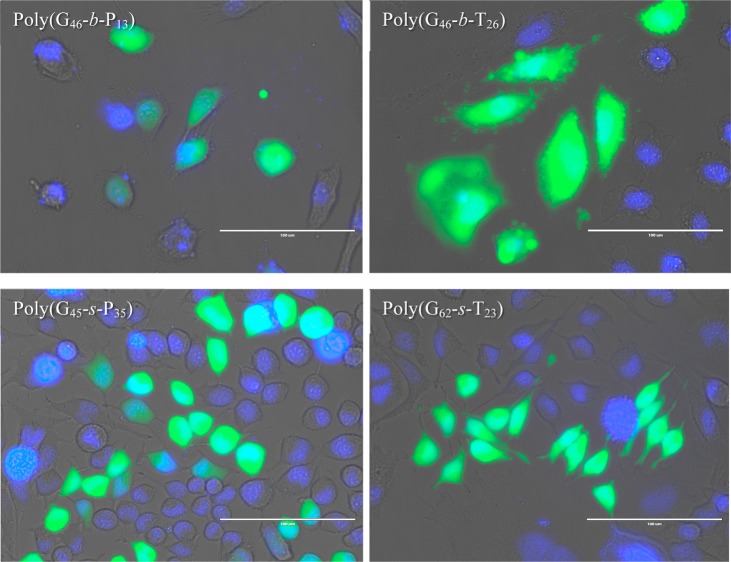
Cells were also transfected with a plasmid encoding GFP and imaged 48 h post-transfection at 350 and 470 nm to visualize cells positive for gene expression (Figure 9) with selected polyplex formulations. Transfected cells were viewed under 470 nm wavelength light 48 h post-transfection (Figure 8). It can clearly be seen that cells were positive for GFP expression in all cases and that a fraction of the population did not exhibit GFP expression. From the image, it can also be noticed that cells transfected with poly(G46-b-P13) appeared to have a lower intensity of GFP, whereas poly(G46-b-T26) promoted higher expression levels. However, the difference in cell morphology supported the toxicity trend noticed in Figure 8; cells transfected with poly(G46-b-T26) appeared larger/swollen with blebs and vesicles surrounding the cells.
Figure 9.
Microscopy images taken at 48 h post-transfection of HeLa cells that were transfected with a plasmid encoding GFP with selected polymers. The fluorescence microscopy images were taken at 350 nm (DAPI) and 470 nm (GFP expression). The scale bar represents 100 μm.
Conclusions
In an effort to find the right balance among nucleic acid uptake, toxicity, membrane permeability, and gene expression, we have synthesized and characterized a family of nine polymers containing a variety of compositions using MAG, AEMA, and DMAEMA monomers. The polymers were similar in length, while the ratio of primary to tertiary amines was varied along with the composition to compare block versus statistical polyplex formulations. The polyplexes made with statistical copolymers flocculated in culture media (observed via DLS) over time but were stable in water. The triblock polymers generally flocculated over time; however, the triblock formulation with the composition poly(G46-b-P10-b-T2) was the most stable of the triblocks. The diblock formulations with poly(G46-b-P13) were completely stable in culture media over the experimental time course. It was apparent that the tertiary amine-containing systems were more toxic than the systems containing only primary amines, and it was found that the presence of the tertiary amines could permeabilize cell membranes. This phenomenon was further investigated by staining transfected cells with an apoptotic marker, Annexin V, and a DNA intercalating molecule (7-AAD). Cells exposed to polymers containing tertiary amines were permeable to 7-AAD, and formulations containing a higher ratio of tertiary amines allowed cellular internalization of some Annexin V, thus indicating that these formulations promote cell membrane permability and toxicity at the higher tertiary amine ratios. As a result, these polymers exhibited higher gene expression levels; however, polymers with the highest tertiary amine ratios resulted in very high toxicity. The terpolymer with a high primary amine and very low tertiary amine ratio [poly(G46-b-P10-b-T2)] overall yielded the optimal combination of forming colloidally stable polyplexes that had high cellular uptake and low toxicity while still retaining high levels of gene expression. Overall, we conclude that there is a delicate balance between higher uptake and transgene expression (caused by membrane disruption) and an increase in toxicity (from membrane destabilization). It appears that triblock copolymers containing longer blocks of both carbohydrate (MAG) and primary amine (AEMA) units with a small block of tertiary amine (DMAEMA) moieties offer a potential platform to further optimize vehicles for in vivo examination.
Acknowledgments
We thank Dr. Nilesh Ingle and Karen Grinnen for assistance with biological assays, and Swapnil Tale and Yaoying Wu for helpful scientific discussions. This project was funded by the National Institutes of Health (NIH) program (1 DP2 OD00666901).
Supporting Information Available
NMR spectra of polymers, SEC chromatograms of the polymers, reactivity ratio NMR overlay, pKa comparison between the monomers and polymers, gel electrophoretic shift assays, zeta potential, cell viability (- PI % from FACS), flow cytometry diagrams, histograms from flow cytometry data, microscopy images of cells treated with JetPEI polyplexes, zeta potential, and a table of the DLS results. This material is available free of charge via the Internet at http://pubs.acs.org.
The authors declare no competing financial interest.
Funding Statement
National Institutes of Health, United States
Supplementary Material
References
- Lollo C. P.; Banaszczyk M.; Chiou H. Curr. Opin. Mol. Ther. 2000, 2, 136–142. [PubMed] [Google Scholar]
- DeMuth P. C.; Min Y.; Huang B.; Kramer J. A.; Miller A. D.; Barouch D. H.; Hammond P. T.; Irvine D. J. Nat. Mater. 2013, 12, 367–376. [DOI] [PMC free article] [PubMed] [Google Scholar]
- Bagley J.; Iacomini J. Gene Ther. 2003, 10, 605–611. [DOI] [PubMed] [Google Scholar]
- Sizovs A.; McLendon P. M.; Srinivasachari S.; Reineke T. M. Top. Curr. Chem. 2010, 296, 131–190. [DOI] [PMC free article] [PubMed] [Google Scholar]
- Halama A.; Kulinski M.; Librowski T.; Lochynski S. Pharmacol. Rep. 2009, 61, 993–999. [DOI] [PubMed] [Google Scholar]
- van Gaal E. V. B.; Oosting R. S.; Hennink W. E.; Crommelin D. J. A.; Mastrobattista E. Int. J. Pharm. 2010, 390, 76–83. [DOI] [PubMed] [Google Scholar]
- Boussif O.; Lezoualc’h F.; Zanta M. A.; Mergny M. D.; Scherman D.; Demeneix B.; Behr J. P. Proc. Natl. Acad. Sci. U.S.A. 1995, 92, 7297–7301. [DOI] [PMC free article] [PubMed] [Google Scholar]
- Neu M.; Fischer D.; Kissel T. J. Gene Med. 2005, 7, 992–1009. [DOI] [PubMed] [Google Scholar]
- Bettinger T.; Carlisle R. C.; Read M. L.; Ogris M.; Seymour L. W. Nucleic Acids Res. 2001, 29, 3882–3891. [DOI] [PMC free article] [PubMed] [Google Scholar]
- Fischer D.; Li Y.; Ahlemeyer B.; Krieglstein J.; Kissel T. Biomaterials 2003, 24, 1121–1131. [DOI] [PubMed] [Google Scholar]
- Braun C. S.; Vetro J. A.; Tomalia D. A.; Koe G. S.; Koe J. G.; Middaugh C. R. J. Pharm. Sci. 2004, 94, 423–436. [DOI] [PubMed] [Google Scholar]
- Alidedeoglu A. H.; York A. W.; McCormick C. L.; Morgan S. E. J. Polym. Sci., Part A: Polym. Chem. 2009, 47, 5405–5415. [Google Scholar]
- Morse A. J.; Dupin D.; Thompson K. L.; Armes S. P.; Ouzineb K.; Mills P.; Swart R. Langmuir 2012, 28, 11733–11744. [DOI] [PubMed] [Google Scholar]
- Christie R. J.; Evans C. C.; Nishiyama N.; Zasadzinski J.; Kataoka K. Endocrinology 2010, 151, 466–473. [DOI] [PubMed] [Google Scholar]
- Richard I.; Thibault M.; De Crescenzo G.; Buschmann M. D.; Lavertu M. Biomacromolecules 2013, 14, 1732–1740. [DOI] [PubMed] [Google Scholar]
- Paslay L. C.; Abel B. A.; Brown T. D.; Koul V.; Choudhary V.; McCormick C. L.; Morgan S. E. Biomacromolecules 2012, 13, 2472–2482. [DOI] [PubMed] [Google Scholar]
- Ahmed M.; Narain R. Prog. Polym. Sci. 2013, 38, 767–790. [Google Scholar]
- Tranter M.; Liu Y.; He S.; Gulick J.; Ren X.; Robbins J.; Jones W. K.; Reineke T. M. Mol. Ther. 2012, 20, 601–608. [DOI] [PMC free article] [PubMed] [Google Scholar]
- Ahmed M.; Narain R. Biomaterials 2011, 32, 5279–5290. [DOI] [PubMed] [Google Scholar]
- McLendon P. M.; Fichter K. M.; Reineke T. M. Mol. Pharmaceutics 2010, 7, 738–750. [DOI] [PubMed] [Google Scholar]
- Voit B.; Appelhans D. Macromol. Chem. Phys. 2010, 211, 727–735. [Google Scholar]
- Ting S. R. S.; Chen G.; Stenzel M. H. Polym. Chem. 2010, 1, 1392–1412. [Google Scholar]
- Smith A. E.; Sizovs A.; Grandinetti G.; Xue L.; Reineke T. M. Biomacromolecules 2011, 12, 3015–3022. [DOI] [PubMed] [Google Scholar]
- Alhoranta A. M.; Lehtinen J. K.; Urtti A. O.; Butcher S. J.; Aseyev V. O.; Tenhu H. J. Biomacromolecules 2011, 12, 3213–3222. [DOI] [PubMed] [Google Scholar]
- Won Y.-Y.; Sharma R.; Konieczny S. F. J. Controlled Release 2009, 139, 88–93. [DOI] [PMC free article] [PubMed] [Google Scholar]
- Asha M.; Cao H.; Collin E.; Wang W.; Pandit A. Int. J. Pharm. 2012, 434, 99–105. [DOI] [PubMed] [Google Scholar]
- Samsonova O.; Pfeiffer C.; Hellmund M.; Merkel O. M.; Kissel T. Polymers 2011, 3, 693–718. [Google Scholar]
- Lim D. W.; Yeom Y. I.; Park T. G. Bioconjugate Chem. 2000, 11, 688–695. [DOI] [PubMed] [Google Scholar]
- Zhu C.; Jung S.; Si G.; Cheng R.; Meng F.; Zhu X.; Park T. G.; Zhong Z. J. Polym. Sci., Part A: Polym. Chem. 2010, 48, 2869–2877. [Google Scholar]
- Schmidt N.; Mishra A.; Lai G. H.; Wong G. C. L. FEBS Lett. 2010, 584, 1806–1813. [DOI] [PubMed] [Google Scholar]
- Yin L.; Dalsin M. C.; Sizovs A.; Reineke T. M.; Hillmyer M. A. Macromolecules 2012, 45, 4322–4332. [Google Scholar]
- Xu X.; Smith A. E.; Kirkland S. E.; McCormick C. L. Macromolecules 2008, 41, 8429–8435. [Google Scholar]
- Mayo F. R.; Lewis F. M. J. Am. Chem. Soc. 1944, 66, 1594–1601. [Google Scholar]
- Odian G.Principles of Polymerization, 4 ed.; John Wiley & Sons, Inc.: Hoboken, NJ, 2004; pp 464–543. [Google Scholar]
- Alfrey T.; Goldfinger G. J. Chem. Phys. 1944, 12, 205–209. [Google Scholar]
- Mosmann T. J. Immunol. Methods 1983, 65, 55–63. [DOI] [PubMed] [Google Scholar]
- Mayadunne R. T. A.; Rizzardo E.; Chiefari J.; Chong Y. K.; Moad G.; Thang S. H. Macromolecules 1999, 32, 6977–6980. [Google Scholar]
- Vasilieva Y. A.; Thomas D. B.; Scales C. W.; McCormick C. L. Macromolecules 2004, 37, 2728–2737. [Google Scholar]
- McCormick C. L.; Lowe A. B. Acc. Chem. Res. 2004, 37, 312–325. [DOI] [PubMed] [Google Scholar]
- Lee H.; Son S. H.; Sharma R.; Won Y.-Y. J. Phys. Chem. B 2011, 115, 844–860. [DOI] [PubMed] [Google Scholar]
- van de Wetering P.; Moret E. E.; Schuurmans-Nieuwenbroek N. M. E.; Van Steenbergen M. J.; Hennink W. E. Bioconjugate Chem. 1999, 10, 589–597. [DOI] [PubMed] [Google Scholar]
- Cherng J. Y.; van de Wetering P.; Talsma H.; Crommelin D. J.; Hennink W. E. Pharm. Res. 1996, 13, 1038–1042. [DOI] [PubMed] [Google Scholar]
- Rawlinson L.-A. B.; O’Brien P. J.; Brayden D. J. J. Controlled Release 2010, 146, 84–92. [DOI] [PubMed] [Google Scholar]
- van Engeland M.; Nieland L. J.; Ramaekers F. C.; Schutte B.; Reutelingsperger C. P. Cytometry 1998, 31, 1–9. [DOI] [PubMed] [Google Scholar]
- Dong H. P.; Holth A.; Kleinberg L.; Ruud M. G.; Elstrand M. B.; Tropé C. G.; Davidson B.; Risberg B. Am. J. Clin. Pathol. 2009, 132, 756–762. [DOI] [PubMed] [Google Scholar]
- Vermes I.; Haanen C.; Steffens-Nakken H.; Reutelingsperger C. J. Immunol. Methods 1995, 184, 39–51. [DOI] [PubMed] [Google Scholar]
- Andree H. A.; Reutelingsperger C. P.; Hauptmann R.; Hemker H. C.; Hermens W. T.; Willems G. M. J. Biol. Chem. 1990, 265, 4923–4928. [PubMed] [Google Scholar]
- Hong S.; Leroueil P. R.; Janus E. K.; Peters J. L.; Kober M.-M.; Islam M. T.; Orr B. G.; Baker J. R.; Banaszak Holl M. M. Bioconjugate Chem. 2006, 17, 728–734. [DOI] [PubMed] [Google Scholar]
- Grandinetti G.; Reineke T. M. Mol. Pharmaceutics 2012, 9, 2256–2267. [DOI] [PMC free article] [PubMed] [Google Scholar]
- Khmaladze A.; Matz R. L.; Epstein T.; Jasensky J.; Banaszak Holl M. M.; Chen Z. J. Struct. Biol. 2012, 178, 270–278. [DOI] [PubMed] [Google Scholar]
Associated Data
This section collects any data citations, data availability statements, or supplementary materials included in this article.


