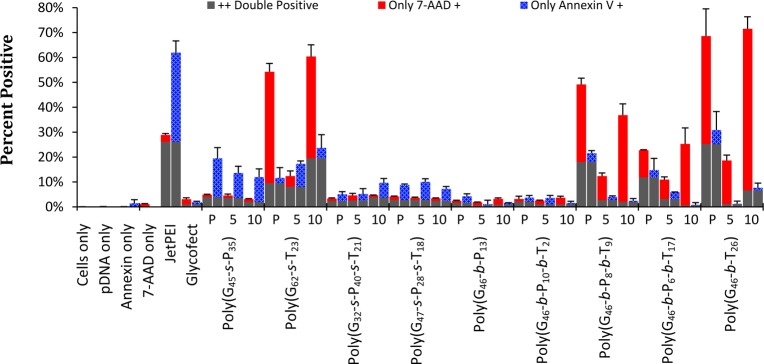
Figure 6.

Percentage of cells that are fluorescent for 7-AAD positive (height at the top of the red bar) and Annexin V positive (height of blue bar). Each sample is represented by two bars. Cells that are double positive (cells in Q2 in Figure 5) are depicted as gray bars. Red bars correspond to percent of cells in Q1 and blue bars to Q3 in Figure 5. P, 5, and 10 correspond to the polymer only sample, the 5 N/P sample, and the 10 N/P sample for each polymer listed below. Error bars are the standard deviation of the data collected in triplicate.
