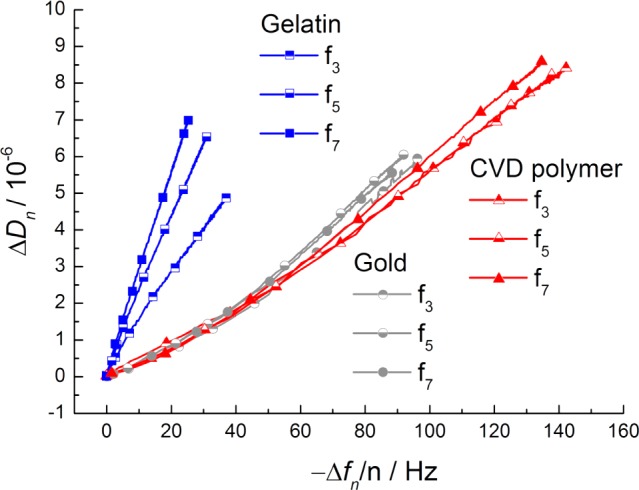
Figure 6.

ΔDn/(−Δfn) values during the adsorption process of Fbn on the gelatin-based hydrogel (blue shades; squares), on bare gold (gray shades; circles), and on the CVD polymer (magenta shades; triangles). The corresponding ΔDn/(−Δfn) plot for HSA is shown in the Supporting Information, Figure SI-3. For the sake of clarity, only the third, fifth, and seventh resonance frequencies are shown.
