Abstract
Poly(ethylene glycol) (PEG) hydrogels are highly biocompatible materials extensively used for biomedical and pharmaceutical applications, controlled drug release, and tissue engineering. In this work, PEG cross-linked hydrogels, synthesized under various conditions, were used to grow lysozyme crystals by the counterdiffusion technique. Crystallization experiments were conducted using a three-layer arrangement. Results demonstrated that PEG fibers were incorporated within lysozyme crystals controlling the final crystal shape. PEG hydrogels also induced the nucleation of lysozyme crystals to a higher extent than agarose. PEG hydrogels can also be used at higher concentrations (20–50% w/w) as a separation chamber (plug) in counterdiffusion experiments. In this case, PEG hydrogels control the diffusion of the crystallization agent and therefore may be used to tailor the supersaturation to fine-tune crystal size. As an example, insulin crystals were grown in 10% (w/w) PEG hydrogel. The resulting crystals were of an approximate size of 500 μm.
Short abstract
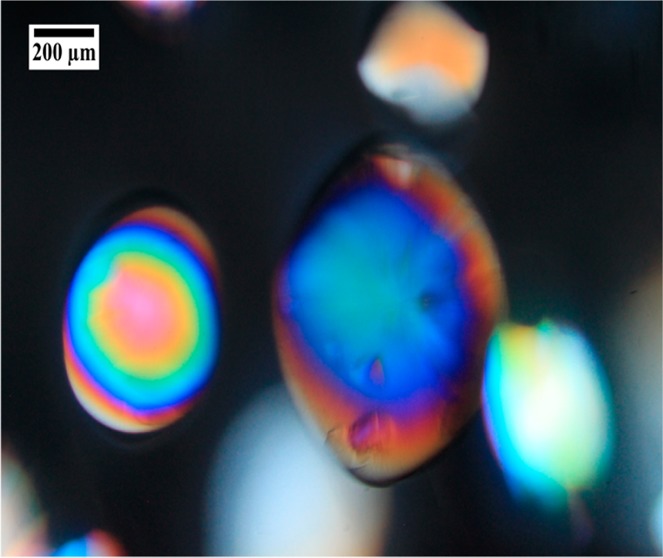
Lysozyme crystal grown in 10% PEG hydrogel showing a spherical shape.
Introduction
The use of polymeric materials in crystallization has a long history of success in producing high-quality crystals of substances such as inorganic and organic materials of low solubility. Silica gels, for example, are commonly used as polymeric materials in crystallization experiments,1 although PEO (poly(ethylene oxide))2 and polyacrylamide3 have also been explored in the search of organic solvent compatibility. In general, gels provide a convection-free environment, while avoiding sedimentation of the growing crystals, and, in combination with counterdiffusion setups, allow the search of a wide range of supersaturation values in a single experiment.4
Further experiments with other gels have been conducted and explored (Lorber et al. and refs herein)5 as crystallization media. Agarose gels, for example, are very effective in reducing convection even at low concentration values (0.12% w/v).6 These gels have also been found to be an effective filtering medium to reduce the incorporation of impurities.7,8 It has been shown that the use of agarose gels also improves crystal quality,5,9 while facilitating protein crystal manipulation, avoiding osmotic shock,10 and also serving as cryo-protectant.11 These attractive observations of increasing robustness of protein crystals occur mainly due to the incorporation of the gel fibers into the crystal lattice.12−14 The aforementioned phenomenon is being explored to produce composite protein–gel crystals with improved properties.14 Similar observations have been recently obtained for various inorganic crystals as well as gels of different nature.15,16 Polymers such as poly(ethylene oxide) and poly(vinyl alcohol),17 calcium alginate beads,9 or new synthetic polymers [poly(N-isopropylacrylamide-co-n-butyl methacrylate)] and hydrophilic polymer blocks [poly(ethylene glycol)]18 have also been tested for the crystallization of biological macromolecules. Gels may also serve as a buffer to control the supersaturation rate within crystallization experiments. Hughes and co-workers used the counterdiffusion technique in a three-layer configuration to produce large crystals of inorganic pyrophosphatase (IPPase) of millimeter size for neutron diffraction in capillaries of up to 2.0 mm inner diameter.19
PEG-based cross-linked hydrogels have been explored for many biological as well as biomedical applications including sensors and controlled drug delivery of macromolecules20 mainly due to their nontoxicity and non-immunogenicity.21 They are also known to protect peptides and proteins against enzyme degradation by the formation of conjugates.22−24 However, they have never been used before as crystallization media.
To date, PEG linear polymers have been employed mainly as crystallization agents in solution. They could also be a very effective medium to crystallize macromolecules due to their rigid structure and their capacity to reduce protein solubility. However, contrary to linear PEG polymers, PEG cross-linked hydrogels can be tailored to have a specific pore size as well as to incorporate other desired chemical moieties to modify the charge, etc. Therefore, the main aim of this work was to explore the feasibility of using cross-linked PEG-based hydrogels as crystallization media to grow protein crystals. Two types of studies were conducted: one focused on the investigation of the influence of the PEG hydrogel on the resulting size and morphology of the lysozyme-grown crystals in capillary counterdiffusion experiments, and the second focused on the investigation of the effect of pore size of the gel network on the nucleation and growth of lysozyme crystals in counterdiffusion experiments. The outcome of these experiments demonstrated that it is possible to obtain protein crystals with incorporated PEG hydrogel fibers. On the other hand, we demonstrated that the diffusion of the crystallization agent could be controlled, which may be exploited to obtain crystals of larger size for neutron diffraction.
Materials and Methods
Preparation of PEG Hydrogels
Poly(ethylene glycol) (PEG)-based hydrogels were prepared by mixing poly(ethylene glycol) monomethyl ether monomethacrylate (PEGMA) (Polysciences, Warrington, PA) with a molecular weight of 1100 Da (manufacturer reports the molecular weight of the product as 1000, which represents the average molecular weight of the PEG chain only, thus the 1100 includes the molecular weight of the methacrylate group) with the cross-linker poly(ethylene glycol) dimethacrylate (PEGDMA) (Polysciences, Warrington, PA) (MW 1200 Da). The monomer with the highest molecular weight was selected in order to have the longest tethered chains that could potentially interact with the protein. This monomer combination was photopolymerized using 1-hydroxycyclohexyl phenyl ketone (Aldrich Chemical Co., Inc., Milwaukee, WI) as the photoinitiator. A representation of the obtained polymer network is presented in Supporting Information Figure S1. Equimolar amounts of PEGMA–PEGDMA were dissolved in deionized water at the desired concentration (10, 20 35, 50% w/w) and mixed in a sonicator bath to help dissolution. The photoinitiator was then incorporated to reach a final concentration of 0.075% w/w. The prepolymeric solution was transferred to an amber vial and placed inside a sealed glovebox (Cole-Parmer, Vernon Hills, IL). At this point, the glovebox chamber is sealed (with one small exit to allow air to exit) and purged with nitrogen (99% pure). After the camera was purged for approximately 30 min, a syringe needle (20 gauge and several inches long depending on the size of the bottle) was located at the end of the tubing where nitrogen was released. The needle was then placed inside the monomer solution bottle (using a septum cap for the bottle makes things easier) making sure that the nitrogen pressure was reduced enough to create a very slow bubbling (with an additional needle to provide for air to escape and avoid bottle overpressure), which should be maintained for 20 min to remove oxygen, a free radical scavenger. Slow bubbling is very important as it prevents the solution from forming bubbles that will eventually be contained in the solid polymer. If proper removal of oxygen is not achieved, polymerization will not proceed accordingly. The monomer solution was then introduced within the proper container and exposed to a UV light source to initiate the polymerization (UV lamp 100 W mercury arc, EFO Acticure, Canada), at an intensity of 35 mW/cm2.
Mesh Size Determination
Equilibrium swelling studies were conducted to determine the mesh size distribution as a function of the final PEG gel composition. For this purpose, hydrogels were prepared as described in the previous section and introduced by capillarity between two microscope slides separated by a Teflon spacer of 1.5 mm thickness. Monomer mixtures (PEGMA and PEGDMA) were diluted to obtain the following compositions (10, 20, 35, and 50% w/w) and polymerized as described in the previous section.
Polymerization samples were cut in 9/16 in. diameter disks, and their volume, corresponding to the relaxed state (Vr), was determined using a heptane density kit (Vogayer Pro model VP114CN OHAUS Corporation, Pine Brook, NJ, USA). This technique simply uses the differences in weight of an unknown sample volume and uses the known density of a solvent, in this case heptane, to determine the desired volume. Heptane was used as solvent because it is hydrophobic, and therefore, PEG hydrogels do not swell (incorporate the solvent). For this purpose, discs were weighed in air (wa) and then in heptane (wh) to determine the relaxed state volume (Vr):25
| 1 |
where ρh is the known density of heptane. Samples were then kept in 15 mL of deionized water at 37 °C in a water bath for 3 days. The deionized water was replaced several times to remove any unreacted monomers. The resultant volume of the samples was measured as described above. This volume corresponds to the swollen state (Vs). Finally, the membranes were dried under vacuum until no further changes in weight were observed. The volume of the dried samples was then measured (Vd) using the aforementioned heptane density protocol. The measured volumes can now be correlated to the volume fraction of polymer in the relaxed and swollen states (v2,r,v2,s) as described by26
| 2 |
| 3 |
With this information, the molecular weight between cross-links, M̅c, was calculated using eq 4.27 Because M̅n is expected to be large, given the high molecular weight of the monomer and the high reactivity of acrylate groups, the term 2/M̅n was neglected.
 |
4 |
Here, v̅ is the specific volume of the polymer (0.898 cm3/s), V1 is the molar volume of water (18 cm3/mol), χ1 is the Flory polymer–water interaction parameter (0.426 for PEG–water), λ is the number of links after polymerization, 2 for vinyl polymers, and Mr is the molecular weight of the monomer (1100 Da). The equation was solved by iteration using MathCAD (PTC version 15). The value of M̅c was then replaced into eq 5 to determine the mesh size (ξ).28
| 5 |
The statistical analysis of the results was performed using Minitab 15. Single comparisons were made using the unpaired Student’s t test. Analysis of variance (ANOVA) followed by Tukey’s post hoc test was used for data sets with multiple comparisons. A value of p < 0.05 was considered significant.
Estimation of the Diffusion Coefficient by Mach–Zehnder Interferometry
A two-layer configuration system was used to estimate the diffusion coefficient by Mach–Zehnder interferometry. The experimental cassette was made by separating two glass plates (8 × 4 cm) with a Teflon frame of 2.4 mm thickness sandwiched between the glass plates with vacuum grease to prevent solution filtration from the plates. The border was sealed with bee wax, leaving a hole for the injection of the solution. Three different PEG hydrogel matrices were prepared following the aforementioned protocol, filling the 50% of the volume of the cassette. After polymerization, the cassette was placed in the sample arm of the Mach–Zehnder interferometer and filled with an agarose sol (0.5% w/v) containing 1.7 M NaCl. The change in the refraction index, which is proportional to local concentration, was followed every 12 s for 2 h.
A phase-shift Mach–Zehnder interferometer (PS-MZI) based on wavelength modulation was used for this purpose, following a scheme similar to the one reported by Ischii.29,30 In a Mach–Zehnder experiment, a laser beam is split into a reference and a sample beam. The sample beam propagates through the experimental volume before recombining with the reference beam. This results in the generation of interference fringes (interferogram) at the imaging plane. The interferogram carries the information on the optical path variation between the varying sample beam and the still reference beam. Therefore, the instrument delivers a map of relative refraction index variations, calculated from a set of five phase-shifted images.
For this type of measurement, a discrete form of Fick’s second law can be used in order to estimate the diffusion coefficient from the interferometric phase:
| 6 |
where α is a coefficient relating the refraction index to concentration and ∇2 stands for the discrete Laplacian operator. With this description, Fick’s law can be verified in a well-known time and space grid and does not require the a priori knowledge of starting and boundary conditions nor is it necessary to define the refraction index–concentration coefficient, α, and therefore it provides local estimates. Only a set of two refractive index variation images taken at different times ti and ti+1 are required. The complete description of this theoretical implementation will be published elsewhere.
Protein Crystallization Experiments
Lysozyme from hen egg white (HEWL) (>90% purity), insulin from bovine pancreas (>90% purity), sodium phosphate dibasic, Tris hydrochloride, sodium chloride, acetic acid glacial, and sodium acetate were purchased from Sigma-Aldrich (St Louis, MO). Agarose, with Tf = 78 °C and Tg = 24 °C, and the Granada crystallization box (GCB) were purchased from Hampton Research (34 Journey Aliso Viejo, CA). Protein and crystallization solution were prepared in 50 mM sodium acetate buffer pH 4.5, filtered (0.22 and 0.45 μm, respectively), and stored at 4 and 20 °C, respectively. Protein concentration was determined spectrophotometrically at 280 nm using a molar extinction coefficient of 2.66 and 1.06 cm–1 mL mg–1 for lysozyme and insulin, respectively, with a Power Wave Biotek Instruments spectrophotometer (Highland Park, Box 998, Winooski, VT, serial no. 143379).
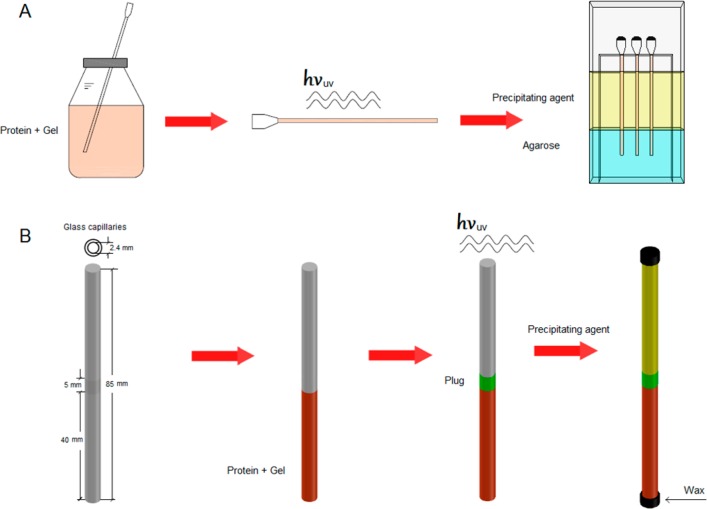
Counterdiffusion experiments were set up using two configurations, the gel acupuncture method (GAME) with capillaries of different diameters (from 0.1 to 0.8 mm) and the three-layer configuration (3L) using capillaries of 2.5 mm inner diameter (Figure 1).
Figure 1.
Experimental setups. (A) For the GAME configuration, the protein is mixed with the PEG hydrogel and polymerized prior to the introduction of the capillary in the agarose gel. (B) For the 3L configuration, the protein–agarose or the protein–PEG (prepolymeric) solution is first loaded (first layer). For the latter, the protein–PEG solution was subjected to UV treatment to induce the polymerization. This was followed by the gentle addition of the prepolymeric solution of PEG (20, 35, or 50% w/w concentrations), which was also polymerized by UV exposition (second layer or plug). The last step in both experimental setups is the addition of the crystallization solution (third layer).
GAME experiments (Figure 1A) were used to study the influence of PEG hydrogel on the nucleation and growth of lysozyme crystals. Briefly, an agarose layer at 0.4% (w/v) concentration was prepared by dissolving the right amount of agarose in the sodium acetate buffer, warmed to 90 °C, poured into the GCB, and allowed to cool. The PEG–protein mix was prepared following the described protocol but using a solution of 40 mg/mL of lysozyme as the solvent in the prepolymeric solution. Three different PEGMA–PEGDMA hydrogels were prepared at 5, 7, and 9% (w/w). The resulting mixture was loaded into 0.8 mm inner diameter capillary within the glovebox and exposed to the UV light. The capillaries were punctured in agarose gel to a depth of approximately 10 mm. The precipitant, 1.75 M NaCl in 50 mM sodium acetate buffer pH 4.5, was added and the box externally sealed with parafilm. A similar protocol was followed to set up the insulin crystallization experiments. The prepolymeric mixture consisted of insulin at 20 mg/mL and PEG monomers. These were loaded in 0.8 mm inner diameter capillaries and subsequently illuminated with UV light. The capillaries containing the entrapped insulin was punctured in 0.2% (w/v) agarose layer and crystallized by adding 0.5 M sodium phosphate dibasic in 0.1 M Tris/HCL pH 9.0.
The 3L experiments (Figure 1B) were prepared in tubes of 2.4 mm inner diameter to (i) study the influence of the PEG-based gel on the nucleation and growth of lysozyme crystals and (ii) to study the influence of the mesh size of the plug (second layer) on the development of the counterdiffusion pattern by following the nucleation front.
In the first case, experiments in 3L configuration were designed to complement the results obtained with the GAME setup. PEGMA–PEGDMA hydrogels were prepared at a polymer concentration of 10% (w/w) dilution using a lysozyme solution at 40, 50, or 60 mg/mL as solvent. The prepolymeric solution was loaded into each tube (2.4 mm diameter) until it reached a height of 40 mm from the bottom (first layer: protein chamber). The tube was exposed to a UV source as previously described. Then, a layer of 5 mm of PEG (50% w/w dilution) hydrogel was poured on top of it and polymerized under the UV source (second layer: plug). This procedure was performed with the first layer covered with aluminum foil to avoid any unnecessary exposure.
Similar experiments were conducted with agarose. In this case, agarose sol was prepared at 0.4% (w/v) and kept at around 35–40 °C. The sol was mixed in a volume ratio of 1:1 with previously prepared protein solutions at 80, 100, and 120 mg/mL that resulted in 40, 50, and 60 mg/mL final protein concentrations, respectively. The agarose/protein solution was allowed to settle until a protein chamber with 0.2% (w/v) of agarose was obtained. Then the PEG (50% w/w) plug was polymerized as described above. Finally, the crystallization solution (1.75 M NaCl in 50 mM sodium acetate buffer pH 4.5) was added on top of the PEG plug layer to fill up the additional 40 mm, which constitutes the precipitant chamber (third layer), to both sets of experiments (PEGs and agarose).
In the second study (influence of the mesh size), the protein chamber was filled with 70 mg/mL lysozyme concentration gelled with either 10% (w/w) PEG hydrogel or 0.2% (w/v) agarose. Then the second layer, 5 mm, was prepared using PEG at three different concentrations, 20, 35, and 50% (w/w). Finally, the crystallization solution was added to the samples.
In all cases, the addition of the crystallization solution layer was taken as the starting point. Experiments were followed by measuring the observable advancement of the nucleation front at 24 h intervals with the help of a microscope (see Figure S2). Each experiment was repeated three times, and the results were analyzed for any statistical deviation. The nucleation front rate was obtained from the slope of the linear curve fitting to the front position versus the square root of time.31 Although it is not very accurate, this observable nucleation front position allows us to compare the evolution of each experiment.
X-ray Diffraction
X-ray data were collected at room temperature from gel grown crystals using the 3L configuration. Crystal were extracted from the tube and mounted in capillaries of 0.7 mm inner diameter for room temperature data collection. Diffraction data were recorded on a Bruker Smart 6000 CCD detector with Kappa configuration (X8 Proteum) using Cu K radiation from a Bruker Microstar microfocus (Montel Optics) rotating-anode generator operated at 45 kV and 60 mA. All data were collected following identical protocol. A total of 270 frames were recorded with 30 s exposure time per frame taking for each degree of oscillation and a crystal-to-detector distance of 40 mm. Integrated intensity information was obtained for each reflection, scaled with SAINT and corrected for absorption with SADABS from the PROTEUM software suite (Bruker AXS Inc.). B factors were obtained from the Wilson plot representation carried out with Truncate of the CCP4 suite.32
Results and Discussion
Parameters That Control the Evolution of Counterdiffusion Experiments
In counterdiffusion experiments, there are a number of parameters that can be modified to control the evolution of the supersaturation, provoking the precipitation/crystallization of the protein within the capillary.33,34 Protein and crystallization agent concentrations could be the first choice, but this implies that either the final equilibrium concentration cannot be fixed (if crystallization agent is tuned) or that protein concentration will have to be increased (if the crystallization agent is maintained at a constant concentration). In order to start with similar chemical conditions, we have to modify some physical properties of the system as deduced form the Grashof number.34,35
| 7 |
where L is the characteristic length of the system (cm) (i.e., the capillary diameter or the pore size of the gel), βl is the solutal expansivity (cm3/mg), Δc is the concentration difference, g is gravity (cm/s2), and v is the kinematic viscosity (cm2/s). The simplest and effective way to reduce GrN would be to modify L, which in our case is the inner diameter of the capillary or the pore size of the gel. If the diameter of the capillary is altered, we will also be changing the protein volume and, as a consequence, the initial precipitant concentration would have to be adapted. For capillaries with a diameter larger than 0.2 mm, the contribution of convection to mass transport increases. In these cases, the protein solution may be gelled to keep the experiment under a diffusion mass transport scenario. This analysis motivated us to investigate a second option, that is, the control of the evolution of the supersaturation within a counterdiffusion experiment by controlling the pore size of the gel matrix used in the plug. This could be a simple way to avoid any possible downside effect due to the protein–gel interaction.5,35
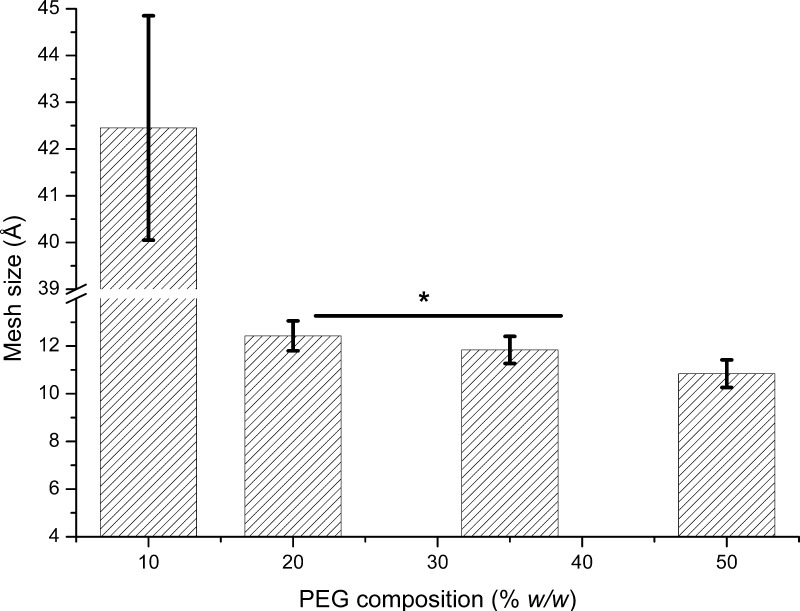
To evaluate all feasible operational conditions, we first determined the mesh size (ξ) of the proposed hydrogels at different synthesis conditions. Changes in the mesh size were obtained by adjusting the monomer dilution ratios and calculated according to eq 4. Figure 2 illustrates the values of the mesh size for each polymer composition.
Figure 2.
Determination of the mesh size of various PEG plug compositions employed to control diffusion of the crystallization agent, obtained by equilibrium swelling theory. Error bars represent standard error of the mean of the mesh size (n = 4 for 10%, n = 9 for 20%, n = 8 for 35%, and n = 8 for 50% PEG composition). Statistical differences are considered when p < 0.05; *p > 0.5 for 20 and 35%.
The values of the mesh sizes calculated from swelling data indicated a reduction of the pore size as the concentration of the monomer in the prepolymeric solution increases. Although it is understood that other methods can be applied to change a hydrogel’s mesh size (for example, cross-linker concentration), for this particular polymer configuration (PEGMA with a PEG chain containing 23 units and PEGDMA also with PEG chains of 23 units), it was found that using a decreased amount of cross-linker under similar dilution conditions did not yield a mechanically stable hydrogel (data not shown). Therefore, for this particular application, the cross-linker concentration was maintained constant at 50% molar ratio. This method of controlling the mesh size has been previously used by Torres-Lugo and Peppas who demonstrated that the mesh size can also be controlled by varying the dilution ratio.36 Thus, our experiments were conducted maintaining a constant monomer/cross-linker (PEGMA/PEGDMA) ratio, only varying the dilution ratio to tune the final gel pore size.
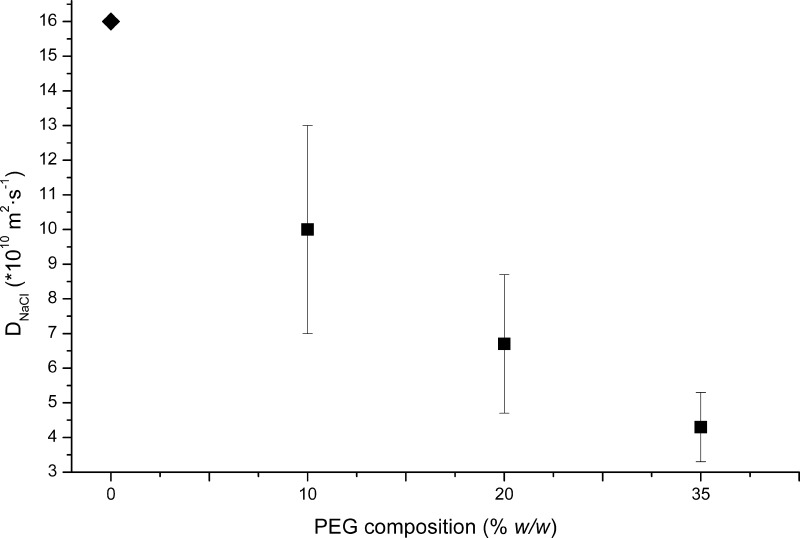
Experimental results indicate that mesh size values varied from approximately 42 to 10 Å for 10 to 50% (w/w) composition, respectively. Moreover, the mesh size values for those hydrogels with 20–35% PEG composition did not show any significant statistical differences. In our case, the difference in dilution between these two compositions may be too small and measurements could fall within the margin of error of the experimental protocol. However, the general trend observed is that when the monomer concentration in the prepolymeric solution is reduced, there is an increase of mesh size. The effects of these differences in the diffusion coefficient were evaluated by Mach–Zehnder interferometer (Figure 3). A clear effect on the estimated diffusion coefficient of NaCl was observed for all polymer compositions.
Figure 3.
Estimates of the diffusion coefficient of NaCl in cross-linked PEG-based hydrogels of different compositions obtained by PS-MZI compared with the free water value (diamond). Error bars show 95% confidence.
These results indicated that the diffusion coefficient changes depending on the hydrogel structure. Even though the mesh size estimation for PEG at 20 and 35% was not statistically different, it is clear that the diffusion of sodium chloride is controlled by the pore size of the gel matrices. Therefore, we may conclude that it is possible to tune the development of supersaturation by controlling the diffusion of the crystallization agents without modifying the chemical composition of neither the crystallization solution nor the protein solutions.
Effect of the Pore Size of PEG Hydrogel on the Evolution of Counterdiffusion Experiments
The influence of the plug–gel pore size in the development of supersaturation in 3L counterdiffusion experiments was investigated by measuring the advancement of the nucleation front as a function of time. In this setup, the protein chamber (70 mg/mL) was gelled with agarose (0.2% w/v). The precipitant diffusion was controlled by varying the pore size of the second layer (plug of 5 mm) by employing PEG hydrogels of increasing concentration. Protein and precipitant chambers were 40 mm in length (see Figure 1).
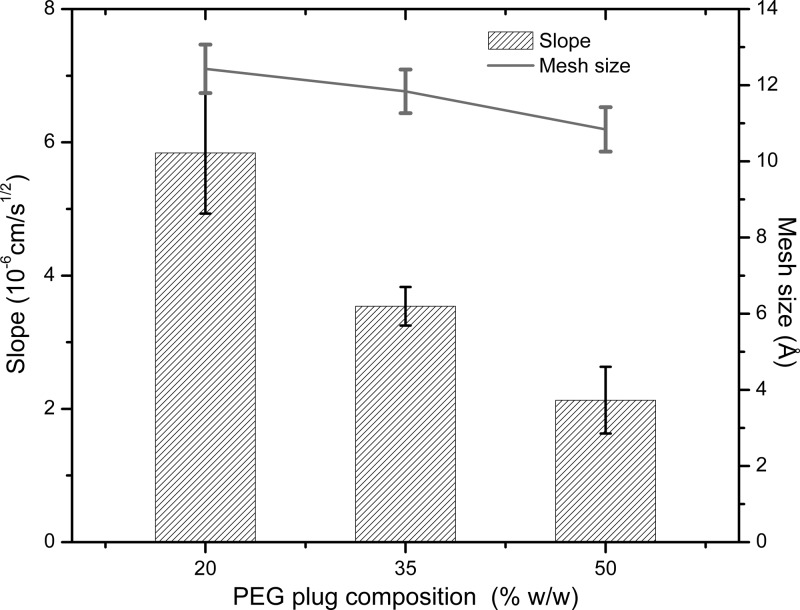
The nucleation process began approximately 12 h after the addition of the crystallizing agent. All experiments demonstrated a typical counterdiffusion pattern, with high nucleation density near the plug, which decreases along the protein chamber, resulting in a lower number of crystals of larger size at the end of the tube. The advancement of the nucleation front was measured with respect to time. The nucleation front position was plotted against the square root of time, and in all cases, it produced linear trends, which indicated that the transport of the crystallization agent was dominated by passive diffusion following Fick’s second law.31 Therefore, the slope of the linear curve fitting is a measure of the rate at which the nucleation front is moving along the protein chamber. The results depicted in Figure 4 illustrate the nucleation front rate along the protein chamber, that is, the slope of the linear curve fit, as a function of gel concentration (pore size). As expected, the nucleation rate decreased as the gel–plug concentration increased. Although in all cases crystals of millimeter size were obtained at the end of the protein chamber, results indicated that the 50% (w/w) dilution PEG hydrogel plugs rendered crystals slightly larger when compared to experiments with 20 or 35% (w/w) plugs (Figure S3).
Figure 4.
Slope of the linear curve fit to the nucleation front position vs the square root of time, for each PEG plug composition (gel pore size is indicated in the right axes). This slope is a measure of the nucleation front rate in 3L counterdiffusion experiments. Error bars for the slope represent a 95% confidence interval. Error bars for the mesh size represent one standard deviation from the average value.
Influence of the PEG Hydrogel on the Size and Morphology of the Lysozyme-Grown Crystals
We have also evaluated the compatibility of PEG hydrogels as potential crystallization media for protein crystallization experiments. For these studies, we used the 3L and the GAME configurations (see description in the Materials and Methods). In previous experiments, we learned that gel concentrations higher than 10% impeded crystal growth, and therefore, all experiments were performed using a maximum of 10% (w/w) polymer concentration in the protein chamber. The lowest dilution (5% w/w) was determined as the concentration where a solid polymeric structure could be obtained. Therefore, these experiments were conducted with polymers synthesized with monomer concentrations between 5 and 10% (w/w).
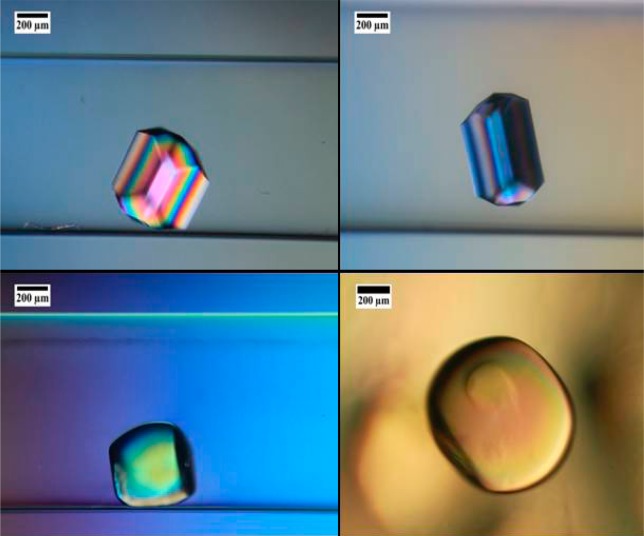
Lysozyme crystals were successfully grown in 0.8 mm capillaries in the presence of PEG hydrogels at different polymer concentrations (i.e., degrees of monomer dilutions prior to polymerization). A monomer solution containing a 1:1 molar ratio of monomer and cross-linker was further diluted with the appropriate protein solution to obtain a monomer concentration ranging from 5 to 10% (w/w). Crystals grown at 5 and 7% hydrogel concentration showed the typical shape of lysozyme crystals composed of prismatic (110) and pyramidal (001) faces, while at 9% (w/w), crystals showed a rounded shape that became almost spherical at 10% (w/w) (Figure 5).
Figure 5.
Lysozyme crystals grown at constant temperature in PEG hydrogels with different polymer compositions: 5% (w/w) (top left), 7% (w/w) (top right), 9% (w/w) (bottom left), and 10% (w/w) (bottom right).
Similar observations have already been reported for lysozyme and thaumatin crystals grown in silica gels.12,14 This morphological transition can been explained as the coupling of the “Berg effect”37 (i.e., the concentration at the corners and edges of a growing crystal is higher than that at the center of the faces; therefore, the supersaturation is higher at the corners than at the center of the face, which means that the edges grow more than the other regions and the polyhedron shape is lost), as a consequence of the depletion zone generated during crystal growth in gel media, and the loss of the energetic anisotropy of growing faces at higher gel concentrations.14 Protein crystals grown in gelled media are able to incorporate gel fibers during their growth.6,12−14 The incorporation of gel fibers into the crystal have been pointed as the principal source for the loss of face anisotropy due to the homogenization of the surface energy.13,14 The incorporation of PEG hydrogel fibers was analyzed by a dissolution experiment of a lysozyme crystal grown at 9% (w/w). When the supersaturation is lowered, the lysozyme molecules abandon the crystal surface, making visible the gel skeleton (Figure S4). As in the case of agarose and silica gels, PEG hydrogel-grown crystals are composite materials containing both the hydrogel and the protein molecules.
Even though protein crystals incorporate the PEG hydrogel, it does not seem to affect crystal quality. To confirm this, we have compared lysozyme crystals grown in 10% (w/w) PEG hydrogel with crystals grown in 0.2% (w/w) agarose. Data sets were collected under identical conditions (i.e., number of frames, exposition time, etc.), and the quality was evaluated from standard parameters.38 Besides the typical small differences that can be found between different specimens, all crystals diffracted similarly to the resolution of 1.85 Å limited by the used data collection configuration producing similar statistical values (Table 1 and Figure S5).
Table 1. X-ray Data Collection Statistics for Lysozyme Crystals Grown in 10% (w/w) PEG Hydrogel and in 0.2% (w/v) Agarose Gel by the 3L Counterdiffusion Method (Numbers in Parentheses Indicate the Statistics for the High-Resolution Shell).
| PEG hydrogel | agarose gel | |||||
|---|---|---|---|---|---|---|
| crystal size (mm3) | 0.21 × 0.0.202 | 0.22 × 0.152 | 0.21 × 0.202 | 0.48 × 0.252 | 0.38 × 0.222 | 0.54 × 0.182 |
| space group | P43212 | P43212 | P43212 | P43212 | P43212 | P43212 |
| cell dimensions: | ||||||
| a = b, c (Å) | 79.12, 38.07 | 78.71, 37.63 | 79.16, 38.15 | 79.15, 38.10 | 79.15, 38.10 | 79.16, 38.09 |
| resolution (Å) | 25.50–1.85 (1.89–1.85) | 25.50–1.85 (1.89–1.85) | 25.50–1.85 (1.89–1.85) | 25.50–1.85 (1.89–1.85) | 25.50–1.85 (1.89–1.85) | 25.50–1.85 (1.89–1.85) |
| Rsym (%) | 3.67 (42.35) | 4.90 (46.77) | 2.72 (23.13) | 1.96 (13.00) | 4.33 (64.80) | 3.9 (42.8) |
| I/σI | 20.00 (2.44) | 14.94 (2.27) | 25.61 (4.23) | 35.66 (6.89) | 17.49 (1.61) | 18.93 (2.36) |
| completeness (%) | 99.4 (95.0) | 99.5 (94.0) | 99.3 (93.0) | 98.00 (85.5) | 97.4 (92.0) | 98.7 (88.5) |
| unique reflections | 10768 (479) | 10554 (469) | 10784 (463) | 10630 (425) | 10573 (457) | 10707 (583) |
| multiplicity | 13.85 (3.81) | 13.47 (4.00) | 13.89 (3.85) | 13.85 (3.81) | 13.73 (3.83) | 13.81 (4.03) |
| Wilson B factor (Å2) | 12.8 | 12.6 | 13.5 | 13.0 | 12.9 | 12.1 |
| CC1/2 | 0.99 (0.95) | 0.99 (0.54) | 0.99 (0.73) | 0.99 (0.95) | 0.99 (0.75) | 0.99 (0.68) |
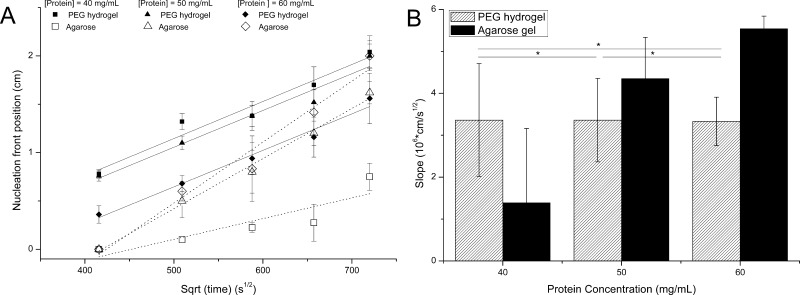
The effect of the crystallization substrate was also investigated. Agarose gel is known to induce nucleation,39 whereas silica gel is considered to inhibit the nucleation of lysozyme.14,40 To evaluate the possible effect of PEG hydrogels on the nucleation of lysozyme, we followed the progress of the nucleation front using the 3L configuration of the counterdiffusion technique. The observable nucleation front was determined as the position of the last crystal observed with a microscope (see Figure S2). The results were also compared with identical experiments using agarose to gel the protein solution. For this particular experiment, it was decided to keep a constant gel concentration of agarose, 0.2% (w/w), and PEG, 10% (w/v), in the protein chamber and a plug composition of 50% (w/w) PEG. Protein concentration was fixed at 40, 50, and 60 mg/mL.
Figure 6A demonstrates the evolution of the observable nucleation front as a function of the square root of time for each protein concentration. This representation allows us to conclude that a diffusional mass transport process controls the nucleation front evolution within the selected time frame since it follows the analytical solution of Fick’s law.31 Therefore, the slope of the linear curve fitting is a measure of the rate at which the nucleation front is moving along the protein chamber (Figure 6B). Experiments conducted in agarose evolved as expected; the nucleation front moved faster as the protein concentration was increased. Also, the three experimental series (40, 50, and 60 mg/mL) performed with agarose started at almost the same time with a small delay of the experiments performed with 40 mg/mL lysozyme. These results indicated that the plug pore size (50% (w/w) PEG) controls the diffusion of the crystallization solution, and, therefore, determines the starting time. This behavior was not followed for the experiments conducted with PEG hydrogel. A closer look at the evolution of the experiments (Figure 6A) indicated that the experiments performed using the PEG hydrogel started to nucleate earlier than the experiments conducted in agarose. Taking into account that agarose acts as a nucleation inducer,39 the PEG hydrogel is acting as a crystallization agent, enhancing the local supersaturation reached by the diffusion of sodium chloride. Although this effect is observed for all PEG hydrogel experiments, at 60 mg/mL of lysozyme a delay can be observed. We believed that at high protein concentration, over 50 mg/mL, the interaction between the protein molecules and the PEG monomers might affect the polymerization, and protein could be entrapped within the gel network or even produce some protein denaturation. Any of these effects could lower the supersaturation when compared with the other two experimental series. Second, in all experiments performed with PEG-based hydrogel, the nucleation front advanced at a constant rate (slope) independently of the protein concentration (Figure 6B and Table S1). This observed behavior points to an effect of the PEG pore diameter, much smaller than agarose pore size. We hypothesize that the PEG hydrogel is playing an essential role on the control of supersaturation by limiting the diffusion of protein molecules.
Figure 6.
(A) Observable nucleation front position as a function of the square root of time of 3L counterdiffusion experiments. The crystallization chamber contains protein, in 10% (w/w) PEG cross-linked hydrogel or 0.2% (w/v) agarose, at three concentrations. Error bars for the observable nucleation front position vs the square root of time represent one standard deviation from the average of three independent experiments. Lines (dotted for agarose experiments) represent the linear curve fit. The slope of the fit, which gives an idea of the nucleation front rate, is plotted in B vs protein concentration for the six types of experiments. Error bars in the slope vs protein concentration represent the 95% confidence interval.
Finally, as a proof of concept, we have also tested the use of a PEG hydrogel, a highly biocompatible material, as crystallization media for the production of crystalline insulin–PEG composite material. In order to minimize protein consumption, we selected the gel acupuncture method setup of the counterdiffusion technique to grow insulin–PEG crystals in capillaries of 0.8 mm inner diameter. Crystals were observed after 8 days and grown along the capillary to a final size of approximately 460 × 420 × 420 μm3 (Figure 7).
Figure 7.
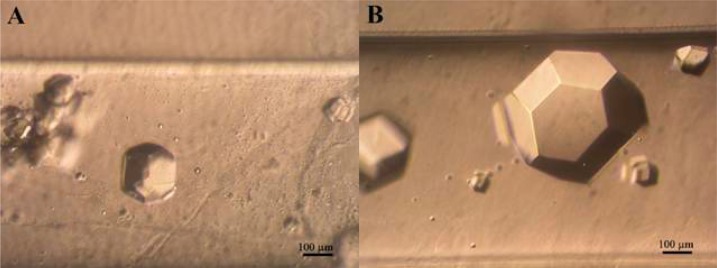
Insulin crystals grown in 10% (w/w) PEG hydrogel using the GAME configuration with capillaries of 0.8 mm inner diameter punctuated in agarose 0.2% (w/v). A and B representing the lower, close to the crystallization agent insertion point, and the upper parts of the capillary, respectively.
Conclusions
We have demonstrated that PEG-based hydrogels are good candidates to produce protein crystals under reduced convection. There are two possible ways to reduce the convection using PEG hydrogels in counterdiffusion experiments: (i) mixed with the protein solution or (ii) as a membrane to control the diffusion of the crystallization agent into the protein crystallization chamber. In the first case, the physicochemical interactions between the macromolecule and the polymer could play an important role on the control of nucleation and crystal shape. As in the case of agarose and silica gels, crystals grown in PEG hydrogels incorporate the gel matrix, producing composite materials of both the hydrogel and the protein molecules. This composite material may find potential use as a controlled drug delivery system. In the second case, the use of a material prepared ad hoc may allow fine-tuning of the development of the supersaturation in the crystallization chamber by controlling the polymer mesh size and could help to produce crystals of larger size suitable for neutron diffraction.
Acknowledgments
This project was supported by the National Center for Research Resources, the National Institute of General Medical Sciences of the National Institutes of Health through Grant Number 8 P20 GM 103475 (to M.T.L.) and BIO2010-16800, “Factoría Española de Crystalización”, Consolider-Ingenio 2010 from the Spanish Ministry of Science and Innovation, FEDER Funds (to J.A.G.). We thank Dr. Alfonso García-Caballero for English review.
Glossary
Abbreviations
- PEG
poly(ethylene glycol)
- PEO
poly(ethylene oxide)
- PVA
poly(vinyl alcohol)
- NIPAAm-co-BMA
poly(N-isopropylacrylamide-co-n-butyl methacrylate
- PEGMA
poly(ethylene glycol) monomethyl ether monomethacrylate
- PEGDMA
poly(ethylene glycol) dimethacrylate
- GAME
gel acupuncture method
- GCB
Granada crystallization box
Supporting Information Available
Structure idealized of PEGMA/PEGDMA (1000) monomer and cross-linker as depicted by Figure S1. The practical determination of the observable nucleation front position is illustrated in Figure S2. Figure S3 illustrates examples of lysozyme crystals grown using PEG-based hydrogel plugs of 20 (a), 35 (b) and 50 (c) % (w/w) compositions. Images of crystal dissolution and subsequent gel residue can be observed in Figure S4. X-ray data for crystals grown in hydrogels is illustrated in Figure S5. Slopes and confidence intervals for Figure 6 can be found in Table S1. This material is available free of charge via the Internet at http://pubs.acs.org.
Author Present Address
∥ A.C.-M.: Department of Mechanical Engineering, University of Rovira I Virgili, Av. Paisos Catalans 26, Tarragona, Spain 43007.
Author Present Address
⊥ J.A.J.-T.: University of Wisconsin—Madison, 1111 Highland Avenue, WIMR 6th Floor, Madison, WI 53705.
Author Contributions
§ These authors contributed equally.
The authors declare no competing financial interest.
Funding Statement
National Institutes of Health, United States
Supplementary Material
References
- Henisch H. K.Crystal Growth in Gels; General Publishing Company, Ltd.: Toronto, Canada, 1970; p 111. [Google Scholar]
- Choquesillo-Lazarte D.; Garcia-Ruiz J. M. Poly(ethylene) oxide for small-molecule crystal growth in gelled organic solvents. J. Appl. Crystallogr. 2011, 441172–176. [Google Scholar]
- Helbig U. Growth of calcium carbonate in polyacrylamide hydrogel: Investigation of the influence of polymer content. J. Cryst. Growth 2008, 310112863–2870. [Google Scholar]
- Garcia-Ruiz J. M. The uses of crystal growth in gels and other diffusing-reacting systems. Key Eng. Mater. 1991, 58, 87–106. [Google Scholar]
- Lorber B.; Sauter C.; Theobald-Dietrich A.; Moreno A.; Schellenberger P.; Robert M.-C.; Capelle B.; Sanglier S.; Potier N.; Giege R. Crystal growth of proteins, nucleic acids, and viruses in gels. Prog. Biophys. Mol. Biol. 2009, 101113–25. [DOI] [PubMed] [Google Scholar]
- Garcia-Ruiz J. M.; Novella M. L.; Moreno R.; Gavira J. A. Agarose as crystallization media for proteins. I: Transport processes. J. Cryst. Growth 2001, 2321–4165–172. [Google Scholar]
- Mirkin N.; Moreno A. Advances in crystal growth techniques of biological macromolecules. J. Mex. Chem. Soc. 2005, 49139–52. [Google Scholar]
- Van Driessche A. E. S.; Otalora F.; Gavira J. A.; Sazaki G. Is agarose an impurity or an impurity filter? In situ observation of the joint gel/impurity effect on protein crystal growth kinetics. Cryst. Growth Des. 2008, 8103623–3629. [Google Scholar]
- Willaert R.; Zegers I.; Wyns L.; Sleutel M. Protein crystallization in hydrogel beads. Acta Crystallogr., Sect. D 2005, 6191280–1288. [DOI] [PubMed] [Google Scholar]
- Sugiyama S.; Maruyama M.; Sazaki G.; Hirose M.; Adachi H.; Takano K.; Murakami S.; Inoue T.; Mori Y.; Matsumura H. Growth of protein crystals in hydrogels prevents osmotic shock. J. Am. Chem. Soc. 2012, 134135786–5789. [DOI] [PubMed] [Google Scholar]
- Biertumpfel C.; Basquin J.; Suck D.; Sauter C. Crystallization of biological macromolecules using agarose gel. Acta Crystallogr., Sect. D 2002, 5810 Part 11657–1659. [DOI] [PubMed] [Google Scholar]
- Garcia-Ruiz J. M.; Gavira J. A.; Otalora F.; Guasch A.; Coll M. Reinforced protein crystals. Mater. Res. Bull. 1998, 33111593–1598. [Google Scholar]
- Gavira J. A.; Garcia-Ruiz J. M. Agarose as crystallisation media for proteins II: Trapping of gel fibres into the crystals. Acta Crystallogr., Sect. D 2002, 5810 Part 11653–1656. [DOI] [PubMed] [Google Scholar]
- Gavira J. A.; Van Driessche A. E. S.; Garcia-Ruiz J.-M. Growth of ultrastable protein–silica composite crystals. Cryst. Growth Des. 2013, 1362522–2529. [Google Scholar]
- Petrova R. I.; Swift J. A. Habit changes of sodium bromate crystals grown from gel media. Cryst. Growth Des. 2002, 26573–578. [Google Scholar]
- Li H.; Fujiki Y.; Sada K.; Estroff L. A. Gel incorporation inside of organic single crystals grown in agarose hydrogels. CrystEngComm 2011, 1341060–1062. [Google Scholar]
- Pietras Z.; Lin H.-T.; Surade S.; Luisi B.; Slattery O.; Pos K. M.; Moreno A. The use of novel organic gels and hydrogels in protein crystallization. J. Appl. Crystallogr. 2010, 43158–63. [Google Scholar]
- Sugiyama S.; Shimizu N.; Sazaki G.; Hirose M.; Takahashi Y.; Maruyama M.; Matsumura H.; Adachi H.; Takano K.; Murakami S.; Inoue T.; Mori Y. A novel approach for protein crystallization by a synthetic hydrogel with thermoreversible gelation polymer. Cryst. Growth Des. 2013, 1351899–1904. [Google Scholar]
- Hughes R. C.; Coates L.; Blakeley M. P.; Tomanicek S. J.; Langan P.; Kovalevsky A. Y.; Garcia-Ruiz J. M.; Ng J. D. Inorganic pyrophosphatase crystals from Thermococcus thioreducens for X-ray and neutron diffraction. Acta Crystallogr., Sect. F 2012, 68121482–1487. [DOI] [PMC free article] [PubMed] [Google Scholar]
- Langer R.; Peppas N. A. Advances in biomaterials, drug delivery, and bionanotechnology. AIChE J. 2003, 49122990–3006. [Google Scholar]
- Peppas N. A.; Keys K. B.; Torres-Lugo M.; Lowman A. M. Poly(ethylene glycol)-containing hydrogels in drug delivery. J. Controlled Release 1999, 621–281–87. [DOI] [PubMed] [Google Scholar]
- Morishita M.; Goto T.; Nakamura K.; Lowman A. M.; Takayama K.; Peppas N. A. Novel oral insulin delivery systems based on complexation polymer hydrogels: Single and multiple administration studies in type 1 and 2 diabetic rats. J. Controlled Release 2006, 1103587–594. [DOI] [PMC free article] [PubMed] [Google Scholar]
- Yamagata T.; Morishita M.; Kavimandan N. J.; Nakamura K.; Fukuoka Y.; Takayama K.; Peppas N. A. Characterization of insulin protection properties of complexation hydrogels in gastric and intestinal enzyme fluids. J. Controlled Release 2006, 1123343–349. [DOI] [PubMed] [Google Scholar]
- Lee A. G.; Arena C. P.; Beebe D. J.; Palecek S. P. Development of macroporous poly(ethylene glycol) hydrogel arrays within microfluidic channels. Biomacromolecules 2010, 11123316–3324. [DOI] [PMC free article] [PubMed] [Google Scholar]
- Keys K. B.; Andreopoulos F. M.; Peppas N. A. Poly(ethylene glycol) star polymer hydrogels. Macromolecules 1998, 31238149–8156. [Google Scholar]
- Nam K.; Watanabe J.; Ishihara K. Network structure of spontaneously forming physically cross-link hydrogel composed of two-water soluble phospholipid polymers. Polymer 2005, 46134704–4713. [Google Scholar]
- Peppas N. A.Fundamentals. In Hydrogels in Medicine and Pharmacy; CRC Press, Inc.: Boca Raton, FL, 1987; Vol. I. [Google Scholar]
- Canal T.; Peppas N. A. Correlation between mesh size and equilibrium degree of swelling of polymeric networks. J. Biomed. Mater. Res., Part A 1989, 23101183–1193. [DOI] [PubMed] [Google Scholar]
- Ishii Y.Laser-diode interferometry. In Progress in Optics; Elsevier: Amsterdam, 2004; Vol. 46, pp 243–309. [Google Scholar]
- Ishii Y.; Chen J.; Murata K. Digital phase-measuring interferometry with a tunable laser diode. Opt. Lett. 1987, 124233–235. [DOI] [PubMed] [Google Scholar]
- Crank J.The Mathematics of Diffusion; Clarendon Press: Oxford, UK, 1979. [Google Scholar]
- Collaborative Computational Project, N., The CCP4 suite: programs for protein crystallography. Acta Crystallogr., Sect. D 1994, 50, (5), 760–763. [DOI] [PubMed] [Google Scholar]
- Garcia-Ruiz J. M.; Moreno A. Investigations on protein crystal growth by the gel acupuncture method. Acta Crystallogr., Sect. D 1994, 504484–490. [DOI] [PubMed] [Google Scholar]
- Garcia-Ruiz J. M.; Charles W.; Carter J.; Sweet R. M. Counterdiffusion methods for macromolecular crystallization. Methods Enzymol. 2003, 368, 130–154. [DOI] [PubMed] [Google Scholar]
- Otalora F.; Gavira J. A.; Ng J. D.; Garcia-Ruiz J. M. Counterdiffusion methods applied to protein crystallization. Prog. Biophys. Mol. Biol. 2009, 1011–326–37. [DOI] [PubMed] [Google Scholar]
- Torres-Lugo M.; Peppas N. A. Molecular design and in vitro studies of novel pH-sensitive hydrogels for the oral delivery of calcitonin. Macromolecules 1999, 32206646–6651. [Google Scholar]
- Berg W. F. Crystal Growth from Solutions. Proc. R. Soc. London, Ser. A 1938, 16491679–95. [Google Scholar]
- Maes D.; Evrard C.; Gavira J. A.; Sleutel M.; De Weedt C. V.; Otalora F.; Garcia-Ruiz J. M.; Nicolis G.; Martial J.; Decanniere K. Toward a definition of X-ray crystal quality. Cryst. Growth Des. 2008, 8124284–4290. [Google Scholar]
- Vidal O.; Robert M. C.; Boue F. Gel growth of lysozyme crystals studied by small angle neutron scattering: Case of agarose gel, a nucleation promotor. J. Cryst. Growth 1998, 1921–2257–270. [Google Scholar]
- Vidal O.; Robert M. C.; Boue F. Gel growth of lysozyme crystals studied by small angle neutron scattering: Case of silica gel, a nucleation inhibitor. J. Cryst. Growth 1998, 1921–2271–281. [Google Scholar]
Associated Data
This section collects any data citations, data availability statements, or supplementary materials included in this article.


