

Abstract
Using HCV and IFN-resistance as a proof of concept, we have devised a new methodology for calculating the effect of a drug over a viral population and the resistance of its individual intra-host variants.
By means of next-generation sequencing, HCV variants were obtained from sera collected at 9 time-points from 16 patients during the first 48 hours after injection of IFN-α. IFN-resistance coefficients were calculated for individual variants using changes in their relative frequencies, and for the entire intra-host viral population using changes in viral titer during the initial 48 hours.
Population-wide resistance and presence of IFN-resistant variants were highly associated with pegIFN-α2a/RBV treatment outcome at week 12 (p = 3.78×10⁻⁵ and 0.0114, respectively). This new method allows an accurate measurement of resistance based solely on changes in viral titer or the relative frequency of intra-host viral variants during a short observation time.
There has been a great progress in the development of antiviral agents licensed for treatment of Human immunodeficiency virus (HIV), Herpesviruses, Hepatitis viruses and respiratory viruses1. The emergence of HIV as a major human pathogen and the intensive use of antiretroviral compounds have also provided a better understanding of the genesis of antiviral resistance2. However, there is not a simple method for measuring directly the effect a drug has over a viral population and its individual intra-host variants. Such measure could help screen promising drugs that affect the viral population and also detect the individual variants that are naturally more resistant. In this paper, we use the effects of Interferon (IFN) on HCV as a proof of concept, finding that our drug-resistance estimates, calculated during the first 48 hour after IFN injection, are strongly associated with outcome of therapy at week 12.
Hepatitis C virus (HCV) infects nearly 3% of the world's population and is a major cause of liver disease worldwide3. There is no vaccine against HCV and up to recently the standard-of-care therapy involved the combined use of pegylated interferon (peg-IFN) and ribavirin (RBV). This combination therapy is expensive, effective in only 50%-60% of patients, and can be associated with frequent and serious adverse side effects in more than 75% of patients4, 5 In order to improve cost-effectiveness and ameliorate patient hardship, it would be desirable to predict the response at early onset of therapy.
IFNs are crucial components of the innate immune system. IFN-α acts by inducing production of interferon stimulating genes (ISGs) to establish a non-specific antiviral state within the cell with direct inhibition of viral replication. It is also known to exert immunomodulatory effects that enhance immune response and accelerate clearance of infected cells6. When exogenously administered as a single injection, IFN-α induces a decline of HCV RNA in two phases: a rapid phase lasting for 24-48 hours, followed by a slower phase of decline over the ensuing weeks. The initial rapid decline is defined by the rate of viral clearance and the effectiveness of IFN in blocking viral production. Successful treatment results in sustained undetectable HCV RNA after completion of therapy. Treatment failure results either from nonresponse (minimal declines in viral titer during therapy) or relapse (robust initial responses followed by rebounds of viral titers after therapy)6.
Several independent predictors of a sustained virologic response (SVR) to IFN/RBV therapy have been identified. These include HCV genotypes 2 and 3, low pretreatment viral load, Asian or Caucasian ethnicity, younger age, absence of advanced fibrosis or cirrhosis, and absence of steatosis7. More recently, Genome Wide Association Studies have identified single-nucleotide polymorphisms near the IL28B gene (encoding IFN-λ3) as being particularly associated with spontaneous and treatment-induced clearance of HCV infection8, 9. However, IL28B variations may account for only ∼15% of inter-individual variability of SVR10. The interaction of these host factors determines the therapy effect on the virus, which is directly evidenced by a decline in viral titer, the reason why the rate and magnitude of decline in the first weeks of treatment can predict the outcome of therapy6.
HCV exists in infected patients as a large viral population of intra-host variants, which may be differentially resistant to IFN treatment and, therefore, likely to display variable temporal patterns during the first phase of decline following IFN injection. Assessing the spectrum of HCV variants and measuring the IFN resistance of individual variants could be critical for understanding the variability in therapy outcomes. Next-generation sequencing (NGS) technologies in conjunction with computational analysis allow for quantitative assessment of viral intra-host variants, providing data on the intra-host dynamics of individual HCV variants and an opportunity for measuring their resistance to IFN. The HVR1 region of HCV is used here as a tag or marker of individual intra-host viral strains for estimating their relative frequencies over a short period of time.
Since the model is based solely on changes in viral titer or the relative frequency of intra-host viral variants persisting during antiviral therapy, without consideration of other viral factors, host factors or type of drug administered, it may be applicable to measure and predict HCV treatment response with other drug regimens, including the newly available direct acting antiviral (DAA) agents. In addition, the presented analytical framework should be applicable to drug resistance of other viral infections.
Results
Outcomes of therapy
The demographics and clinical features of the 16 study patients are summarized in Table 1, which includes their gender, race, grade of hepatic inflammation and fibrosis, IL28 genotype (see also figure 2A) and therapy outcome according to the clinical criterion of treatment success11, 12: (i) Rapid Virological Response (RVR) is defined as having undetectable HCV RNA by week 4 of therapy (n=4); (ii) Early Virological Response (cEVR): undetectable HCV RNA by week 12 of therapy (n=6); (iii) partial Early Virological Response (pEVR): a decrease of HCV RNA more than 2 log10 but still detectable after 12 weeks of therapy (n=4); and (iv) non-response (NR): decrease of HCV RNA less than 2 log10 after 12 weeks of therapy (n=2). The inefficiency of IL28B as the sole predictor of IFN-based therapeutic response is highlighted in Figure 2A, which displays the number of patients by IL28B status and therapy outcome.
Table 1.
Characteristics of study patients.M, male; F, female; B, black; W, white; RVR, rapid virological response; cEVR, complete early virological response; pEVR, partial early virological response; and NR, non-responder.
| Patient | 1 | 2 | 3 | 4 | 5 | 6 | 7 | 8 | 9 | 10 | 11 | 12 | 13 | 14 | 15 | 16 |
|---|---|---|---|---|---|---|---|---|---|---|---|---|---|---|---|---|
| Gender | M | M | F | M | M | M | M | F | F | M | M | M | F | M | M | F |
| Race | B | W | W | W | W | W | W | W | B | W | W | W | W | W | B | W |
| Age (years) | 51 | 56 | 60 | 59 | 22 | 54 | 49 | 27 | 56 | 47 | 25 | 30 | 46 | 50 | 36 | 50 |
| Hepatic Inflammation | 1 | 2 | 2 | 2 | 2 | 2 | 1 | 1 | 2 | 2 | 2 | 1 | 2 | 2 | 2 | 2 |
| Hepatic fibrosis | 1 | 3 | 3 | 1 | 1 | 3 | 1 | 0 | 3 | 0 | 0 | 0 | 2 | 2 | 0 | 1 |
| IL28B genotype | CC | CT | TT | CC | CC | CC | CC | CT | TT | CT | TT | CC | TT | CT | CT | TT |
| Outcome at week 12 | NR | pEVR | NR | RVR | RVR | cEVR | cEVR | cEVR | pEVR | cEVR | RVR | RVR | pEVR | pEVR | cEVR | cEVR |
Figure 2.

A) Number of patients by IL28B status and therapy outcome. B) Population IFN-resistance for each patient. Blue: RVR; red: cEVR; yellow: pEVR; and green: NR. C) Average population IFN-resistance of patients for each outcome, bars correspond to standard error of the mean. D) Number of reads obtained by NGS from each patient and each time-point.
Decline of viral titer during the first 48 hours after single-dose injection
HCV RNA level was measured at each time-point (Figure 1) and interpolated over the entire 48 hours. The titer declined in all patients, starting from an average of 4.76 hours after IFN injection (standard deviation [SD] 2.23 hours), with the lowest point being observed at 30.03 hours (S.D. 4.66 hours), and an average drop of 1.67 log10 IU/ml. The HCV RNA titer rised at 48 hours in all patients with an average increase of 0.86 log10 IU/ml compared to the lowest titer, which likely corresponded to the gradual clearance of the administered IFN (Figure 1). All calculations conducted in this paper used all time-points, but we found four time-points (0, 24, 36 and 48 hours) which are particularly critical for the calculation of resistance. This is due to the fact that the most important changes in viral titer occur around these time-points.
Figure 1.
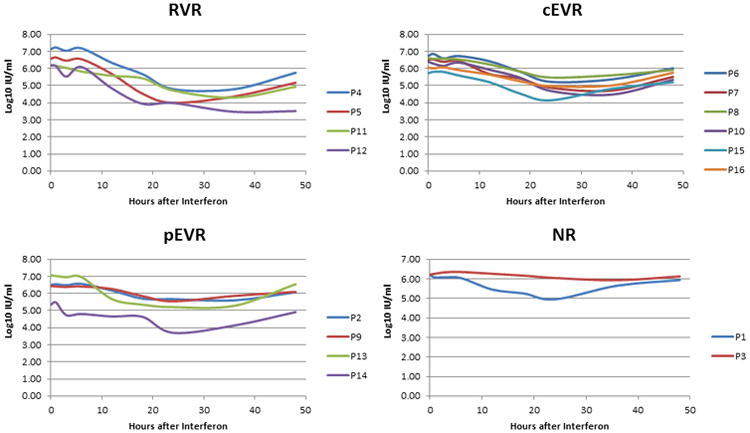
HCV RNA level across all time-points. Patients are grouped according to treatment outcomes.
Association of the population IFN-resistance with outcome of treatment at week 12
The population IFN-resistance coefficient was calculated using the rate of titer change as described in Equation 3. A positive coefficient value indicates IFN-resistance, whereas a negative value indicates IFN-sensitivity. Figure 2B shows the association of the coefficient values with therapy outcomes. The lowest coefficient value was calculated for RVR followed by cEVR and pEVR, with the highest value calculated for NR. The average population IFN-resistance coefficients for the four outcomes were significantly different (p-value = 3.78×10⁻⁵), being 3.03 times higher for non-responders (pEVR and NR) than for responders (RVR and cEVR) (p-value = 0.0040) (Figure 2B). Thus, the resistance coefficients calculated using data from the first 48 hours strongly correlated with therapy outcome at week 12.
Stability of intra-host HCV subpopulations
Given the strong association between population IFN-resistance coefficient values and therapy outcome, we investigated whether this association could be attributed to resistance of individual HCV variants. The HCV E1/E2 region from all samples was subjected to deep-sequencing, generating a total of 1,763,502 reads, with an average of 12,332 reads per time-point (Figure 2D). Many low-frequency intra-host viral variants could not be detected at all time-points, with numerous variants detectable only at a single time-point. However, the spectrum of frequent intra-host HCV variants was stable. On average, 76.81% (SD 17.66%) of all error-corrected reads found at 48 hours were also present before therapy. The less persistent variants were usually found at very low frequencies, suggesting that their absence at some time-points is likely due to stochastic sampling. The nucleotide diversity of each time-point was calculated and also found to be constant in all patients, with the SD of the nucleotide diversity ranging from 0.0001 in Patient 2 to 0.0139 in Patient 14.
Phylogenetic analysis showed that major viral subpopulations were constantly present during the entire sampling period in all patients. However, many low-frequency variants could be detectable at only certain time-points. Genetic differences between time-points were measured for each patient using Φst. Viral populations found at the first and last time-points were very similar in most patients, the average Φst being only 3.52%, with only one patient (Patient 6) showing a high Φst value (71.14%) (see Table 2).
Table 2.
IFN-resistance of the individual variants in each patient.
| Patient | Outcome | Population IFN-resistance | Φst | n | n resistant | Frequency of major | IFN-resistance of major | Fraction of resistant reads | Minimum IFN-Resistance | Maximum IFN-resistance |
|---|---|---|---|---|---|---|---|---|---|---|
| P4 | RVR | -7.9 | 0.72 | 29 | 0 | 0.48 | -7.63 | 0 | -11.26 | -5.86 |
| P5 | RVR | -7.58 | 0.49 | 23 | 0 | 0.55 | -7.33 | 0 | -10.05 | -5.08 |
| P11 | RVR | -5.97 | 0.07 | 24 | 0 | 0.51 | -5.86 | 0 | -7.49 | -3.43 |
| P12 | RVR | -14.85 | 13.08 | 1 | 0 | 1 | -14.63 | 0 | -14.63 | -14.63 |
| P6 | cEVR | -4.27 | 71.14 | 1 | 0 | 1 | -11.45 | 0 | -11.45 | -11.45 |
| P7 | cEVR | -5.03 | 4.31 | 40 | 0 | 0.41 | -5.21 | 0 | -7.08 | -2.84 |
| P8 | cEVR | -3.4 | 0.29 | 42 | 0 | 0.41 | -3.49 | 0 | -6.94 | -0.4 |
| P10 | cEVR | -5.66 | 0.82 | 12 | 0 | 0.66 | -5.43 | 0 | -7.42 | -2.56 |
| P15 | cEVR | -3.14 | 1.37 | 75 | 0 | 0.31 | -3.02 | 0 | -5.62 | -0.19 |
| P16 | cEVR | -1.6 | 0 | 41 | 2 | 0.36 | -1.3 | 0.0048 | -4.01 | 1.45 |
| P2 | pEVR | -2.72 | 0.06 | 15 | 0 | 0.48 | -2.56 | 0 | -5.7 | -1.05 |
| P9 | pEVR | -1.74 | 0.48 | 85 | 7 | 0.27 | -1.72 | 0.0077 | -5.09 | 1.44 |
| P13 | pEVR | -2.41 | 3.93 | 86 | 3 | 0.15 | -1.94 | 0.0074 | -6.47 | 1.88 |
| P14 | pEVR | -2.88 | 22.85 | 25 | 3 | 0.34 | -2.35 | 0.1473 | -9.59 | 1.78 |
| P1 | NR | -0.79 | 0.86 | 14 | 4 | 0.41 | -0.77 | 0.1465 | -1.72 | 0.34 |
| P3 | NR | -1.22 | 0 | 50 | 3 | 0.45 | -1.31 | 0.0065 | -4.49 | 0.74 |
Association between presence of IFN-resistant variants and therapy outcome
Sequences of intra-host HCV variants were not expected to accrue mutations over 48 hours of observation. However, we found that the relative frequencies of persistent variants changed during the time period in all patients (Figure 3). The developed mathematical model allowed calculation of the IFN resistance coefficient for each persisting intra-host HVR1 variant based on its relative frequency variations. IFN-resistance varied broadly among intra-host variants in all patients.
Figure 3.
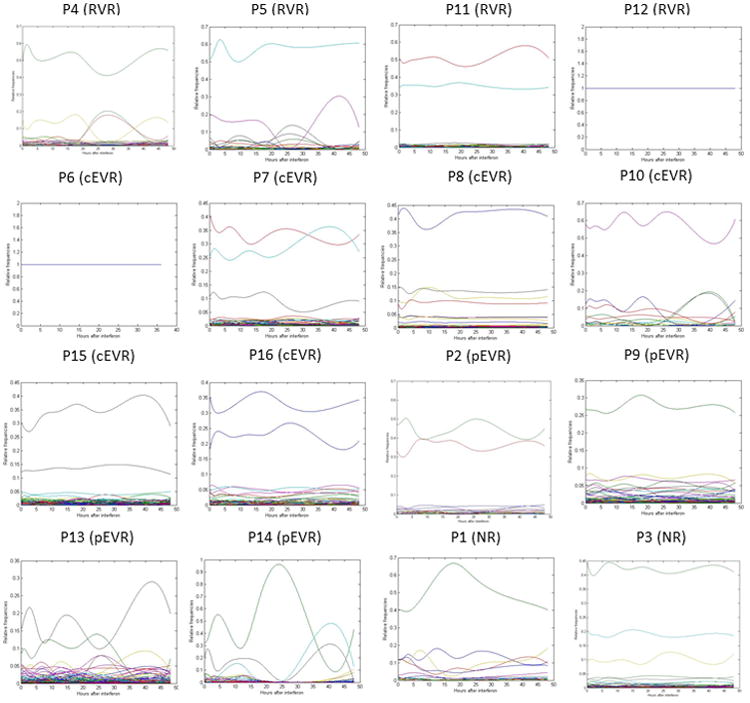
Relative frequencies of persistent variants over time in all patients.
Not a single IFN-resistant variant was found in patients with RVR and only one of six cEVR patients showed IFN-resistant variants (Table 2 and Figure 4A). In contrast, patients with pEVR and NR were infected with an average number of 3.25 and 3.5 IFN-resistant intra-host variants, respectively (Figure 4A). The average number of IFN-resistant variants was significantly associated with the four outcomes (p = 0.0114), being 16.6 times lower for non-responders (pEVR and NR) than for responders (RVR and cEVR) (p = 0.0014). The average total fraction of reads with positive IFN-resistance values was also significantly different among the four outcomes (p = 0.0014) (Figure 4C). These observations suggest that the absence or presence of IFN-resistant variants and their frequency prior to single-dose IFN injection are strong predictors of treatment outcome.
Figure 4.
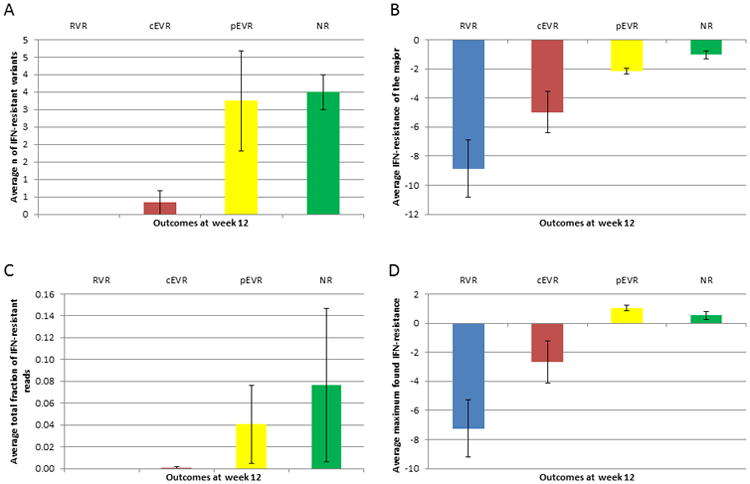
Average IFN-resistance calculated over the patients of each therapy outcome. A) Number of IFN-resistant variants. B) IFN-resistance coefficient of the major variant. C) Fraction of the total number of reads that are IFN-resistant. D) Maximum IFN-resistance found. Bars correspond to standard error of the mean.
In all patients, the variant with the highest initial frequency (henceforth referred to as the major variant) showed a strong sensitivity to IFN, with an average value of -4.75 over all patients (Table 2). The average IFN-resistance of the major variants for the four outcomes was significantly different (p = 0.0071), being 3.68 times higher for non-responders (pEVR and NR) than for responders (RVR and cEVR) (p = 0.0028) (Figure 4B). There was no association between the therapy outcome and the initial frequency of the IFN-sensitive major variant (p = 0.1535). The maximum IFN-resistance found in each patient was significantly different among the four outcomes (p = 0.0188), being 5.25 times higher for non-responders (pEVR and NR) than for responders (RVR and cEVR) (p = 0.0084) (Figure 4D).
Phylogenetic analysis of sensitive and resistant variants
For all patients showing one or more IFN-resistant variants, we performed a phylogenetic analysis to ascertain the genetic relatedness between the sensitive and resistant variants. For each patient, resistant variants were always one or two nucleotides different from the sensitive variants in the same cluster. In addition, resistant sequences did not cluster together but were scattered mostly across other subpopulations (Figure 5).
Figure 5.
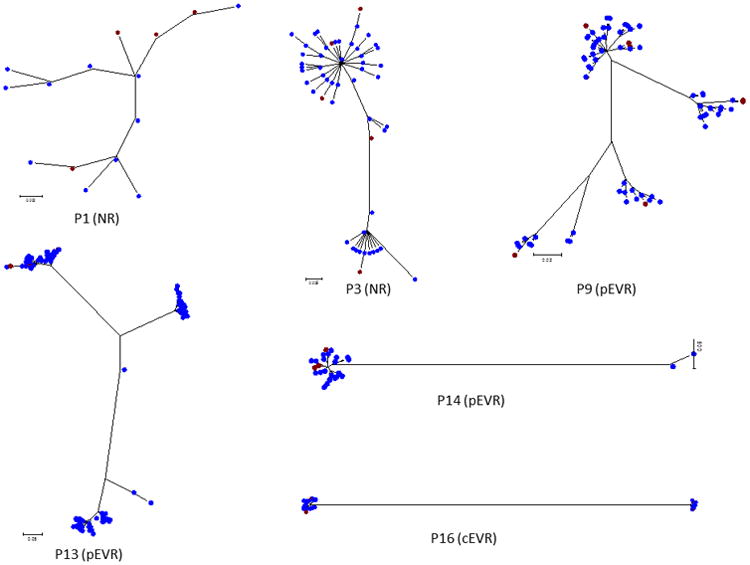
Maximum likelihood trees of all the sequences from patients with resistant variants. Red: IFN-resistant variants; blue: IFN-sensitive variants.
Discussion
Viral kinetic modeling has played an important role in analysis of HCV decay in peripheral blood (as measured by serum or plasma HCV RNA) after initiation of antiviral therapy13-15. Kinetic models usually include such parameters as viral load, number of target cells, number of infected cells producing virions, target cell production rate, target cell death rate, de novo infection rate constant, infected cells death rate, HCV virion production rate and HCV virion clearance rate. A recent study15 of 2100 patients from two clinical trials further developed a kinetic analysis based on a model that incorporates variables such as liver regeneration, HCV RNA below threshold of detection and a cure boundary. Although useful for understanding HCV pathogenesis and replication, such models require substantial a priori knowledge and assumptions, and data collected over 24 to 72 weeks of therapy.
It is the interaction of several host factors that determines the therapy effect on the virus, but such effect is directly evidenced by a decline in viral titer, the reason why the rate and magnitude of decline in the first weeks of treatment can predict the outcome of therapy6. The decline in viral titer observed among the patients during the first 48 hours after a single IFN injection indicates that their intra-host viral populations were under considerable selective pressure after the medication. Although the spectrum of intra-host HCV variants was relatively stable over that time period, we found that the frequencies of the persistent HCV variants were variable. This allowed the degree of IFN-resistance to be calculated for the individual intra-host HCV variants. We took advantage of the capacity of NGS to produce a massive number of sequences, facilitating accurate and robust assessment of the frequency of viral variants.
All calculations conducted here used 9 time-points, but the collection and sequencing of serum samples at such frequency is difficult for routine research or eventual patient evaluation. However, we found four time-points, 0, 24, 36 and 48 hours, to be sufficient for the calculation of resistance. Viral titer at these time-points reflects most closely the effect of IFN on viral population. It should be noted that the specific time-points, which are most critical for estimation of resistance coefficients, may differ for other drugs from those found in this study, owing to differences in mechanisms of action and clearance kinetics of drugs.
HVR1 is used here as a tag or marker of individual intra-host viral strains for estimating the relative frequency of intra-host HCV genomic variants. However, this relatively short region may be shared by more than one genetically distinct genomic variant. Nonetheless, HVR1 is the most heterogeneous region of the viral genome, so the probability of such sharing is minimized. Furthermore, we previously demonstrated that coordinated evolution among sites from the entire HCV genome is strongly associated with IFN resistance, and that sequence polymorphisms in short genomic regions, including HVR1, can accurately reflect that association16.
Phylogenetic analysis showed that IFN-resistant variants were one or two nucleotides different from sensitive variants, but both resistant and sensitive variants belonged to the same cluster, rather than being segregated. The association between variation in the HVR1 sequence and therapy outcome is therefore unlikely to be mediated by the few mutations in HVR1, but rather by other regions of the HCV genome, with HVR1 heterogeneity reflecting genetic variation in these regions, as we have previously shown16, 17.
Patient 16 was the only one from the group of responders (four RVR and six cEVR patients) who carried IFN-resistant variants with a value similar to that of pEVR and NR patients. The reasons for this discrepancy between outcome and our estimates are difficult to ascertain, although it was observed that this patient lost 62.5% of its titer within 2 days before IFN treatment. The results raise the interesting possibility that this patient cleared the HCV infection independently of the IFN treatment.
This study is the first to apply a mathematical model using empirically derived viral kinetic data with viral sequences linked to the frequency of their persistence. We found that frequency changes of the viral population associate strongly with treatment outcome. Since the model is based solely on changes in viral titer or the relative frequency of intra-host viral variants persisting during antiviral therapy, without consideration of other viral factors, host factors or type of drug administered, it is applicable to measure and predict HCV treatment response with other drug regimens, including the newly available direct acting antiviral (DAA) agents. The analytical framework developed here should be applicable as well to the drug response of other viral infections, as long as informative samples are collected at time-points reflecting variation in viral titer associated with the action of specific drugs on the virus under investigation.
Methods
Patients
Sixteen treatment-naïve patients with genotype 1 chronic hepatitis C were studied. Blood samples were collected from each patient over 48 hours (at time-points 0 (baseline), 1, 3, 6, 12, 18, 24, 36 and 48 hours) after a single subcutaneous injection of IFN-α (10 MU). Patients then received a course of pegylated IFN-α2a and ribavirin starting 48 hours after the single dose of IFN-α. Therapy continued for up to 48 weeks as per standard-of-care recommendation (see Lau et al.18 for more details). Ethical review and informed consent were granted by the institutional review boards of Beth Israel Deaconess Medical Center and the Centers for Disease Control and Prevention.
Nucleic acid extraction
Total nucleic acids from the specimens were extracted from serum using the Roche MagNA Pure LC instrument and the MagNA Pure LC Total Nucleic Acid Isolation Kit (Roche Diagnostics, Mannheim, Germany). RNA was precipitated and reverse-transcribed using both random and specific primers as previously described19. PCR quantification was conducted by the COBAS AmpliPrep/COBAS Taq-Man HCV Test (Roche Diagnostics, Mannheim, Germany), and the HCV genotype determined using the VERSANT HCV Genotype 2.0 Assay (LiPA) (Innogenetics NV, Gent, Belgium).
HVR1 cDNA amplification
The E1/E2 junction of the HCV genome (309 nt), which contains the HVR1 region, was amplified using our nested PCR protocol as previously described19. The amplicons generated during first-round PCR were used as templates for nested PCR using hybrid primers composed of primer adaptors, multiple identifiers and specific sequences complementary to the HCV genome. This strategy allowed for multiplexing and downstream pyrosequencing. Resulting amplicons were quantified using the Picogreen kit (Invitrogen, Carlsbad, CA). Integrity of each fragment was evaluated using Bioanalyzer 2100 (Agilent, Santa Clara, CA).
NGS
PCR products were pooled and subjected to pyrosequencing using the GS FLX System and the GS FLX Titanium Sequencing Kit (454 Life Sciences, Roche, Branford, CT). Low quality reads were removed using the GS Run Processor v2.3 (Roche). Initial reads were processed by matching to the corresponding identifier. The 454 files were processed using the error correction algorithms KEC and ET20, which have been validated to be highly accurate in finding true haplotypes, removing false haplotypes and estimating the frequency of true haplotypes. The error-corrected files were aligned using Muscle21 and the HVR1 sequences clipped to 293 bp.
Genetic structure analysis
Unbiased estimates of nucleotide diversity were calculated according to Nei22 using ARLEQUIN23. We also measured the genetic differences between the first time-point (0 hour) and the last time-point (48 hours) according to Excoffier et al.24 by means of ARLEQUIN23. The genetic structure was analyzed with consideration of the molecular differences between sequences in addition to differences in their frequencies, resulting in estimates of Φst, a measure of the percentage of genetic heterogeneity due to differences between two samples. Significance of the differences was estimated by use of a permutation test (n = 10,000). A maximum likelihood tree was built for the persistent variants of each patient by means of the software HyPhy25, using the General Time Reversible model. A Median-Joining network (MJN) was also built for each patient using the program NETWORK 4.626. The MJN method begins computing the minimum spanning trees (a graph that connects all sequences with the minimum total length of the branches), and then all these graphs are combined within a single (reticulate) network26.
Nucleotide sequence accession numbers
The E1/E2 sequences produced in this study have been deposited in the National Center for Biotechnology Information GenBank database under accession numbers KC562310 to KC562900.
IFN-resistance coefficients
The dataset under consideration is HCV titer and sets of E1/E2 sequences with their relative frequencies for each time-point. In order to obtain reliable results in the calculation of IFN resistance for individual variants, only sequences present at every time-point were analyzed. The average fraction of persistent variants for all patients was 61.4% (ranging from 10.9% for Patient 6 to 94.9% for Patient 8).
The dynamics of the viral population consisting of n variants was described by the following system of differential equations27:
| (1) |
Here ui(t) and gi(t) are the frequency and the fitness of a variant i at time t, respectively; h(t) is the titer, ui(t), i=1,…, n and h(t) were interpolated on the whole segment from 0 to 48 hours using cubic splines, and the derivatives u̇i(t) and ḣ(t) were calculated using the obtained spline approximations.
The average fitness during the studied time interval was used as a measure of the IFN-resistance of each variant. Using the expressions for gi(t) obtained from (1), the individual variant IFN-resistance coefficient ri for each variant, i, was calculated by the following formula:
| (2) |
Here T = 48 hrs and t0 is the time when interferon begins affecting the viral population, which is estimated as the point when titer starts declining monotonically in the obtained spline approximation. The population IFN-resistance coefficient was calculated by the formula
| (3) |
To evaluate the estimates' quality of individual variants resistance, it was assumed that the correctly estimated fitnesses, ui(t), changed smoothly at the interval [0, 48]. Abrupt changes of ui(t) may indicate errors in the variant frequencies estimation due to PCR bias, sequencing inaccuracies, or both. The total variation of fitness on the interval [0,T] for each variant was used as a measure of the possible error and was calculated using the following formula:
| (4) |
The variants with a variation greater than mean fitness variation over the whole population plus 2 standard deviations were excluded from analysis.
The justification of the model and derivations of formulas have been described in detail by Skums et al.27 All calculations were made in MATLAB R2010b (The Math Works, Inc., Natick, MA).
Statistical analysis
We tested the differences in IFN-resistance among therapy outcomes by means of a Multi-Response Permutation procedure (MRPP)28, 29. MRPP is a permutation version of the t-test, a non-parametric test for testing the hypothesis of no difference between two groups of paired samples. Permutation tests represent ideal situations in which exact probabilities associated with a test statistic may be derived, rather than approximated from common probability distributions, such as t, F and Chi square30. In the majority of studies, the population distribution is unknown and assuming a normal distribution is inappropriate for many biological datasets, which often are skewed, discontinuous and multi-modal. We used the MRPP implemented in BLOSSOM28, using exact probabilities (all possible permutations) and V parameter equal to 1.
Study Highlights.
-
What is the current knowledge on the topic?
There has been a great progress in the development of antiviral agents. However, there is not a simple method for measuring directly the effect a drug has over a viral population and its individual intra-host variants.
-
What question this study addressed?
Whether next-generation sequencing can be used to estimate the drug resistance of a viral population.
-
What this study adds to our knowledge?
Population-wide resistance and presence of drug-resistant variants were highly associated with treatment outcome.
-
How this might change clinical pharmacology and therapeutics?
Since the model is based solely on changes in viral titer or the relative frequency of intra-host viral variants persisting during antiviral therapy, without consideration of other viral factors, host factors or type of drug administered, it is potentially applicable to measure and predict the drug response of other viral infections.
Acknowledgments
Funding: Supported by National Institutes of Health grants R01 DK068598-01 (to D.T-Y.L.), M01-RR-01032, and M01-RR-01032 (General Clinical Research Center)
Footnotes
Authors' contributions: Khudyakov wrote the paper
Campo, Teo, Khudyakov, Lau, designed the research
Campo, Skums, Dimitrova, Vaughan, Forbi, performed the research
Campo, Skums, Dimitrova, analyzed the research
Lau contributed new reagents/analytical tools
Conflicts of interest: The authors disclose no conflicts.
References
- 1.Said Z, Abdelwahab K. Viral Replication. InTech; 2013. pp. 127–144. ed. D. 10.5772/53707. [Google Scholar]
- 2.Zambon MC. Surveillance for antiviral resistance. Influenza and other respiratory viruses. 2013;7 Suppl 1:37–43. doi: 10.1111/irv.12050. [DOI] [PMC free article] [PubMed] [Google Scholar]
- 3.Mohd Hanafiah K, Groeger J, Flaxman AD, Wiersma ST. Global epidemiology of hepatitis C virus infection: New estimates of age-specific antibody to HCV seroprevalence. Hepatology. 2012 doi: 10.1002/hep.26141. [DOI] [PubMed] [Google Scholar]
- 4.Hsu CS, et al. Early viral kinetics during treatment of chronic hepatitis C virus infection with pegylated interferon alpha plus ribavirin in Taiwan. Intervirology. 2007;50:310–315. doi: 10.1159/000105444. [DOI] [PubMed] [Google Scholar]
- 5.Aghemo A, Rumi MG, Colombo M. Pegylated IFN-alpha2a and ribavirin in the treatment of hepatitis C. Expert review of anti-infective therapy. 2009;7:925–935. doi: 10.1586/eri.09.70. [DOI] [PubMed] [Google Scholar]
- 6.Feld J, Hoofnagle J. Mechanism of action of interferon and ribavirin in treatment of hepatitis C. Nature. 2005;436:961–966. doi: 10.1038/nature04082. [DOI] [PubMed] [Google Scholar]
- 7.Kau A, Vermehren J, Sarrazin C. Treatment predictors of a sustained virologic response in hepatitis B and C. J Hepatol. 2008;49:634–651. doi: 10.1016/j.jhep.2008.07.013. [DOI] [PubMed] [Google Scholar]
- 8.Chevaliez S, Asselah T. Mechanisms of non-response to antiviral treatment in chronic hepatitis C. Clinics and research in hepatology and gastroenterology. 2011;35 Suppl 1:S31–41. doi: 10.1016/S2210-7401(11)70005-5. [DOI] [PubMed] [Google Scholar]
- 9.Lange CM, Zeuzem S. IL28B single nucleotide polymorphisms in the treatment of hepatitis C. J Hepatol. 2011;55:692–701. doi: 10.1016/j.jhep.2011.03.006. [DOI] [PubMed] [Google Scholar]
- 10.Thompson AJ, et al. Interleukin-28B polymorphism improves viral kinetics and is the strongest pretreatment predictor of sustained virologic response in genotype 1 hepatitis C virus. Gastroenterology. 2010;139:120–129 e118. doi: 10.1053/j.gastro.2010.04.013. [DOI] [PubMed] [Google Scholar]
- 11.Paulon E, Naoumov NV. Individualization of antiviral treatment regimens for chronic hepatitis C. European journal of gastroenterology & hepatology. 2006;18:321–325. doi: 10.1097/00042737-200604000-00003. [DOI] [PubMed] [Google Scholar]
- 12.Pawlotsky JM. Molecular diagnosis of viral hepatitis. Gastroenterology. 2002;122:1554–1568. doi: 10.1053/gast.2002.33428. [DOI] [PubMed] [Google Scholar]
- 13.Zeuzem S. The kinetics of hepatitis C virus infection. Clin Liver Dis. 2001;5:917–930. doi: 10.1016/s1089-3261(05)70201-4. [DOI] [PubMed] [Google Scholar]
- 14.Neumann A, et al. Hepatitis C viral dynamics in vivo and the antiviral efficacy of interferon-alpha therapy. Science. 1998;282:103–107. doi: 10.1126/science.282.5386.103. [DOI] [PubMed] [Google Scholar]
- 15.Snoeck E, et al. A comprehensive hepatitis C viral kinetic model explaining cure. Clinical pharmacology and therapeutics. 2010;87:706–713. doi: 10.1038/clpt.2010.35. [DOI] [PubMed] [Google Scholar]
- 16.Lara J, Xia G, Purdy M, Khudyakov Y. Coevolution of the hepatitis C virus polyprotein sites 1 in patients on combined pegylated interferon and ribavirin therapy. J Virol. 2011;85:3649–3663. doi: 10.1128/JVI.02197-10. [DOI] [PMC free article] [PubMed] [Google Scholar]
- 17.Campo D, Dimitrova Z, Mitchell R, Lara J, Khudyakov Y. Coordinated evolution of the hepatitis C virus. PNAS. 2008;105:9685–9690. doi: 10.1073/pnas.0801774105. [DOI] [PMC free article] [PubMed] [Google Scholar]
- 18.Lau DT, et al. Innate Immune Tolerance and the Role of Kupffer Cells in Differential Responses to Interferon Therapy Among Patients with HCV Genotype 1 Infection. Gastroenterology. 2012 doi: 10.1053/j.gastro.2012.10.044. [DOI] [PMC free article] [PubMed] [Google Scholar]
- 19.Ramachandran S, Xia GL, Ganova-Raeva LM, Nainan OV, Khudyakov Y. End-point limiting-dilution real-time PCR assay for evaluation of hepatitis C virus quasispecies in serum: performance under optimal and suboptimal conditions. J Virol Methods. 2008;151:217–224. doi: 10.1016/j.jviromet.2008.05.005. [DOI] [PubMed] [Google Scholar]
- 20.Skums P, et al. Efficient error correction for next-generation sequencing of viral amplicons. BMC Bioinformatics. 2012;13 Suppl 10:S6. doi: 10.1186/1471-2105-13-S10-S6. [DOI] [PMC free article] [PubMed] [Google Scholar]
- 21.Edgar R. MUSCLE: multiple sequence alignment with high accuracy and high throughput. Nucleic Acids Res. 2004;32:1792–1797. doi: 10.1093/nar/gkh340. [DOI] [PMC free article] [PubMed] [Google Scholar]
- 22.Nei M. Molecular evolutionary genetics. Columbia University Press; New York: 1987. [Google Scholar]
- 23.Schneider S, Roessli D, Excoffier L. Genetics and Biometry Laboratory. University of Geneva; Geneva: 2000. p. 120. [Google Scholar]
- 24.Excoffier L, Smouse PE, Quattro JM. Analysis of molecular variance inferred from metric distances among DNA haplotypes: application to human mitochondrial DNA restriction data. Genetics. 1992;131:479–491. doi: 10.1093/genetics/131.2.479. [DOI] [PMC free article] [PubMed] [Google Scholar]
- 25.Kosakovsky S, Frost S, Muse S. HyPhy: hypothesis testing using phylogenies. Bioinformatics. 2005;21:676–679. doi: 10.1093/bioinformatics/bti079. [DOI] [PubMed] [Google Scholar]
- 26.Bandelt H, Forster P, Rohl A. Median-Joining Networks For Inferring Intraspecific Phylogenies. Mol Biol Evol. 1999;16:37–48. doi: 10.1093/oxfordjournals.molbev.a026036. [DOI] [PubMed] [Google Scholar]
- 27.Skums P, et al. Numerical detection, measuring and analysis of differential interferon resistance for individual HCV intra-host variants and its influence on the therapy response. In Silico Biol. 2012;11:263–269. doi: 10.3233/ISB-2012-0460. [DOI] [PubMed] [Google Scholar]
- 28.Cade B, Richards J. User manual for BLOSSOM statistical software. Midcontinent Ecological Science Center US Geological Survey. 2001 [Google Scholar]
- 29.Mielke P, Berry K. Permutation methods: A distance function approach. Springer-Verlag; New York: 2001. [Google Scholar]
- 30.Cai L. Multi-response permutation procedure as an alternative to the analysis of variance: An SPSS implementation. Depart Psychol University N Carolina. 2004 doi: 10.3758/bf03192749. [DOI] [PubMed] [Google Scholar]