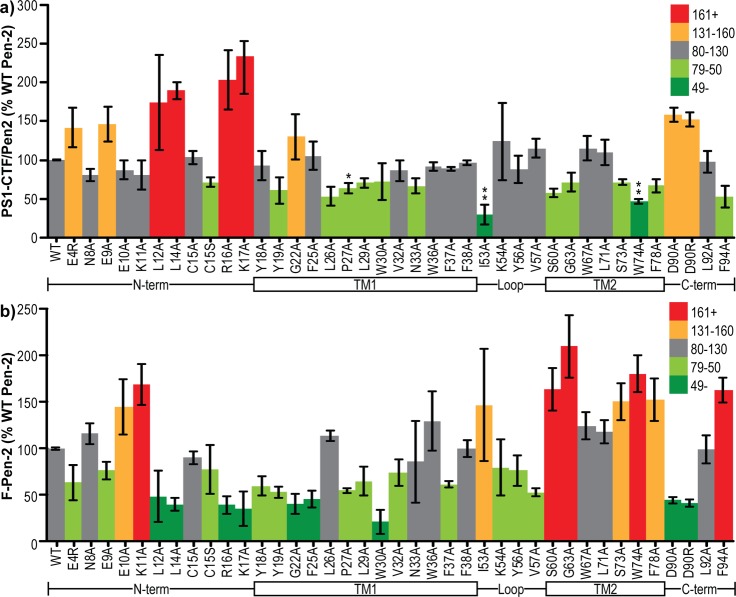
Figure 3.
Pen-2 mutants rescue PS1 endoproteolysis to varying degrees. (a) Band intensity of PS1-CTF per unit of F-Pen-2 normalized to internal controls of wild-type human F-Pen-2. Colors denote the values above and below the wild-type value. (b) Band intensity of F-Pen-2 mutants normalized to internal controls of wild-type human F-Pen-2. Colors denote the values above and below the wild-type value. The schematic below each graph aligns the regions of Pen-2 being mutated. Error bars show the standard error from 3–10 independent experiments. *P < 0.05. **P < 0.01. ***P < 0.001.

