

Abstract
Background
Hypertension is associated with cognitive deficits, particularly executive function, and decreased cerebral microvascular responsiveness to CO2 (CO2 vasoreactivity). The relation between CO2 vasoreactivity and executive function is not known. Protocols to assess CO2 vasoreactivity are cumbersome and require inhaling a CO2-enriched gas. We explored the ability to measure CO2 vasoreactivity using end-tidal CO2 fluctuations during normal breathing and the association of this measure with cognitive function in hypertension.
Methods
Executive function (Trail Making Test Parts A/B), memory, attention and blood flow velocity (BFV) in the middle cerebral artery using Transcranial Doppler were measured in hypertensive subjects who were tapered-off their treatment for 3 weeks. BFV was measured while sitting normally breathing for 5 minutes followed by breathing 5% CO2 gas and hyperventilation for 2 minutes each. We calculated CO2 vasoreactivity as the rate of BFV change from hypoventilation to hyperventilation, and as a modelderived measure using the normal breathing data. The latter was derived using nonlinear Principal Dynamic Modes (PDM) which modelled the dynamic effect of fluctuations in end-tidal CO2 and blood pressure upon BFV during normal room-air respiration. Multiple regression analyses were used to correlate cerebral hemodynamics with cognitive measures.
Results
Data were collected from 41 individuals with hypertension (mean age=71 years, 24% African Americans, 61% women, off antihypertensive therapy). Lower CO2 vasoreactivity was associated with worse executive function test score using both calculation methods: p-value using the hyper/hypoventilation data was 0.04 and from PDM analysis was 0.009. PDM calculations showed a stronger correlation with executive function (correlation=0.41 vs 0.21 using the hyper/hypoventilation data). There were no associations with memory or attention measures. There was a weak but statistically significant correlation between the two calculation methods of CO2 vasoreactivity (r2=14%, p=0.02).
Conclusion
This study suggests that, in hypertension, the decrease in CO2 vasoreactivity is associated with lower executive function. This may offer new insight into the vascular underpinning of cognitive decline in hypertension. We demonstrate that calculating CO2 vasoreactivity is possible during normal breathing. If replicated in future studies, this may offer a more convenient clinical way to assess CO2 vasoreactivity in hypertension and cognitive disorders.
Keywords: hypertension cerebral blood flow
Introduction
Hypertension leads to cognitive impairment and dementia.[1] Early on, hypertension is commonly associated with a decline in executive function that may predict future cognitive and functional loss.[2,3] It is suggested that this association is related to its effect on the microvasculature of the brain. Hypertension is also associated with decreased responsiveness to carbon dioxide (CO2)[4] which may be an early marker of microvascular dysfunction and impaired endothelial health.[5] We therefore hypothesized that lower CO2 vasoreactivity in hypertension is associated with lower executive function. To our knowledge, no prior study has explored this association in hypertensive individuals.
In healthy individuals, cerebral blood flow is tightly regulated to meet the metabolic demands of the brain. The ability to maintain this metabolic demand can be assessed using Transcranial Doppler. Two main indicators of cerebral hemodynamics have been commonly measured: (i) the ability to maintain cerebral blood flow velocity (BFV) during fluctuating perfusion pressure (autoregulation) and (ii) alterations in BFV due to arteriolar constriction or dilatation triggered by fluctuating end-tidal CO2 (CO2-vasoreactivity). Hypertension and aging are associated with decreased CO2-vasoreactivity but relatively preserved autoregulation. [6-8] Lower CO2-vasoreactivity is linked to an increased risk of vascular brain injury and death.[9,10]
Artificial changes in systemic blood pressure can be induced by standing. End-tidal CO2 can be induced by breath holding, breathing CO2 enriched air, or administering a dose of acetazolamide.[11] These maneuvers can be cumbersome. Further, prior methods of calculating CO2 vasoreactivity used linear modeling and frequency-dependent linear Transfer Functions.[12-15] End-tidal CO2 fluctuates during normal breathing. However, the relation between end tidal CO2 and BFV is nonlinear and there is low linear coherence at low frequencies. [16] Hence, the linear methods may not be very representative of the physiology of CO2 vasoreactivity during normal breathing. Deriving CO2-vasoreactivity measure from these fluctuations requires signal modelling methods that address these limitations (non-linearity and low frequency).
In this study, we aimed at investigating the association between BFV autoregulation and CO2 vasoreactivity with cognitive function in hypertension. We derived the CO2 vasoreactivity using a novel modeling method developed by our coauthor from the resting respiratory fluctuations of end-tidal CO2 as well as using conventional methods during breathing CO2-enriched air and hyperventilation. We compared the two methods in their correlation with cognitive function.
Materials and Methods
Study description and participants
This is an analysis of the baseline data collected on the participants of a randomized clinical trial. The study design of the original clinical trial was described elsewhere.[17] Briefly, this was a 12-month double-blind randomized controlled clinical trial of candesartan, lisinopril, or HCTZ. The data used in this analysis was collected at baseline. Inclusion criteria were: 60 years or older; hypertension (systolic blood pressure (SBP) of 140 mm Hg or greater or diastolic blood pressure (DBP) 90 mm Hg or greater or receiving antihypertensive medications); and executive dysfunction based on a score less than 10 on the executive clock draw test (CLOX1).[18] To exclude those with possible dementia we did not enroll those with a Mini-Mental-State-Exam (MMSE)<20 or those with a clinical diagnosis of Alzheimer's disease or other dementias. Exclusion criteria included: intolerance to the study medications; SBP >200 or DBP >110 mm Hg; elevated serum creatinine (>2.0 mg/dl) or serum potassium (5.3 meq/dl) at baseline; receiving more than two antihypertensive medications; congestive heart failure, diabetes mellitus; stroke; and inability to perform the study procedures or unwilling to stop currently used antihypertensive medications. Subjects were recruited from the greater Boston area.
Participants who were receiving antihypertensive medications were instructed to stop their current therapy. All participants were provided with a portable automated blood pressure monitor and study personnel trained each participant on the use of the blood pressure monitor. All participants received written instructions on tapering and discontinuation of antihypertensive medications and description of symptoms associated with possible adverse events. They were asked to measure blood pressure two times a day (morning and before sleep) and record them into a diary. Contact by the study personnel was twice weekly for review of blood pressures. The timeline for medication was a decrease by 25% to 50% during week 1, 50% to 75% during week 2, and 100% for week 3. Baseline measurements were performed after 3 weeks. Subjects with significant blood pressure elevations (SBP >180/100 mm Hg) for at least two consecutive times or who developed hypertension-related symptoms were excluded (failed taper), asked to resume their usual dose of antihypertensive medications, and were referred back to their primary care physician for chronic blood pressure management as usual. The Institutional Review Board of the Hebrew SeniorLife approved the study and all participants provided written informed consent. The study was also registered in ClinicalTrials.gov (NCT00605072).
Baseline measurements were made (when the patients were off antihypertensive medications). Neuropsychological assessments included the Trail Making Test (TMT) parts A, B. [19] TMT is a benchmark test for executive function. We also calculated TMT part B minus part A (B-A) which adjusts the TMT for the motor speed and dexterity of the participant.[20] We also used revised Hopkins Verbal Learning Test (HVLT), and the Digit Span Test (DST). The HVLT assesses both immediate and delayed recall and recognition abilities. The DST measures attention.
Cerebral Hemodynamic measurements
BFV was measured in the middle cerebral artery using Transcranial Doppler (TCD) ultrasonography (2-MHz probe placed over the temporal bone, MultiDop X4, DWL-Transcranial Doppler Systems Inc., Sterling, VA). Heart rate and blood pressure were simultaneously measured using continuous ECG recording and a Finometer™ (FMS, Finapress Measurement Systems, Arnhem, Netherlands). End-tidal CO2 was measured using a CO2 analyzer (VacuMed, Ventura, CA) attached to a nasal cannula. Measurements were obtained under the following conditions: (1) at rest while sitting for 5 minutes with normal breathing room-air; (2) during standing for 1 minute; (3) during breathing 8% CO2 air for 2 minutes; and (4) during hyperventilating for 2 minutes. Beat-to-beat values of BFV, blood pressure and end-tidal CO2 were computed off-line from these continuous measurements using the recorded R-R intervals of the ECG.
Calculation of cerebral hemodynamics indices
The obtained beat-to-beat time-series data were analysed offline using Matlab (Mathworks, Natik, MA). We used the data that were measured after being off all antihypertensive medications.
Autoregulation
Using the data obtained at rest and during the one minute stand, we calculated an index of autoregulation as the change in cerebrovascular resistance (CVR) denoted as delta-CVR. CVR is calculated as ratio of mean arterial pressure divided by BFV.
CO2 vasoreactivity
This was calculated as the rate or slope of the change in BFV vs end-tidal CO2 during breathing enriched CO2 and hyperventilation: , where Petco2 ranges from hypocapnia to hypercapnia.
Principal Dynamic Modes
We also used the method of Principal Dynamic Modes (PDM) to calculate CO2 vasoreactivity from 5-minute normal breathing data.[21,22] PDM constitute an efficient basis of reference functions for the representation of the system's kernels that can describe the dynamic relationship between input variables (e.g. blood pressure and end-tidal CO2) and output variables (e.g. BFV) in a reliable and compact manner. A diagrammatic representation of the PDM modelling approach is shown in Figure 1. Using the PDM-based models that have predictive capability, we can compute appropriate “physiomarkers” of cerebral autoregulation and vasoreactivity for each subject by simulating the resulting BFV changes for given changes of blood pressure and CO2, respectively, during normal breathing. These physiomarkers were computed as the time-average of the PDM-based model-predicted responses (beat-to-beat BFV) to step changes of end-tidal CO2 for vasoreactivity or arterial blood pressure for cerebral autoregulation relative to the respective baseline value over 30 seconds. The magnitude of the step change was set equal to one standard deviation of the actual CO2 or pressure data recorded in each subject (i.e. adjusted to the observed operating range of each subject) and was centered around the baseline CO2 or pressure value (i.e. the average of the respective recorded data). This magnitude varied between 2.4 mmHg and 4.7 mmHg for the pressure changes, and between 1.6 mmHg and 5.9 mmHg for the CO2 changes in this set of patients. In order to obtain credible PDM-based model estimates we need at least 3 min of reliable beat-to-beat dat.[23] We extracted the 3-minute data from the 5-minute data recorded at rest. Since CO2 may increase blood pressure, these model-based indices were computed under closed-loop conditions where such reciprocal effects (i.e. of blood flow and CO2 changes upon blood pressure) are also taken into account.[24] A full mathematical description of this method was described elsewhere.[25] The PDM-based models are not ad hoc models, but rather they are canonical representations of cerebral hemodynamics, yielding indices of physiological meaning. Specifically, the resulting PDM-based CO2 vasoreactivity index represents the time-average of BFV increase over 30 sec per unit of imposed of %change in end-tidal CO2 (cm/sec/%mmHg). Likewise, the resulting model-based cerebral autoregulation index represents the time-average of cerebral flow velocity increase (in the middle cerebral artery) over 30 sec per unit of imposed arterial pressure change (cm/sec/mmHg).
Figure 1.
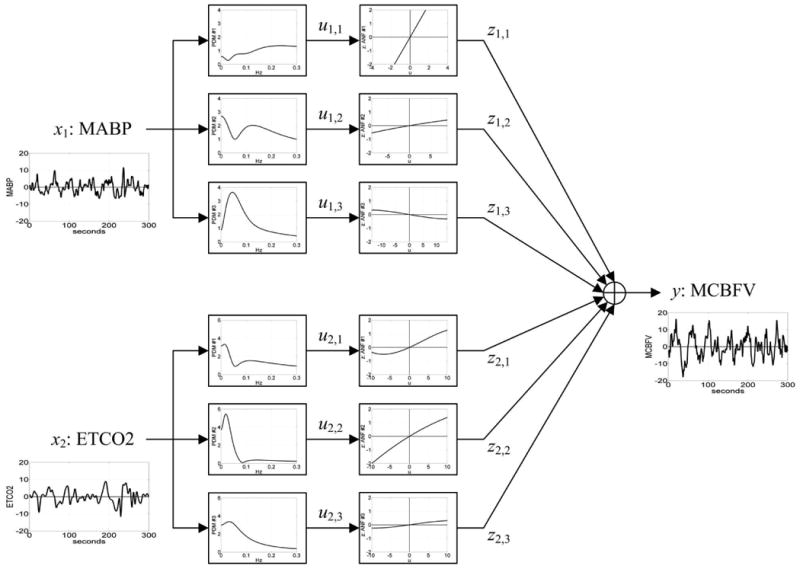
Block-diagram of PDM-based model of the cerebral hemodynamics with output y(t) the beat-to-beat Mean Cerebral Flow Velocity (MCBFV) and two inputs: x1(t) the Mean Arterial Blood Pressure (MABP) and x2(t) the End-Tidal CO2 (ETCO2). There are three PDMs for each of the two inputs shown in the diagram in the frequency domain (Transfer Functions) which are common for all subjects and are estimated from the data. The output uj,m(t) of the jth PDM for the mth input is the convolution of the PDM with the respective input (linear filter operation). The Associated Nonlinear Function (ANF) following each PDM is a cubic polynomial representing the system nonlinearities for the respective PDM and it is estimated from the data of each subject (subjectspecific). The output y(t) is the sum of all ANF outputs [zj,m] and a constant offset value c0.
Statistical analysis
Associations of the “traditional” and PDM-derived physiomarkers of cerebral hemodynamics with cognitive function were assessed using linear regression models: the cognitive score as the dependent variable and the physiomarkers as the independent variable. Trail Making Test (TMT) score distributions were skewed and hence we use natural logarithmic transformations. All regression models were adjusted for age and systolic blood pressure. To assess the degree of association between PDM-derived indices or the “traditional” linear physiomarkers with cognitive function we calculated two measures: the Pearson correlation and the Partial R2 (as a measure of the proportion of the explained variation in the cognitive test score by the physiomarkers) calculated form the multiple regression models.[26] The SAS statistical (Carey, NC) package was used for these analyses.
Results
Of the 63 eligible participants, 53 tapered their antihypertensive medications and were assessed at baseline. Of those 47(89%) had successful insonation of the middle cerebral artery. PDM-based indices were obtainable from 41 subjects because 6 had temporary displacement of the nasal cannula that reduced the available continuous time-series data-record to less than 3 min, which renders the indices inaccurate.
Basic clinical and hemodynamic characteristics are provided in Table 1. There was a weak but significant correlation between the CO2 vasoreactivity measures using the two methods of calculations: R2 for the correlation was 14%, p=0.02. This correlation was stronger during the hypoventilation phase of the hyper/hypoventilation protocol (R2 was 21% for hypoventilation and 1% for hyperventilation).
Table 1. Socio-demographic, clinical, neuropsychiatric, and cerebral hemodynamic characteristics of the final sample available for this analysis.
| Measure | Mean (Standard deviation) or number (frequency) |
|---|---|
| N | 41 |
| Age, years | 71 (7) |
| Women, % | 25 (61%) |
| African American, % | 10 (24%) |
| White, % | 29 (70%) |
| High school education or lower,% | 8 (20%) |
| College education or higher, % | 33 (80%) |
| Body Mass Index, Kg/m2 | 28.78 (6.09) |
| Baseline cognitive function | |
| Mini Mental State Examination | 26 (2) |
| Executive Clock Draw test | 8 (2) |
| Blood pressure and Heart Rate Sitting | |
| Systolic Blood Pressure, mm Hg | 151 (16) |
| Diastolic Blood pressure, mm Hg | 83 (9) |
| Heart rate, beats per min | 65 (9) |
| Cognitive function | |
| Trail Making Test-Part A, seconds | 37 (12) |
| Trail Making Test-Part B, seconds | 100 (45) |
| Trail Making Test-Part B-A, seconds | 63 (38) |
| Hopkins Verbal Learning Test, Recall | 8 (3) |
| Hopkins Verbal Learning Test, Recognition | 23 (2) |
| Digit Span, Forward | 6 (1) |
| Digit Span, Backward | 4 (2) |
| Cerebral Hemodynamics | |
| Sitting Blood Flow Velocity, cm/sec | 28.34 (6.54) |
| CO2-reactivity (slope of Blood Flow Velocity vsend-tidal CO2) | 0.51 (0.26) |
| CVR change (sit to stand) | -0.45 (0.52) |
| Principal Dynamic Modes indices | |
| Pressure Regulation Index | -0.13 (0.80) |
| CO2 Vasoreactivity index | 0.41 (1.10) |
After adjusting for age and systolic blood pressure, lower CO2 vasoreactivity calculated as the rate (slope) of the change in BFV vs the change in end-tidal CO2 during the hypo/hyperventilation procedure was associated with worse performance on executive function testing [TMT part B (p=0.009) and B-A (p=0.02)] but not the other cognitive domains as described in Table 2. Also, lower PDM-based index of CO2 reactivity was associated with worse performances on TMT Part B (p=0.05) and TMT Part B-A (p=0.009).
Table 2. Association between cognitive function and resting blood flow velocity, conventional CO2 vasoreactivity and autoregulation indices.
| Resting BFV | CO2 vasoreactivity | CVR change (sit-to-stand) | |
|---|---|---|---|
| β (SE), p-value | β (SE), p-value | β (SE), p-value | |
| TMT, Part A | 0.001(0.01), p=0.69 | -0.4(0.2), p=0.03 | 0.2(0.1), p=0.05 |
| TMT, Part B | -0.01(0.01), p=0.31 | -0.7(0.3), p=0.009 | -0.02(0.14), p=0.91 |
| TMT, Part B-A | -0.02(0.02), p=0.34 | -0.9(0.4), p=0.02 | -0.13(0.21), p=0.53 |
| HVLT, Recall | 0.11(0.07), p=0.13 | 0.4(1.8), p=0.83 | 0.95(0.9), p=0.3 |
| HVLT, recognition | 0.003(0.05), p=0.95 | 0.07(1.1), p=0.95 | 0.21(0.59), p=0.73 |
| Digit Span, Forward | -0.05(0.04), p=0.19 | -0.5(0.9), p=0.56 | -0.19(0.47), p=0.69 |
| Digit Span, Backwards | 0.2(0.22), p=0.38 | 0.5(1), p=0.61 | 0.3(0.54), p=0.59 |
BFV: Blood flow velocity; CVR : Cerebrovascular resistance; SE= standard error; TMT=Trail Making Test; B-A: Part B minus Part A; HVLT: Hopkins Verbal Learning Test. Slope (β), standard errors and p-values were obtained from the regression models adjusted for age and systolic blood pressure. TMT (A, B, and B-A) were transformed using a logarithmic transformation due to their skewed distribution.
Measures of association strength between executive function and CO2 vasoreactivity were higher for the PDM-derived index of CO2 vasoreactivity compared to the traditional measure: The Pearson correlation of TMT part B with the linear measure of CO2 reactivity was 0.26 and with the PDM-derived index was 0.32. The partial R2 was 0.07 for the traditional measure and 0.10 for the PDM-derived index. For TMT part B-A, the Pearson correlations were 0.22 for the traditional measure and 0.41 for the PDM-derived index. The partial R2 was 0.05 for the traditional vs 0.17 for the PDM-derived index. Illustrative scatter-plots with a fitted regression line of TMT Part B-A data versus the CO2-reactivity indices are shown in Figure 2.
Figure 2.

Scatter-plot and regression association between Trail Making Test, Part B-A included as the natural logarithm of Trail Making Test score (A) linear measure of CO2 vasoreactivity (cm/sec/mm Hg end-tidal CO2) and (B) PDM-derived measure of CO2 vasoreactivity (in cm/sec/%CO2 change). Partial R2 and p-values were obtained from the multiple regression models adjusting for age and mean systolic blood pressure.
Sitting BFV values and autoregulation (delta-CVR or PDM derived) were not related to executive function as shown in Table 3. There was no association between any cerebral hemodynamic measure and the scores on the HVLT or the forward and backward DST.
Table 3. Association between cognitive function and PDM derived indices of cerebrovascular reactivity and pressure autoregulation.
| CO2 Vasoreactivity | Pressure Autoregulation | |
|---|---|---|
| β (SE), p-value | β (SE), p-value | |
| TMT, Part A | 0.02(0.04), p=0.63 | 0.09(0.06), p=0.15 |
| TMT, Part B | -0.11(0.06), p=0.05 | 0.04(0.08), p=0.68 |
| TMT, Part B-A | -0.22(0.08), p=0.01 | 0.01(0.13), p=0.95 |
| HVLT, Recall | 0.4(0.38), p=0.3 | 0.04(0.54), p=0.94 |
| HVLT, recognition | 0.35(0.24), p=0.16 | -0.22(0.35), p=0.53 |
| Digit Span, Forward | -0.16(0.2), p=0.42 | -0.42(0.27), p=0.13 |
| Digit Span, Backwards | 0.2(0.22), p=0.38 | -0.16(0.32), p=0.63 |
SE= standard error; TMT=Trail Making Test; B-A: Part B minus Part A; HVLT: Hopkins Verbal Learning Test; Slope (β), standard errors and p-values were obtained from the regression models adjusted for age and systolic blood pressure. TMT (A, B, and B-A) were transformed using a logarithmic transformation due to their skewed distribution.
Discussion
Our main findings are: lower CO2 vasoreactivity may be associated with worse executive function in hypertensive older adults and calculating CO2 vasoreactivity using non-linear modelling technique from resting measurements of BFV and end-tidal CO2 normal breathing fluctuations is at least as useful as using the protocol of hypercapnia to hypocapnia. Our preliminary data suggest that the measure calculated using the normal breathing data might even be a stronger marker for executive function deficit in hypertension.
Although the underlying mechanisms are unknown, hypertension may preferentially affect executive function even in the absence of memory deficits. Prior studies have shown that hypertension is associated with a decline in CO2 vasoreactivity.[8] This study extends this association to show that the lower the CO2 vasoreactivity the worse the executive function performance. This suggests that damage to the microvasculature function may explain the observed predilection of atrophy in the prefrontal lobe and executive dysfunction with hypertension.[28] CO2 vasoreactivity may be a marker of endothelial-dependent dilatation and the ability to react to changes in PH in the arterioles.[29,30] Wide use of CO2 vasoreactivity has been limited by the need to induce wide alterations in end-tidal CO2 (e.g. hyperventilation or breath-holding). In this study we provide reliable quantitative means to assess CO2 vasoreactivity using only resting-state data of BFV, end-tidal CO2, and systemic blood pressure. The advanced mathematical modelling using PDMs can be automated to provide rapid, on-line physiomarkers of potential clinical utility (e.g. the vasoreactivity and autoregulation indices proposed herein) while the patient is being clinically assessed or shortly after. The present study provides a first step to making this approach clinically feasible.
Multiple prior mathematical models of cerebral blood flow regulation have been developed.[31] The PDM model-based indices in this study performed as good as or even better than the traditional CO2 vasoreactivity measures in explaining the variance in executive function performance. The relative ease of obtaining these measures, compared to a full hypercapnia/hypocapnia protocol, and their association with executive function, in contrast to memory or attention, provide further impetus to explore these measures in future research.
Hypertension is associated with decreased CO2 vasoreactivity and antihypertensive therapy has a significant effect on cerebral blood flow and hence our study may be more reflective of the underlying pathological changes that occur with hypertension. The relative small sample size is a limitation of this study. Another limitation is the lack of neuroimaging to confirm presence of microvascular disease, and the lack of measurement of intracranial pressure, which is an important factor in determining BFV. Despite these limitations, our data add critical information to the field that in hypertension lower CO2 vasoreactivity may be associated with lower executive function but not memory declines. It is a first and critical step in unravelling the complex relation between hypertension and cognition.
Conclusion
Our study suggests that lower CO2 vasoreactivity is associated with worse executive function. PDM-based modeling using BFV and end-tidal CO2 during normal breathing would decrease time and inconvenience of measuring this important vascular marker. Future research is needed on the utility of this measure in hypertensive brain health and related clinical trials.
Acknowledgments
Sources of Funding: Dr. Hajjar and the AVEC trial are supported by grant 1 K23 AG030057 from the National Institute on Aging. This work was supported in part by the Biomedical Simulations Resource at the University of Southern California under NIH/NIBIB grant P41-EB001978.
Abbreviations
- BFV
Blood flow velocity
- CO2
Carbon Dioxide
- Delta-CVR
change in cerebrovascular resistance from sit to stand
- DST
Digit span test
- HVLT
Hopkins verbal learning test
- PDM
Principal Dynamic Modes
- TCD
Transcranial Doppler
- TMT
Trail Making Test
Footnotes
Authors' contribution: Conception and design of this analysis: IH, VM, DC, HC; Data collection: IH; Modeling and derivation of modeling measures: VM, DC; Drafting the article or revising it critically for important intellectual content: IH, VM, HC
Competing interests: NONE
Contributor Information
Ihab Hajjar, Email: ihajjar@emory.edu, Division of Geriatrics & General Internal Medicine, Department of Medicine, Emory University, Atlanta, Georgia, Tel: 4047286595.
Vasilis Marmarelis, Department of Biomedical Engineering, University of Southern California, Los Angeles, California.
Dae C. Shin, Department of Biomedical Engineering University of Southern California, Los Angeles, California.
Helena Chui, Department of Neurology, University of Southern California, Los Angeles, California.
References
- 1.Novak V, Hajjar I. The relationship between blood pressure and cognitive function. Nature reviews Cardiology. 2010;7:686–698. doi: 10.1038/nrcardio.2010.161. [DOI] [PMC free article] [PubMed] [Google Scholar]
- 2.Vicario A, Martinez CD, Baretto D, Diaz Casale A, Nicolosi L. Hypertension and cognitive decline: Impact on executive function. J Clin Hypertens (Greenwich) 2005;7:598–604. doi: 10.1111/j.1524-6175.2005.04498.x. [DOI] [PMC free article] [PubMed] [Google Scholar]
- 3.Liu-Ambrose T, Pang MY, Eng JJ. Executive function is independently associated with performances of balance and mobility in community-dwelling older adults after mild stroke: Implications for falls prevention. Cerebrovascular diseases. 2007;23:203–210. doi: 10.1159/000097642. [DOI] [PMC free article] [PubMed] [Google Scholar]
- 4.Hajjar I, Zhao P, Alsop D, Novak V. Hypertension and cerebral vasoreactivity: A continuous arterial spin labeling magnetic resonance imaging study. Hypertension. 2010;56:859–864. doi: 10.1161/HYPERTENSIONAHA.110.160002. [DOI] [PMC free article] [PubMed] [Google Scholar]
- 5.Cohen RA. Hypertension and cerebral blood flow: Implications for the development of vascular cognitive impairment in the elderly. Stroke. 2007;38:1715–1717. doi: 10.1161/STROKEAHA.107.487165. [DOI] [PubMed] [Google Scholar]
- 6.Carey BJ, Eames PJ, Blake MJ, Panerai RB, Potter JF. Dynamic cerebral autoregulation is unaffected by aging. Stroke. 2000;31:2895–2900. doi: 10.1161/01.str.31.12.2895. [DOI] [PubMed] [Google Scholar]
- 7.Eames PJ, Blake MJ, Panerai RB, Potter JF. Cerebral autoregulation indices are unimpaired by hypertension in middle aged and older people. Am J Hypertens. 2003;16:746–753. doi: 10.1016/s0895-7061(03)00947-6. [DOI] [PubMed] [Google Scholar]
- 8.Lipsitz LA, Mukai S, Hamner J, Gagnon M, Babikian V. Dynamic regulation of middle cerebral artery blood flow velocity in aging and hypertension. Stroke. 2000;31:1897–1903. doi: 10.1161/01.str.31.8.1897. [DOI] [PubMed] [Google Scholar]
- 9.Portegies ML, de Bruijn RF, Hofman A, Koudstaal PJ, Ikram MA. Cerebral vasomotor reactivity and risk of mortality: The rotterdam study. Stroke. 2014;45:42–47. doi: 10.1161/STROKEAHA.113.002348. [DOI] [PubMed] [Google Scholar]
- 10.Yonas H, Smith HA, Durham SR, Pentheny SL, Johnson DW. Increased stroke risk predicted by compromised cerebral blood flow reactivity. Journal of neurosurgery. 1993;79:483–489. doi: 10.3171/jns.1993.79.4.0483. [DOI] [PubMed] [Google Scholar]
- 11.Totaro R, Marini C, Baldassarre M, Carolei A. Cerebrovascular reactivity evaluated by transcranial doppler: Reproducibility of different methods. Cerebrovascular diseases. 1999;9:142–145. doi: 10.1159/000015943. [DOI] [PubMed] [Google Scholar]
- 12.Aoi M, Gremaud P, Tran HT, Novak V, Olufsen MS. Modeling cerebral blood flow and regulation. Conf Proc IEEE Eng Med Biol Soc. 2009;2009:5470–5473. doi: 10.1109/IEMBS.2009.5334057. [DOI] [PubMed] [Google Scholar]
- 13.Peterson EC, Wang Z, Britz G. Regulation of cerebral blood flow. Int J Vasc Med. 2011;2011:523–525. doi: 10.1155/2011/823525. [DOI] [PMC free article] [PubMed] [Google Scholar]
- 14.Giller CA. The frequency-dependent behavior of cerebral autoregulation. Neurosurgery. 1990;27:362–368. doi: 10.1097/00006123-199009000-00004. [DOI] [PubMed] [Google Scholar]
- 15.Zhang R, Zuckerman JH, Giller CA, Levine BD. Transfer function analysis of dynamic cerebral autoregulation in humans. Am J Physiol. 1998;274:H233–241. doi: 10.1152/ajpheart.1998.274.1.h233. [DOI] [PubMed] [Google Scholar]
- 16.Mitsis GD, Ainslie PN, Poulin MJ, Robbins PA, Marmarelis VZ. Nonlinear modeling of the dynamic effects of arterial pressure and blood gas variations on cerebral blood flow in healthy humans. Adv Exp Med Biol. 2004;551:259–265. doi: 10.1007/0-387-27023-x_39. [DOI] [PubMed] [Google Scholar]
- 17.Hajjar I, Hart M, Milberg W, Novak V, Lipsitz L. The rationale and design of the antihypertensives and vascular, endothelial, and cognitive function (avec) trial in elderly hypertensives with early cognitive impairment: Role of the renin angiotensin system inhibition. BMC Geriatr. 2009;9:48. doi: 10.1186/1471-2318-9-48. [DOI] [PMC free article] [PubMed] [Google Scholar]
- 18.Royall DR, Cordes JA, Polk M. Clox: An executive clock drawing task. Journal of neurology, neurosurgery, and psychiatry. 1998;64:588–594. doi: 10.1136/jnnp.64.5.588. [DOI] [PMC free article] [PubMed] [Google Scholar]
- 19.Gordon NG. The trail making test in neuropsychological diagnosis. J Clin Psychol. 1972;28:167–169. doi: 10.1002/1097-4679(197204)28:2<167::aid-jclp2270280212>3.0.co;2-x. [DOI] [PubMed] [Google Scholar]
- 20.Corrigan JD, Hinkeldey NS. Relationships between parts a and b of the trail making test. J Clin Psychol. 1987;43:402–409. doi: 10.1002/1097-4679(198707)43:4<402::aid-jclp2270430411>3.0.co;2-e. [DOI] [PubMed] [Google Scholar]
- 21.Marmarelis VZ, Shin DC, Orme ME, Zhang R. Model-based quantification of cerebral hemodynamics as a physiomarker for Alzheimer's disease? Ann Biomed Eng. 2013;41:2296–2317. doi: 10.1007/s10439-013-0837-z. [DOI] [PMC free article] [PubMed] [Google Scholar]
- 22.Marmarelis VZ, Shin DC, Orme ME, Zhang R. Closed-loop dynamic modeling of cerebral hemodynamics. Ann Biomed Eng. 2013;41:1029–1048. doi: 10.1007/s10439-012-0736-8. [DOI] [PMC free article] [PubMed] [Google Scholar]
- 23.Mitsis GD, Poulin MJ, Robbins PA, Marmarelis VZ. Nonlinear modeling of the dynamic effects of arterial pressure and co2 variations on cerebral blood flow in healthy humans. IEEE Trans Biomed Eng. 2004;51:1932–1943. doi: 10.1109/TBME.2004.834272. [DOI] [PubMed] [Google Scholar]
- 24.Garnham J, Panerai RB, Naylor AR, Evans DH. Cerebrovascular response to dynamic changes in pco2. Cerebrovascular diseases. 1999;9:146–151. doi: 10.1159/000015944. [DOI] [PubMed] [Google Scholar]
- 25.Marmarelis VZ, Shin DC, Orme ME, Zhang R. Closed-loop dynamic modeling of cerebral hemodynamics. Ann Biomed Eng. 2013;41:1029–1048. doi: 10.1007/s10439-012-0736-8. [DOI] [PMC free article] [PubMed] [Google Scholar]
- 26.Guilford JP, Fruchter B. Fundamental statistics in psychology and education. 6th. New York: McGraw-Hill; 1978. [Google Scholar]
- 27.Hajjar I, Yang F, Sorond F, Jones RN, Milberg W, Cupples LA, Lipsitz LA. A novel aging phenotype of slow gait, impaired executive function, and depressive symptoms: Relationship to blood pressure and other cardiovascular risks. The journals of gerontology Series A, Biological sciences and medical sciences. 2009;64:994–1001. doi: 10.1093/gerona/glp075. [DOI] [PMC free article] [PubMed] [Google Scholar]
- 28.Raz N, Rodrigue KM, Acker JD. Hypertension and the brain: Vulnerability of the prefrontal regions and executive functions. Behavioral neuroscience. 2003;117:1169–1180. doi: 10.1037/0735-7044.117.6.1169. [DOI] [PubMed] [Google Scholar]
- 29.Heistad DD, Mayhan WG, Coyle P, Baumbach GL. Impaired dilatation of cerebral arterioles in chronic hypertension. Blood Vessels. 1990;27:258–262. doi: 10.1159/000158817. [DOI] [PubMed] [Google Scholar]
- 30.Mayhan WG, Faraci FM, Heistad DD. Impairment of endothelium-dependent responses of cerebral arterioles in chronic hypertension. Am J Physiol. 1987;253:H1435–1440. doi: 10.1152/ajpheart.1987.253.6.H1435. [DOI] [PubMed] [Google Scholar]
- 31.Gao E, Young WL, Pile-Spellman J, Ornstein E, Ma Q. Mathematical considerations for modeling cerebral blood flow autoregulation to systemic arterial pressure. Am J Physiol. 1998;274:H1023–1031. doi: 10.1152/ajpheart.1998.274.3.H1023. [DOI] [PubMed] [Google Scholar]