

Abstract
Objective
The Polycomb Repressive Complexes (PRC) 1 and 2 function to epigenetically repress target genes. The PRC1 component, Bmi1, plays a crucial role in maintenance of glucose homeostasis and beta cell mass through repression of the Ink4a/Arf locus. Here we have explored the role of Bmi1 in regulating glucose homeostasis in the adult animal, which had not been previously reported due to poor postnatal survival of Bmi1−/− mice.
Methods
The metabolic phenotype of Bmi1+/− mice was characterized, both in vivo and ex vivo. Glucose and insulin tolerance tests and hyperinsulinemic-euglycemic clamps were performed. The insulin signaling pathway was assessed at the protein and transcript level.
Results
Here we report a negative correlation between Bmi1 levels and insulin sensitivity in two models of insulin resistance, aging and liver-specific insulin receptor deficiency. Further, heterozygous loss of Bmi1 results in increased insulin sensitivity in adult mice, with no impact on body weight or composition. Hyperinsulinemic-euglycemic clamp reveals increased suppression of hepatic glucose production and increased glucose disposal rate, indicating elevated glucose uptake to peripheral tissues, in Bmi1+/− mice. Enhancement of insulin signaling, specifically an increase in Akt phosphorylation, in liver and, to a lesser extent, in muscle appears to contribute to this phenotype.
Conclusions
Together, these data define a new role for Bmi1 in regulating insulin sensitivity via enhancement of Akt phosphorylation.
Keywords: Polycomb Repressive Complex, Hepatic glucose production, Insulin signaling, Muscle glucose uptake
1. Introduction
Type 2 diabetes is characterized by a relative insulin deficiency and is associated with insulin resistance in the peripheral tissues. Insulin resistance has been shown to be associated with aging, thus exacerbating the risk for disease development with age [1]. At first, pancreatic beta cells are able to compensate by releasing more insulin. As insulin resistance progresses, the beta cells fail, resulting in overt diabetes. Insulin signals to peripheral tissues to take up glucose and to halt hepatic glucose production and lipolysis. An insulin resistance state impairs these responses, causing hyperglycemia, leading to vascular, nerve and renal complications, among others. At this time, many aspects of the molecular progression of insulin resistance remain unclear.
Polycomb group (PcG) proteins assemble into multi-subunit complexes and repress target genes. PRC2 (Polycomb Repressive Complex 2) initiates repression and PRC1 maintains repression via histone methyltransferase and ubiquitin E3 ligase activities, respectively [2,3]. Bmi1 is a member of PRC1 and is necessary for full activity of the complex. The classically studied targets of the Polycomb complexes are the Ink4a/Arf locus and the Hox gene clusters, which PRC1 and PRC2 function to repress. Regulation of the Ink4a/Arf locus has been studied particularly extensively due to the impact of this locus on cancer progression and stem cell self-renewal. Overexpression of Bmi1 allows rapid proliferation, eventually leading to immortalization of mouse embryonic fibroblasts in culture [4]. Bmi1 was initially identified as an oncogene that cooperates with c-myc in B cell lymphomagenesis and was named as such: B cell-specific Moloney Murine Leukemia Virus integration site 1 [5,6,10,7]. Bmi1 was later found to be involved in cell cycle progression and to be necessary for hematopoietic and neural stem cell renewal, as Bmi1-deficient mice have severe hematopoietic and neurological abnormalities [9,11].
The most well-characterized target of Bmi1 is the Ink4a/Arf locus, which encodes two key regulators of cell cycling, p16 (Ink4a) and p19 (Arf). While some Bmi1 null phenotypes can be fully explained by regulation of this locus, others cannot. For instance, the loss of self-renewal capability in Bmi1−/− neural stem cells is completely rescued by concomitant deletion of Ink4a/Arf [9]. Additionally, the drastic reduction in proliferation after Bmi1 knockdown is completely rescued by knockdown of Ink4a in cultured mouse islets [10]. In contrast, Bmi1 null mice have a 50% reduction in body weight that is not significantly rescued by the genetic loss of either Arf alone or both Ink4a and Arf [9]. Similarly, the severe hematopoietic deficiency of Bmi1 null mice is only partially rescued by co-deletion of Ink4a/Arf [11]. These observations have contributed to the recognition that Bmi1 (and PRC1) regulates targets beyond Ink4a/Arf, the identity of which are only beginning to be understood. Complicating the identification of Bmi1 targets is the lack of a clear consensus binding sequence that defines the location to which PRC complexes are recruited [12,13].
The severe phenotypes limiting postnatal survival of Bmi1 null mice have precluded exploration of the role of Bmi1 in regulating glucose homeostasis in the adult animal. Here, we study the metabolic role of Bmi1 in adult Bmi1+/− mice and, surprisingly, find enhanced insulin sensitivity in vivo and enhanced insulin signaling in liver and muscle, thereby defining a novel metabolic role of Bmi1.
2. Materials and methods
2.1. Animals and physiological experiments
All animal experiments were performed according to procedures approved by the Institutional Animal Care and Use Committee of the University of Pennsylvania. Animals were placed on high fat diet (60% fat), low fat diet (10% fat) (Research Diets Inc., New Brunswick, NJ) or standard chow (12.7% fat; LabDiet, St. Louis, MO) at weaning. Bmi1+/− mice were previously described [8]. Mice were maintained on a C57BL/6N background. All experiments were performed on males 15–18 weeks of age, except where otherwise noted. For glucose tolerance tests, 18 week old males were fasted overnight, given 1 g/kg glucose via intra-peritoneal (IP) injection and blood glucose was measured by handheld glucometer at 0, 15, 30, 60, and 120 min after injection. For insulin tolerance tests, animals were fasted 6 h prior to IP injection of 1.0 or 1.5 U/kg insulin (NovolinR, Novo Nordisk, Princeton, NJ) and blood glucose was measured by handheld glucometer at 0, 15, 30, 60, and 120 min after injection. For insulin secretion assays, blood was collected at time 0 and 3 min after glucose bolus. Insulin concentration was measured by ELISA (Crystal Chem Inc., Downers Grove, IL).
Liver-specific insulin receptor knockout (LIRKO) mice have been described previously [14]. Physiological measurements were taken and livers harvested from LIRKO and control littermates at 6 months of age for further analysis.
2.2. Body composition measurements
Body composition was assessed using a 3-in-1 NMR machine by EchoMRI (Houston, TX).
2.3. Hyperinsulinemic-euglycemic clamp
Hyperinsulinemic-euglycemic clamp was performed according to previously published procedures [15–17]. Briefly, [3–3H] glucose was used to measure baseline glucose kinetics. The hyperinsulinemic clamp utilized a continuous infusion of 2.5 mU/kg/min insulin (Humulin; Eli Lilly, Indianapolis, IN) and a variable intravenous infusion of 20% glucose (w/v) to maintain blood glucose levels at 120–140 mg/dL. 2-deoxy-D-[1-14C] glucose was used to estimate glucose uptake.
2.4. Stimulation of insulin signaling pathways
For analysis of Akt phosphorylation, 15-week-old males were injected IP with saline or 1.125 U/kg insulin. Tissues were harvested 20 min later and snap-frozen for later use. For analysis of other insulin signaling components, 5 U insulin was injected into the inferior vena cava of 15-week-old males. Tissues were harvested 2 min later and snap-frozen for later use.
2.5. Western blot analysis
Livers, gastrocnemius muscles, and isolated hepatocytes were sonicated in lysis buffer (50 mM Tris–Cl, pH 7.8, 2% SDS, 10% glycerol, 10 mM Na4P2O7, 100 mM NaF, 6 M urea, 10 mM EDTA). Proteins were resolved by SDS-PAGE and immunoblotted with the following antisera: rabbit anti-Akt (1:1000, Cell Signaling), rabbit anti-phospho-Akt (1:1000, Cell Signaling), mouse anti-Ran (1:10,000, BD Biosciences), mouse anti-Bmi1 (1:1000, Millipore), rabbit anti-p-ERK1/2 (1:1000, Cell Signaling), rabbit anti-ERK1/2 (1:1000, Cell Signaling), mouse anti-p-STAT5 (1:1000, upstate), rabbit anti-STAT5 (1:1000, Santa Cruz), rabbit anti-p-IRS1 (1:1000, Millipore), rabbit anti-IRS1 (1:1000, Santa Cruz), rabbit anti-p-IR/IGFR (1:1000, Cell Signaling), rabbit anti-IR/IGFR (1:1000, Cell Signaling), mouse anti-tubulin (1:10,000, Sigma). Blots were quantified using ImageJ software.
2.6. RNA isolation and quantitative RT-PCR
Total RNA was isolated from snap-frozen liver using Trizol (Invitrogen, Carlsbad, CA), according to the manufacturer's instructions. Ribosome-associated RNA was isolated using the RNeasy mini kit (Qiagen). DNA was digested using the TURBO DNA-free kit (Life Technologies). RNA concentrations were measured on a Nanodrop ND-1000 spectrophotometer (Thermo-Scientific, Wilmington, DE). RNA integrity was assessed using an Agilent 2100 Bioanalyzer (Agilent Technologies, Santa Clara, CA). To synthesize cDNA, RNA was reverse-transcribed with SuperScript III (Invitrogen) according to manufacturer's instructions. Quantitative real time PCR was performed on a Bio-Rad CFX384 384-well thermal cycler.
2.7. Hepatocyte isolation
Hepatocytes were isolated from 15-week-old male mice following a 5 h fast using Liver Perfusion Media (Invitrogen, Carlsbad, CA) and Kreb's Ringer Bicarbonate Buffer (Sigma, St. Louis, MO) supplemented with Collagenase and DNase (Worthington Biochemical Corporation, Lakewood, NJ) with a modified two-step perfusion protocol [18]. Hepatocytes were seeded at a density of 2.5 × 10⁵ cells per well in collagen-I-coated 12-well plates M199 media plus 10% FBS plus penicillin/streptomycin. Cells were allowed to attach ∼2 h prior to 2 h serum starvation. Cells were then treated with the indicated concentrations of insulin for 20 min.
2.8. Statistical analysis
All data are represented as mean ± SEM. Statistical significance was assessed by two-tailed Student's t test or two-way ANOVA (Prism GraphPad).
3. Results
3.1. Bmi1 levels correlate inversely with age and insulin sensitivity
The decline in Bmi1 transcript and protein early in life has been well-described in the beta cells [19]. However, to date, no studies have explored Bmi1 levels with age in liver. Livers were harvested from C57BL/6N mice 2 weeks, 8 weeks, 16 weeks, and 24 weeks of age. Between 2 weeks and 8 weeks, there was a marked decline in Bmi1 protein, correlating with observations in other tissues (Figure 1A). Surprisingly, in older animals there was a dramatic increase in protein levels. Given the well-established decline in insulin sensitivity with age, we hypothesized that Bmi1 protein is correlated to serum insulin levels and/or insulin sensitivity.
Figure 1.
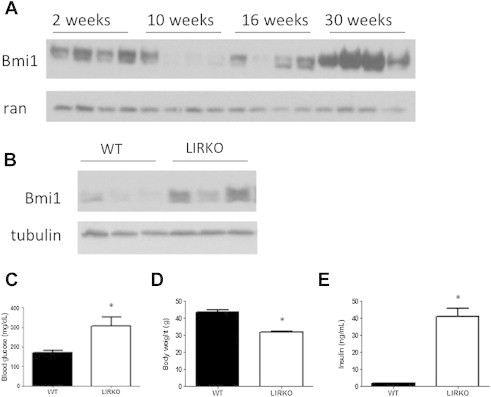
Bmi1 levels correlate positively with age and insulin resistance. (A) Livers harvested from wildtype mice of indicated ages. Western blots of lysates from snap-frozen tissue showing levels of Bmi1 protein with age. (B–E) 6-month-old LIRKO and control littermates. (B) Western blots of lysates from snap-frozen tissue showing levels of Bmi1 protein. (C) Blood glucose levels, (D) body weight, and (E) circulating insulin levels from LIRKO and control animals. *p < 0.05.
To determine whether Bmi1 levels correlate inversely with insulin sensitivity in another model, we examine Bmi1 levels in the LIRKO (liver insulin receptor knockout) model of insulin resistance. LIRKO mice display reduced body weight, severe fed hyperglycemia and hyperinsulinemia, as well as an abolishment of insulin-induced suppression of hepatic glucose production [14]. Notably, Bmi1 protein levels were increased in the livers of 6-month-old LIRKO mice, compared to control littermates (Figure 1B). Consistent with insulin resistance, these LIRKO animals displayed the expected phenotypes of hyperglycemia, hyperinsulinemia, and reduced body weight (Figure 1C–E). Thus, Bmi1 protein levels are inversely correlated with insulin sensitivity in two well-established models of insulin resistance.
3.2. Bmi1+/− mice are partially protected from HFD-induced insulin resistance
To assess the potential role of Bmi1 in insulin sensitivity, we characterized glucose homeostasis of Bmi1-deficient mice. In order to exacerbate what we predicted might be a mild phenotype, Bmi1+/− males and Bmi1+/+ littermates were placed on a high fat diet at weaning and followed through 18 weeks of age. Bmi1 heterozygosity resulted in an approximate 60% reduction in Bmi1 protein (Figure 2A). High fat diet induced an equivalent degree of weight gain in both genotypes (Figure 2D). Surprisingly, glucose tolerance was not worse in Bmi1+/− mice, rather there was a trend toward improved glucose tolerance (Figure 2B; p = 0.12 by two-way ANOVA for HFD-fed Bmi1+/+ vs HFD-fed Bmi1+/−). Insulin tolerance testing (ITT) revealed that Bmi1 heterozygosity confers partial protection from high fat diet-induced insulin resistance (Figure 2C; p = 0.0095 by two-way ANOVA for HFD-fed Bmi1+/+ vs HFD-fed Bmi1+/−). Bmi1 null animals have multiple phenotypes resulting from severe deficiencies in cell replication, including stunted growth [8]. In contrast, body weight and composition were indistinguishable between Bmi1+/+ and Bmi1+/− littermates (Figure 2D–E). These observations indicate that the role of Bmi1 in whole-body insulin sensitivity is independent of body weight or adiposity.
Figure 2.
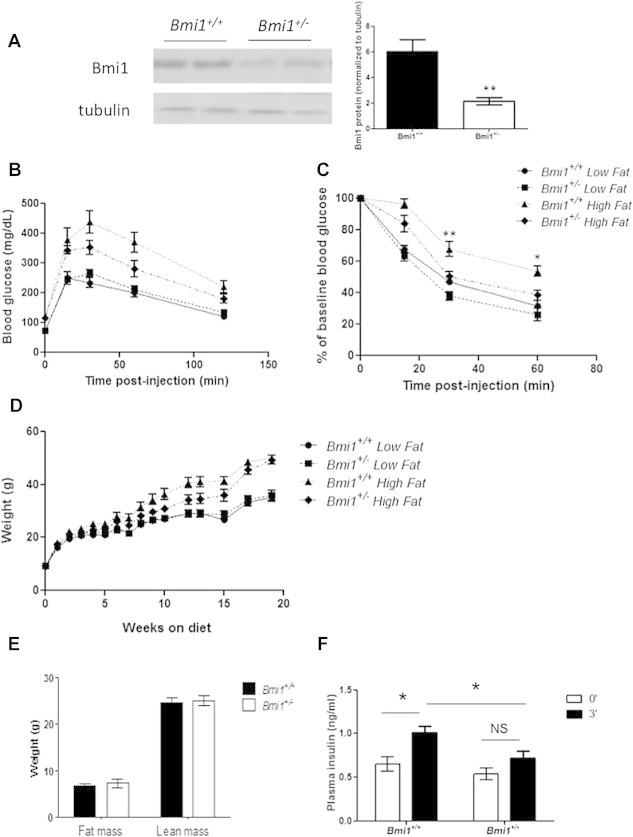
Bmi1+/− mice are partially protected from high fat diet-induced insulin resistance and require less insulin to maintain glucose homeostasis. (A) Western blots of lysates from Bmi1+/+ and Bmi1+/− male liver lysates showing levels of Bmi1 protein. Quantification of western blots from 5 animals per genotype. (B–C) Glucose and insulin tolerance tests of 16–18 week old LFD and HFD-fed Bmi1+/+ and Bmi1+/− males (B) 1 g/kg IP glucose bolus, p= 0.1211 by two-way ANOVA for HFD Bmi1+/+ vs HFD Bmi1+/− and (C) 1.5 U/kg IP insulin, p = 0.0095 by two-way ANOVA for HFD Bmi1+/+ vs HFD Bmi1+/−. (D) Body weights of LFD and HFD-fed Bmi1+/+ and Bmi1+/− males. (E) Lean and fat mass unaffected in HFD Bmi1+/+ and Bmi1+/− mice at 29 weeks of age, as measured by NMR. n = 7–8 mice per genotype for all assessments. *p < 0.05 **p < 0.01 vs Bmi1+/+ (F) Plasma insulin at 0 and 3 min after 2 g/kg IP glucose bolus. *p < 0.05; n = 13–15 per genotype.
3.3. Bmi1 null mice may be hypersensitive to insulin
Impaired glucose tolerance at an early age due to reduced insulin secretion has been observed in Bmi1 null animals [10]. This phenotype was recapitulated in our hands, with marked hyperglycemia evident at 10 weeks of age (Supp. Figure 1A); however, we also observed a trend toward hyper-responsiveness to insulin on insulin tolerance testing (Supp. Figure 1B). Due to grossly impaired survival of Bmi1 null mice beyond weaning, this observation could not be extended. However, combined with our observations of adult Bmi1+/− animals, these data suggest a gene dosage dependent role of Bmi1 in whole animal insulin sensitivity.
3.4. Bmi1+/− mice require less circulating insulin to maintain glucose homeostasis
Similar to HFD-fed Bmi1+/− mice, Bmi1+/− mice fed a low fat diet (LFD) had normal glucose tolerance (Figure 2B). Although insulin sensitivity was not different between LFD-fed Bmi1+/− mice and wild type littermates, we observed lower insulin secretion in response to a glucose bolus in Bmi1+/− animals (Figure 2C,F). In contrast to Bmi1−/− mice, in which decreased insulin secretion due to reduced beta cell mass is associated with marked impairment of glucose homeostasis, the reduction of insulin in the face of normal glucose tolerance in LFD-fed Bmi1+/− mice suggests an appropriate adaptive response to enhanced insulin sensitivity.
3.5. Hyperinsulinemic-euglycemic clamp reveals increased insulin sensitivity in low fat diet-fed Bmi1+/− mice
We hypothesized that a more sensitive measure might reveal an insulin sensitivity phenotype in these animals. Therefore, we assessed insulin sensitivity in LFD-fed mice using a hyperinsulinemic-euglycemic clamp. There was no difference in basal blood glucose or hepatic glucose production (HGP; Figure 3A–B); however, Bmi1+/− mice required a glucose infusion rate (GIR) more than twice that of Bmi1+/+ mice to maintain the target blood glucose level of 120–140 mg/dl, echoing our previous observations of improved whole-body insulin sensitivity (Figure 3C). The suppression of HGP by insulin during the clamp was greatly increased in Bmi1+/− mice (Figure 3D; 77% suppression vs 40% in controls; p = 6.5 × 10⁻⁵), suggesting that Bmi1 heterozygosity results in greater responsiveness of the liver to insulin stimulation. During the clamp, the glucose disposal rate (Rd) was 67% higher in Bmi1+/− mice (Figure 3E; p = 0.0011), indicating a difference in responsiveness of peripheral tissues to insulin as well. Glucose uptake to muscle was elevated 57% (Figure 3F; p = 0.06), while there was no difference in glucose uptake to adipose tissue (Figure 3G). Together, these results suggest a role for Bmi1 in modulation of insulin signaling in liver and possibly muscle. Given the robust phenotype observed in liver, we first examined insulin signaling in that tissue.
Figure 3.
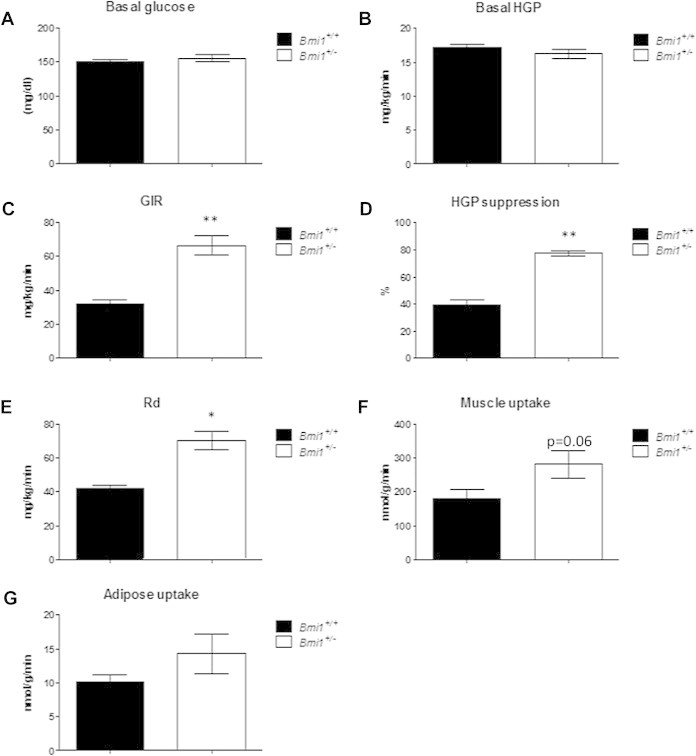
Hyperinsulinemic-euglycemic clamp reveals increased insulin sensitivity in low fat diet-fed Bmi1+/− mice. Hyperinsulinemic-euglycemic clamp performed on 30 week-old males on LFD. Target glucose 120–140 mg/dL n = 5 mice per genotype. (A) Basal blood glucose levels, (B) basal hepatic glucose production, and (C) glucose infusion rate during clamp. Radioactive tracers were administered and quantitated to calculate (D) hepatic glucose suppression, (E) glucose disposal rate, and glucose uptake to muscle (F) and adipose tissue (G). *p < 0.005 compared to Bmi1+/+; **p < 0.001 compared to Bmi1+/+.
3.6. Hepatic insulin signaling is enhanced by Bmi1 heterozygosity
After a 5 h fast to minimize stimulation by endogenous insulin, Bmi1+/+ and Bmi1+/− mice were injected IP with saline or insulin 20 min prior to sacrifice. Western blot analysis of liver lysates revealed no effect of either genotype or insulin treatment on total Akt levels (Figure 4A); however, Akt phosphorylation levels in heterozygous mice were lower at baseline as compared to controls, suggesting reduced basal insulin signaling in Bmi1+/− livers. This supports the observation from whole animal physiology that less insulin is needed to maintain normal glucose homeostasis in the Bmi1 heterozygous animals (Figure 2F). Upon insulin stimulation, Akt phosphorylation was higher in Bmi1+/− liver lysates, compared to controls, indicating enhanced signal transduction in response to insulin (Figure 4A–B; 2.2-fold change in Bmi1+/+ vs 8.9-fold in Bmi1+/−).
Figure 4.

Hepatic insulin signaling is enhanced by Bmi1 heterozygosity. (A–B) 15-week-old males fasted 5 h and then injected IP with saline or 1.125 U/kg insulin. Livers harvested 20 min later and lysates assessed by western blot. (A) Representative Western blots showing levels of phospho-Akt and total Akt. Ran immunoreactivity was used as the loading control. (B) Quantification of phospho- and total Akt levels. The ratio of phospho-Akt/total Akt is shown. n = 4–5 per genotype and treatment. *p < 0.05 vs Bmi1+/+ saline; **p < 0.05 vs Bmi1+/+ insulin. (C–D) Cultured hepatocytes isolated from 15-week-old males treated with indicated dose of insulin for 20 min prior to harvest. Lysates assessed by western blot. (C) Representative Western blots showing levels of phospho-Akt and total Akt. (D) Quantification of phospho- and total Akt levels. The ratio of phospho-Akt/total Akt is shown. Results shown obtained from n = 5 independent hepatocyte isolations per genotype. p < 0.001 by two-way ANOVA. *p < 0.05 vs WT; **p < 0.001 vs WT.
To determine whether these findings reflect an alteration of insulin sensitivity within hepatocytes, we performed studies in cultured primary hepatocytes isolated from Bmi1+/+ and Bmi1+/− mice. Here we compared total and phosphorylated Akt levels in response to a range of insulin doses. Hepatocytes isolated from Bmi1+/− animals had detectable levels of Akt phosphorylation at lower doses of insulin as compared to Bmi1+/+ hepatocytes (Figure 4C–D). Additionally, the maximal level of Akt phosphorylation was higher in these hepatocytes. Together, these experiments suggest a hepatocyte-autonomous role for Bmi1 in modulating sensitivity of insulin signaling, specifically Akt phosphorylation.
3.7. Activity of early insulin signaling pathway not altered in Bmi1+/− mice
In order to further investigate the effect of Bmi1 heterozygosity on insulin signaling, critical signaling events upstream of and parallel to Akt phosphorylation were assessed by immunoblot (Figure 5A). The first step in the insulin signaling pathway, insulin receptor phosphorylation, showed a comparable response to insulin in both groups, although there was a slight increase in basal levels of IR phosphorylation in Bmi1+/− animals (Figure 5B). Similarly, there was no statistically significant difference in IRS1 phosphorylation between genotypes when stimulated by insulin, although a trend toward reduced IRS1 phosphorylation was observed at baseline in the Bmi1+/− animals (p = 0.07) (Figure 5C). As an important pathway parallel to Akt signaling, ERK1/2 phosphorylation was also measured. The response to insulin was variable at this time point and no significant difference was observed between genotypes (Figure 5D).
Figure 5.

Early insulin signaling in liver unaffected by Bmi1 heterozygosity. (A–D) 15 week old males fasted for 5 h and then injected with saline or 5 U insulin into the IVC. Livers were harvested 2 min later and lysates assessed by western blot. (A) Western blots showing levels of phosphorylated and total IR, IRS1, and ERK1/2. (B) Quantification of phospho- and total IR levels. The ratio of phospho-IR/total IR is shown. (C) Quantification of phospho- and total IRS1 levels. The ratio of phospho-IRS1/total IRS1 is shown. (D) Quantification of phospho- and total ERK1/2 levels. The ratio of phospho-ERK1/2/total ERK1/2 is shown. (E) RNA isolated from 15-week-old male livers and assessed by qRT-PCR. n = 5–6 per genotype and treatment. *p < 0.05; **p < 0.01; ***p < 0.0001.
Given the well-described role of Bmi1 in repressing transcription of target genes, we sought to determine whether the expression of the insulin signaling proteins upstream of Akt was altered in Bmi1+/− livers. There were no differences in the levels of the receptors (IR, Igf1r), adaptor proteins (Irs1, Irs2, p85) or proteins that regulate activity of the core pathway components (Pten, Ptb1b, Pdk1, Sos1, Pp2a, Phlpp1, Phlpp2), suggesting that Bmi1 does not regulate expression of these genes.
3.8. Insulin signaling is enhanced in muscle of Bmi1+/− mice
Given the robust enhancement of Akt signaling in liver (Figure 4), we hypothesized that a similar enhancement is responsible for the trend toward increased glucose uptake seen in the muscle of Bmi1+/− animals during the clamp (Figure 3). Lysates of muscle tissue taken from the same animals as above were analyzed by western immunoblot. As expected, Bmi1 protein was reduced in Bmi1+/− muscle (Supp. Figure 2A). Similar to liver, Akt phosphorylation increased higher above baseline in response to insulin stimulation in Bmi1+/− muscle, as compared to Bmi1+/+ (Supp. Figure 2B; 1.6-fold change in Bmi1+/+ vs 3.6-fold in Bmi1+/−).
4. Discussion
We identify a novel role for the Polycomb protein, Bmi1, in the development of insulin resistance. Insulin resistance, caused by age or liver insulin receptor deletion, is associated with increased Bmi1 levels. Reduced Bmi1 results in alterations in insulin signaling in both liver and muscle tissue, which appear to contribute to a striking improvement in whole-body insulin sensitivity. It appears that this sensitization is a result of increased activity of Akt, with more proximal members of the insulin signaling pathway being unaffected. Homozygous loss of Bmi1 has been associated with severe glucose intolerance and diabetes due to stunted beta cell replication [10]. It was therefore surprising to discover the favorable metabolic phenotype of Bmi1+/− mice. In addition to a lack of impaired glucose homeostasis, we observed a trend toward protection from HFD-induced glucose intolerance and a clear sensitization of insulin responsiveness in these animals. Our data therefore indicate a role for Bmi1 in extra-islet tissues in regulating glucose homeostasis.
An age related decline in Bmi1 expression has been observed in other tissues and is associated with a decline in replication [19]. An initial reduction of Bmi1 protein levels occurs between 2 and 8 weeks in liver as well; however, Bmi1 levels subsequently increase dramatically with progressive age, surpassing the levels seen in juvenile livers by 30 weeks. The mechanisms underlying these temporally dynamic changes in Bmi1 levels warrant further investigation.
We find a striking effect of Bmi1 gene dosage on Akt activity. A comprehensive analysis of early insulin signaling events revealed no difference in activation of IR, IRS1, or ERK1/2, nor alterations in the transcript levels of known regulators of Akt, including IRS1, Akt phosphatases, and the PI3K regulatory subunit p85. Thus, the mechanism by which Bmi1 influences Akt activity also warrants further investigation.
We also noted a decrease in plasma insulin in Bmi1+/− animals following a glucose bolus. While we interpret this to indicate an adaptive response to reduced insulin requirement by more sensitive Bmi1+/− tissues, our data do not rule out the possibility that the livers of Bmi1+/− animals are clearing glucose more rapidly from the blood. Given the supporting molecular data showing enhancement of insulin signaling, we believe this to be an unlikely explanation.
The observations that Bmi1 null animals have no discernible difference in hepatocyte proliferation compared to wildtype [20] and that p16 expression is not detectable in hepatocytes (data not shown) suggest a non-classical, proliferation-independent role of Bmi1 in the liver. Although recent studies have begun to explore the potential for Bmi1 action independent of its regulation of the Ink4a/Arf locus, Bmi1 targets identified in neural stem cells [21] were not dysregulated in Bmi1+/− liver (data not shown), suggesting that Bmi1 targets may be tissue-specific. Further, the lack of a clear consensus sequence for mammalian PRC1 binding [12,13], complicates efforts to predict Bmi1 targets in the liver. A direct determination of Bmi1 targets in liver by chromatin immunoprecipitation and high throughput sequencing will be required to identify the direct Bmi1 targets involved in insulin action in the liver. Further, it is possible that derepression of multiple genes contributes to this phenotype.
Our current model is limited by the global and heterozygous nature of the genetic deletion, which complicates interpretation of how specific tissues are contributing to the overall improvement in insulin sensitivity. It is likely that tissues in addition to liver contribute to the insulin sensitivity phenotype. The marked increase in glucose disposal rate indicates that glucose uptake in peripheral tissues is a key contributor to this phenotype, which we speculate to be due, at least in part, to Bmi1 regulation of insulin signaling in muscle. Additionally, it is still unclear whether the role of Bmi1 in insulin sensitivity is gene dosage dependent, since the severely shortened lifespan of the Bmi1 null mice precludes the type of analysis we present here. Future work in a tissue-specific model, when one becomes available, will circumvent these limitations. Complete ablation of Bmi1 in liver may further protect animals from age- and/or high fat diet-induced insulin resistance, compared to the heterozygous deletion described here.
Given the myriad of negative phenotypes associated with Bmi1 deletion, it was unanticipated to see such a strikingly positive effect of Bmi1 heterozygosity. Additionally, further analysis may reveal a new mechanism for regulation of Akt activity. Our observations highlight the role of Bmi1 in regulating insulin sensitivity as well as broaden the roles of Bmi1 and PRC1 beyond their classical regulation of cell cycling.
Funding
This work was supported by National Institutes of Health 5T32GM008076-29 (to CEC), NIH F32 DK101175 (to PMT), Société Francophone du Diabète, Association Française des Diabétiques, American Diabetes Association and JDRF Advanced Post-doctoral Fellowship 3-APF-2014-182-A-N (to AEO), NIH R01 DK67536 and DK55523 (to RNK), NIH R01 DK056886 (to MJB), and NIDDK R01 DK068157 (to DAS).
Disclosures
The authors have nothing to disclose.
Acknowledgments
We would like to thank the Penn Diabetes Endocrine Research Center (P30DK19525) Mouse Phenotyping, Physiology and Metabolism Core for performing NMR and clamp procedures. We also thank Maarten von Lohuizen of the Netherlands Cancer Institute for sharing the Bmi1 null mouse model, C. Ronald Kahn for sharing the LIRKO mice, Mogher Khamaisi for the anti-pIRS-1 antibody, Mitchell Lazar for helpful discussions, and Zheng Sun, Shane Poplawski, Jeff Raum, and Scott Soleimanpour for experimental advice.
Conflict of interest
None declared.
Appendix A. Supplementary data
Supplemental Figure 1. Bmi1 null mice exhibit glucose intolerance and insulin hypersensitivity. Glucose and insulin tolerance tests of 9–10 week old Bmi1+/+, Bmi1+/−, and Bmi1−/− males (A) 2 g/kg IP glucose bolus (p = 0.4314 by two-way ANOVA) and (B) 0.75 U/kg IP insulin. *p < 0.01 **p < 0.001 Bmi1−/− vs Bmi1+/+; n = 11–15 for Bmi1+/+ and Bmi1+/−, n = 2–3 for Bmi1−/−.
Supplemental Figure 2. Insulin signaling in muscle is enhanced by Bmi1 heterozygosity. (A) Representative western blots of lysates from Bmi1+/+ and Bmi1+/− male muscle lysates showing levels of Bmi1 protein. (B) 15 week old males fasted 5 hours and then injected IP with saline or 1.125 U/kg insulin. Gastrocnemius muscle harvested 20 minutes later and lysates assessed by Western blot. Quantification of the ratio of phospho-Akt/total Akt is shown. n = 5–6 per genotype and treatment. *p < 0.05 vs Bmi1+/+ saline; **p < 0.05 vs Bmi1+/+ insulin.
References
- 1.Fink R.I., Kolterman O.G., Griffin J., Olefsky J.M. Mechanisms of insulin resistance in aging. Journal of Clinical Investigation. 1983;71:1523–1535. doi: 10.1172/JCI110908. [DOI] [PMC free article] [PubMed] [Google Scholar]
- 2.Lund A.H., van Lohuizen M. Polycomb complexes and silencing mechanisms. Current Opinion in Cell Biology. 2004;16:239–246. doi: 10.1016/j.ceb.2004.03.010. [DOI] [PubMed] [Google Scholar]
- 3.Cao R., Tsukada Y.-I., Zhang Y. Role of Bmi-1 and Ring1A in H2A ubiquitylation and Hox gene silencing. Molecular Cell. 2005;20:845–854. doi: 10.1016/j.molcel.2005.12.002. [DOI] [PubMed] [Google Scholar]
- 4.Jacobs J.J., Kieboom K., Marino S., DePinho R.A., van Lohuizen M. The oncogene and Polycomb-group gene bmi-1 regulates cell proliferation and senescence through the ink4a locus. Nature. 1999;397:164–168. doi: 10.1038/16476. [DOI] [PubMed] [Google Scholar]
- 5.van Lohuizen M., Verbeek S., Scheijen B., Wientjens E., van der Gulden H., Berns A. Identification of cooperating oncogenes in E mu-myc transgenic mice by provirus tagging. Cell. 1991;65:737–752. doi: 10.1016/0092-8674(91)90382-9. [DOI] [PubMed] [Google Scholar]
- 6.Jacobs J.J.L., Scheijen B., Voncken J.-W., Kieboom K., Berns A., van Lohuizen M. Bmi-1 collaborates with c-Myc in tumorigenesis by inhibiting c-Myc-induced apoptosis via INK4a/ARF. Genes & Development. 1999;13:2678–2690. doi: 10.1101/gad.13.20.2678. [DOI] [PMC free article] [PubMed] [Google Scholar]
- 7.Lessard J., Sauvageau G. Bmi-1 determines the proliferative capacity of normal and leukaemic stem cells. Nature. 2003;423:255–260. doi: 10.1038/nature01572. [DOI] [PubMed] [Google Scholar]
- 8.van der Lugt N.M., Domen J., Linders K., van Roon M., Robanus-Maandag E., te Riele H. Posterior transformation, neurological abnormalities, and severe hematopoietic defects in mice with a targeted deletion of the bmi-1 proto-oncogene. Genes & Development. 1994;8:757–769. doi: 10.1101/gad.8.7.757. [DOI] [PubMed] [Google Scholar]
- 9.Molofsky A.V., He S., Bydon M., Morrison S.J., Pardal R. Bmi-1 promotes neural stem cell self-renewal and neural development but not mouse growth and survival by repressing the p16Ink4a and p19Arf senescence pathways. Genes & Development. 2005;19:1432–1437. doi: 10.1101/gad.1299505. [DOI] [PMC free article] [PubMed] [Google Scholar]
- 10.Dhawan S., Tschen S.-I., Bhushan A. Bmi-1 regulates the Ink4a/Arf locus to control pancreatic beta-cell proliferation. Genes & Development. 2009;23:906–911. doi: 10.1101/gad.1742609. [DOI] [PMC free article] [PubMed] [Google Scholar]
- 11.Bruggeman S.W.M., Valk-Lingbeek M.E., van der Stoop P.P.M., Jacobs J.J.L., Kieboom K., Tanger E. Ink4a and Arf differentially affect cell proliferation and neural stem cell self-renewal in Bmi1-deficient mice. Genes & Development. 2005;19:1438–1443. doi: 10.1101/gad.1299305. [DOI] [PMC free article] [PubMed] [Google Scholar]
- 12.Kassis J.A., Brown J.L. Polycomb group response elements in drosophila and vertebrates. Advances in Genetics. 2013;81:83–118. doi: 10.1016/B978-0-12-407677-8.00003-8. [DOI] [PMC free article] [PubMed] [Google Scholar]
- 13.Sharif J., Endo T.A., Ito S., Ohara O., Koseki H. Embracing change to remain the same: conservation of polycomb functions despite divergence of binding motifs among species. Current Opinion in Cell Biology. 2013;25:305–313. doi: 10.1016/j.ceb.2013.02.009. [DOI] [PubMed] [Google Scholar]
- 14.Michael M.D., Kulkarni R.N., Postic C., Previs S.F., Shulman G.I., Magnuson M.A. Loss of insulin signaling in hepatocytes leads to severe insulin resistance and progressive hepatic dysfunction. Molecular Cell. 2000;6:87–97. [PubMed] [Google Scholar]
- 15.Carr R.M., Patel R.T., Rao V., Dhir R., Graham M.J., Crooke R.M. Reduction of TIP47 improves hepatic steatosis and glucose homeostasis in mice. American Journal of Physiology – Regulatory, Integrative and Comparative Physiology. 2012;302:R996–R1003. doi: 10.1152/ajpregu.00177.2011. [DOI] [PMC free article] [PubMed] [Google Scholar]
- 16.Lamming D.W., Ye L., Katajisto P., Goncalves M.D., Saitoh M., Stevens D.M. Rapamycin-induced insulin resistance is mediated by mTORC2 loss and uncoupled from longevity. Science. 2012;335:1638–1643. doi: 10.1126/science.1215135. [DOI] [PMC free article] [PubMed] [Google Scholar]
- 17.Sun Z., Miller R.A., Patel R.T., Chen J., Dhir R., Wang H. Hepatic Hdac3 promotes gluconeogenesis by repressing lipid synthesis and sequestration. Nature Medicine. 2012;18:934–942. doi: 10.1038/nm.2744. [DOI] [PMC free article] [PubMed] [Google Scholar]
- 18.Miller R.A., Chu Q., Le Lay J., Scherer P.E., Ahima R.S., Kaestner K.H. Adiponectin suppresses gluconeogenic gene expression in mouse hepatocytes independent of LKB1-AMPK signaling. Journal of Clinical Investigation. 2011;121:2518–2528. doi: 10.1172/JCI45942. [DOI] [PMC free article] [PubMed] [Google Scholar]
- 19.Tschen S.-I., Dhawan S., Gurlo T., Bhushan A. Age-dependent decline in beta-cell proliferation restricts the capacity of beta-cell regeneration in mice. Diabetes. 2009;58:1312–1320. doi: 10.2337/db08-1651. [DOI] [PMC free article] [PubMed] [Google Scholar]
- 20.Fan L., Xu C., Wang C., Tao J., Ho C., Jiang L. Bmi1 is required for hepatic progenitor cell expansion and liver tumor development. PLoS One. 2012;7:e46472. doi: 10.1371/journal.pone.0046472. [DOI] [PMC free article] [PubMed] [Google Scholar]
- 21.Gargiulo G., Cesaroni M., Serresi M., de Vries N., Hulsman D., Bruggeman S.W. Vivo RNAi screen for BMI1 targets identifies TGF-β/BMP-ER stress pathways as key regulators of neural- and malignant glioma-stem cell homeostasis. Cancer Cell. 2013;23:660–676. doi: 10.1016/j.ccr.2013.03.030. [DOI] [PubMed] [Google Scholar]
Associated Data
This section collects any data citations, data availability statements, or supplementary materials included in this article.