

Abstract
Aims
The goal of this group-randomized trial was to test the effectiveness of an adapted alcohol use preventive intervention for urban, low-income and multi-ethnic settings.
Design and Setting
Sixty-one public schools in Chicago were recruited to participate, were grouped into neighborhood study units, and randomly assigned to intervention or “delayed program” control condition.
Participants
The study sample (n=5812 students) was primarily African American, Hispanic and low-income.
Intervention
Students, beginning in sixth grade (age 12), received three years of intervention strategies (curricula, family interventions, youth-led community service projects, community organizing).
Measurements
Students participated in yearly classroom-based surveys to measure their alcohol use and related risk and protective factors. Additional evaluation components included a parent survey, a community leader survey, and alcohol purchase attempts.
Findings
Overall the intervention, compared with a control condition receiving “prevention as usual,” was not effective in reducing alcohol use, drug use or any hypothesized mediating variables (i.e., related risk and protective factors). There was a nonsignificant trend (p = .066) that suggested the ability to purchase alcohol by young appearing buyers was reduced in the intervention communities compared to the control communities, but this could be due to chance. Secondary outcome analyses to assess the effects of each intervention component indicated that the home-based programs were associated with reduced alcohol, marijuana, and tobacco use combined (p = .01), with alcohol use alone approaching statistical significance (p = .06).
Conclusions
Study results indicate the importance of conducting evaluations of previously validated programs in contexts that differ from the original study sample. Also, the findings highlight the need for further research with urban, low-income adolescents from different ethnic backgrounds to identify effective methods to prevent and reduce alcohol use.
Keywords: alcohol prevention, urban youth, intervention adaptation
Introduction
Alcohol use is the third leading cause of death in the U.S. [1] and early initiation is associated with heavy and problematic use [2, 3], as well as physical and social problems into young adulthood [4-6]. Youth alcohol use is difficult to change because alcohol use is so ingrained and acceptable in the U.S. culture [7]. Comprehensive interventions targeting underage drinking need to counter or change these influences [7].
Research is limited but suggests that multiple component strategies are not only feasible, but may also be more effective than school-based curriculum alone [8]. One of the first multicomponent approaches to drug use prevention, including alcohol use, was the Midwestern Prevention Project [9]. A 3-year follow-up study of a sample of mostly white adolescents indicated that there were significant program effects on tobacco and marijuana use but no program main effects on alcohol use [9]. Given the lack of positive results on alcohol use, Perry and colleagues [10] designed a multicomponent preventive intervention focused solely on alcohol use named “Project Northland.” The intervention was developed for rural communities in northeastern Minnesota with high rates of alcohol-related problems. Project Northland was evaluated for efficacy using a randomized community trial in 24 rural school districts (mostly with one school per district) and adjoining communities with primarily white, lower-middle-class to middle-class populations [10]. At the end of three years (6th to 8th grades), a significantly smaller percentage of students in the intervention communities reported drinking or beginning to drink than students in the control communities [11]. Among students who reported never having drank alcohol at the beginning of sixth grade, students in the intervention communities were not only less likely to drink three years later, but also had lower rates of cigarette and marijuana use, despite the fact that the intervention focused on alcohol use alone [11].
Based on these positive findings, the program was selected as a “model program” by the Substance Abuse and Mental Health Services Administration, an “exemplary program” by the U.S. Department of Education, and rated “A” in Making the Grade, Drug Strategies. These “model” program designations have become particularly important because U.S. federal education policy now requires school districts receiving Safe and Drug-Fee School funds to select designated model programs [12]. This has been an important policy to encourage the diffusion of science-based programs [13].
Because Project Northland was developed and evaluated with a mostly white and rural population, and positive outcomes with similar populations have been reported by outside evaluators [14], an important research question remains whether the program is effective in reducing alcohol use among different populations within different community settings (e.g., among youth in urban, multi-ethnic, low-income settings). Studies assessing replication of other programs in different settings/populations have shown mixed findings [15-21].
For the present study we adapted the original Project Northland intervention for an urban, low-income and multi-ethnic population in Chicago. The program was comprehensively evaluated using a group-randomized trial design. We hypothesized that exposure to the adapted Project Northland Chicago (PNC) intervention components during 6th-8th grades would positively alter the normative trajectories of: (1) hypothesized mediating factors targeted by the intervention (i.e., reduce growth rates of risk factors and increase growth rates of protective factors), and (2) alcohol and other drug use (i.e., reduce growth rates of alcohol and other drug use). This paper reports the primary outcomes of the trial associated with the complete intervention, followed by secondary outcomes associated with each intervention component separately.
Methods
Research Design
The study design was a randomized controlled trial of schools and surrounding community areas in the city of Chicago [22]. From a list of all public schools in Chicago, schools were selected for recruitment if they included grades 5-8, had relatively low mobility rates (< 25%), and were larger schools (30+ students per grade). Sixty-six schools agreed to participate and signed a Cooperative Agreement form indicating their commitment to participate in the study for three years. Schools that participated in the study were located throughout the city of Chicago and had similar demographic characteristics to students in the Chicago school district.
Once the 66 schools were recruited, they were combined into study units to achieve an average of 200 students per study unit [22]. Power calculations had determined the need for 10 study units per condition with approximately 200 students per unit at baseline to detect differences found in the Minnesota study. Twenty-two study units (i.e., schools and surrounding neighborhoods) were defined by combining geographically close schools within city-defined community areas. Participating schools were grouped within neighborhood and proximity due to the intervention design, which included a neighborhood component. Study units were matched on ethnicity, poverty, mobility, and reading and math test scores. Units were then randomized into intervention (n=10) or control (n=12) conditions. Before student baseline surveys were implemented, 5 schools dropped out of the study due to time constraints (4 from the control condition and 1 from the intervention condition), resulting in a study sample of 10 intervention units with 29 schools and 12 control units with 32 schools. The study included one baseline (T1, fall 2002, 6th grade) and three follow-up surveys of students in the participating schools, before and immediately following each of three intervention years (T2, spring 2003, 6th grade; T3, spring 2004, 7th grade; and T4, spring 2005, 8th grade). The curricula and parent programs were implemented in fall or spring semesters and follow-up surveys were implemented towards the end of each spring semester. In addition to the student survey, measures of neighborhood, school, and family characteristics were collected, including baseline and follow-up surveys of parents and community leaders.
Intervention and Adaptation
The goals of the PNC intervention were to change personal (e.g., outcome expectancies, resistance self-efficacy), social (e.g., norms, parental monitoring) and environmental (e.g., access to alcohol) factors that support alcohol use among young adolescents [22]. The theory of triadic influence [23] and Perry's [24] planning model for adolescent health promotion programs integrate factors from several socio-behavioral theories and were used to guide the adaptation and enhancement of Project Northland Chicago. The intervention is designed to be implemented consecutively from 6th to 8th grade and each year of intervention involves school, family and community components. PNC included three years of: (1) peer-led classroom curricula—6 to 10 sessions per year; (2) parental involvement and education—4 home-based sessions per year, plus other educational and school and community involvement activities; (3) peer leadership and youth-planned community service projects; and (4) community organizing and environmental neighborhood change [22]. Our previous paper [22] summarizes the intervention strategies and level of modifications made for urban youth, families and neighborhoods. Major changes made to the program components included: 1) surface changes on curricula, 2) expanded home programs, 3) peer-led community service projects rather than social activities, and 4) more emphasis on community organizing with the organizers more focused in the neighborhoods rather than in the schools. Teachers were trained by University-based project staff to implement the classroom curricula. Ten Chicago-based organizers were hired to implement the peer leader trainings, family events, service projects, and community organizing. Each organizer was assigned to one study unit including 1 to 4 schools and 1 to 3 community areas.
Implementation Evaluation
Process measures were used to assess implementation of each intervention component (see Table 1). Assessment of implementation of the classroom programs included direct classroom observations by research staff in two to four sessions per class per year. The three years of curricula were implemented at high levels of completeness (overall mean of 82%-87% completeness) and relatively high scores on an engagement index (mean of 11-12 on a three item scale ranging from 5, meaning no student and teacher engagement, to 15 meaning a very high level of engagement). Assessment of peer leader status was measured by attendance at the peer leader trainings: 22% of the cohort students during 6th and 7th grade were trained as classroom peer leaders. Assessment of family programs included participation records completed by parents and returned to school. Family participation in the home programs was the highest during the first year (73% completed the program), with 53% and 51% of families completing the second and third year programs, respectively. Student attendance was taken at two family events held in 6th and 7th grade; again, student participation was highest during 6th grade. Parent postcards were mailed directly to parents during the 7th and 8th grade years and we documented postcards that were returned to us from the post office as undeliverable (about 10% each year). Assessment of service projects and community organizing included regular and systematic documentation by the organizers on standardized web-based forms. Forty-percent of the intervention cohort participated in at least one community service project activity. Examples of service projects implemented included food drives, visitation of senior citizen centers, and park clean-ups. Community organizing productivity and effectiveness was assessed with measures of number of meetings, number of activities, focus on project goals, leadership roles of team members, leadership ability of organizer, and community impact. The productivity and effectiveness of the community organizing intervention varied by community area, with 22% of community areas rated as highly productive/effective, 28% as moderately productive/effective, and 50% rated as having a low level of productivity and effectiveness. Examples of community initiatives that were implemented included Merchant Pledges (visiting alcohol outlets and asking the manager/owner to sign a pledge to not sell alcohol to underage youth), family-friendly events held in neighborhood parks, neighborhood parades, participation in the annual St. Patrick's Day parade to promote alcohol-free areas and messages, and a dry precinct initiative (petition drive to receive enough resident signatures to place a dry precinct ordinance on the ballot).
Table 1. Level of implementation of each Project Northland Chicago intervention component by year.
| 6th (2002-2003) | 7th (2003-2004) | 8th (2004-2005) | |
|---|---|---|---|
| I. Classroom curricula | Slick Tracy (6 sessions) Percent (Range by school) | Amazing Alternatives! (9 sessions) Percent (Range by school) | PowerLines (9-10 sessions) Percent (Range by school) |
| % Schools implemented | 97% (28/29 schools) | 100% (28/28 schools1) | 93% (25/27 schools2) |
| % Components completed3 | 87% (53-100%) | 83% (25-100%) | 82% (31-100%) |
| Engagement score (range: 3=no engagement, 15=high level of engagement) 3 | 12.0 (8.0-14.0) | 11.3 (7.3-14.5) | 11.8 (8.1-15.0) |
| II. Peer Leadership | 2 ½ hr training | 7 hrs (2 separate trainings) | |
| % Schools implemented | 93% (27/29 schools) | 100% (28/28 schools1) | 93% (25/27 schools2) |
| % Students trained as peer leaders3 | 22% (0-34%) | 22% (0-38%) | No formal training |
| III. Parental Involvement | Slick Tracy Home Program (4 activity booklets) | Amazing Alternatives! Home Program (4 activity pamphlets) | ‘Let's Play’ Game Packets (4 game packets) |
| Home Programs | |||
| % Schools implemented | 97% (28/29 schools) | 100% (28/28 schools1) | 100% (27/27 schools2) |
| % Home team completion3 | 83% (completed at least 1) (44-100%) | 70% (completed at least 1) (0-100%) | 79% (completed at least 1) (21-97%) |
| 73% (completed 3-4) (32-100%) | 53% (completed 3-4) (0-93%) | 55% (completed 3-4) (0-81%) | |
| Family Fun Events | Slick Tracy Poster Fair (1 hour event) | Amazing Alternatives! Family Fun Event (2 hour event) | NA |
| % Schools implemented | 93% (27/29 schools) | 93% (26/28 schools1) | NA |
| % Students attended3 | 71% (0-97%) | 31% (0-82%) | |
| Parent Postcards | |||
| # of Postcards mailed | NA | 5 postcards | 8 postcards |
| % Return rates | 9.5% | 10.5% | |
| IV. Youth Extra Curricular Activities | NA | NA | Community Service Project Activities |
| % Schools implemented | 96% (26/27 schools2) | ||
| Number of students (% cohort) 3 | 674 (40%) (0-100%) | ||
| Mean number of activities per student (range by student) 3 | 1.5 (0-32%) | ||
| V. Community Organizing | Action Teams | Action Teams | |
| Community ranking | % high 22% | ||
| % med 28% | |||
| % low 50% | |||
One school dropped out of the study due to time constraints;
One additional school closed;
Of schools who implemented the program.
In addition to measurement of the implementation of PNC program components, we conducted an annual survey of intervention and control schools to assess type and amount of other alcohol and drug prevention activities that were implemented. Each spring a brief questionnaire was administered to the key contact person in each of our participating schools with the purpose of documenting health and drug prevention program activity the cohort experienced during that school year (response rates ranged from 91%-100%). During the three years of the study, 69%, 50% and 39% of the control schools reported implementing an alcohol and/or drug prevention curriculum during the 6th, 7th, and 8th grade years, respectively. Since it is not feasible, let alone ethical, to ask control schools to discontinue prevention programs, we did not do so. It is clear from these results that the control schools were not a true no-treatment control group, but rather they continued to implement other prevention programs, so a key question being asked in the current study is whether the Project Northland Chicago intervention was more effective than prevention programs in general use in public schools under the mandate that schools implement evidence-based programs in order to receive federal funds.
Outcome Evaluation
The main outcome measure, alcohol and other drug use among young adolescents, as well as important intermediate measures, were assessed through a classroom-based survey. Other intermediate measures included assessments of parents, community leaders, and commercial access to alcohol by underage youth.
Student Survey
A questionnaire was administered in study schools at four time points. The student survey included items to assess youth alcohol and other drug use behaviors and intentions, intermediate factors (e.g., normative estimates and outcome expectations), and demographic information (age, gender, ethnicity, family composition, language spoken at home, and enrollment in free or reduced price lunch program as a measure of low income status). All students enrolled in the specified grade each year (grades 6, 7 or 8) were eligible for the surveys. Surveys were administered by three-person teams of trained University-based research staff interviewers using standardized protocols. Students followed along and filled out their survey as it was read aloud in class. Prior to survey administration parents and students were given the opportunity to refuse participation. Parent consent and student assent procedures were approved by the University of Minnesota Institutional Review Board for the Protection of Human Subjects and the Chicago Public Schools Law Department. A Certificate of Confidentiality was obtained from the U.S. Department of Health and Human Services to further protect the confidentiality of the student responses. Response rates ranged from 91% to 95%.
The main outcomes of interest for the proposed study were alcohol use, intentions to use alcohol, and multiple drug use (including alcohol, marijuana and tobacco). The Alcohol Use scale included five standard items from the Monitoring the Future study [25], measuring alcohol use in the last 12 months, 30 days, 7 days, five or more drinks in a row in the last two weeks, and ever been drunk. The items were summed into a five-item scale; the scores range from 5-33, the mean at T1 (6th grade) was 5.5 (SD = 1.7) and at T4 (8th grade) was 6.7 (SD = 3.2). The Alcohol Intentions scale included four items, measuring intentions to use if your best friend offered it to you, in the next month, when a senior in high school, and when an adult. The four-item scale scores ranged from 4-12; the mean at T1 (6th grade) was 5.5 (SD = 1.6) and at T4 (8th grade) was 7.0 (SD = 2.4). The Drug Use scale included the five alcohol use items, plus two cigarette and two marijuana items. The nine-item scale scores ranged from 9-51; the mean at T1 (6th grade) was 9.8 (SD = 2.4) and at T4 (8th grade) was 11.8 (SD = 4.9). Drug use, including tobacco and marijuana, was of primary interest given the previous results from the Minnesota study on these behaviors [11]. Intermediate measures on the student survey included the following scales: norms supportive of use (normative estimates and expectations), perceived outcomes supportive of use (expectancies and expectations), lack of resistance self-efficacy, parental involvement, and limited access to alcohol. All multi-item scales had acceptable internal consistency (for more detail, see Komro, Perry, et al., [26]).
Parent and Community Leader Surveys
Parents of the student cohort were surveyed at T1 (parents of 6th graders) and T4 (parents of 8th graders). During implementation of the school-based student survey, parent surveys (in English and Spanish) were handed out to students, and they were asked to deliver the closed packet to their primary caregiver (a method successfully used in a previous trial in Chicago [27]). Parents were given $25 at T1 and $30 at T4 after the completed survey was returned. Students were given a $5 Subway™ gift certificate for delivering the packet to their parents. After two weeks, teachers handed out a second copy of the packet to students whose parents had not yet responded. Teachers were also asked to periodically remind students about the parent survey. Response rates were 70% at T1 (n = 3250) and 67% at T4 (n= 2670). The parent survey includes measures of neighborhood and family constructs, including multi-item scales measuring: parental monitoring, family alcohol discussions, alcohol access in home, perceived community action, support of policies to prevent illegal sales, support of advertisement policies, and perceived neighborhood problems.
A telephone survey of leaders in each of the study schools and neighborhoods was conducted at T1 (2002) and T4 (2005). Leaders included local school council chairs and members, religious leaders, managers of park and recreation centers, neighborhood beat officers, neighborhood beat facilitators (citizen volunteers who work with beat officers), and managers/leaders of neighborhood organizations. Response rate at both TI (n = 326) and T4 (n = 267) was 70%. At T4 the sample (and response rate) excluded beat facilitators, because despite numerous attempts to work with the public information officer liaison, we were unable to implement the survey with the beat facilitators. The survey instrument was based on others administered in similar research projects [28, 29] and contained the following scales: neighborhood strength, neighborhood and police prevention action, and organizational prevention efforts.
Alcohol Purchase Attempts
Propensity for underage access to alcohol from commercial sources was measured directly using a standardized protocol [30, 31]. At T1 (2002) and T4 (2005), women at least 21-years-old who were judged by a panel to be younger-appearing (i.e., 20 years old or younger) attempted to purchase alcoholic beverages at outlets without age identification. Buyers were matched to the ethnicity of the neighborhoods. A random sample of 20 off-sale alcohol outlets in each of the 22 study units were selected for assessment.
Participants
Sixty-one schools and 4259 students (91% response rate) participated in the baseline survey, 59 schools and 4240 students (94% response rate) participated in the first follow-up survey, 60 schools and 3778 students (93% response rate) participated in the second follow-up survey, and 59 schools and 3802 students participated in the third follow-up survey (95% response rate). The cohort follow-up rate from baseline to first follow-up survey was 89%, from baseline to second follow-up was 67%, and from baseline to third follow-up was 61%. Loss to follow-up mostly occurred due to two schools closing and students leaving the other study schools. This rate of loss to follow-up was anticipated and planned for; original power calculations included an estimated 15% loss to follow-up each year based on attrition rates in the Chicago public schools (which would equal 61% for a third follow-up: exactly what occurred). The attrition rate was similar to those reported in a meta-analysis of school-based substance use prevention studies [32]. A total of 5812 students completed one or more of these study surveys: 2373 completed four surveys, 808 completed three surveys, 1534 completed two surveys, and 1097 completed one survey. The study sample was 50% boys, ethnically diverse (43% black, 29% Hispanic, 13% white, and 15% other), and of low socioeconomic status (72% received free or reduced-price lunch). Less than half of the students lived with both of their parents (47%) and 74% reported English as the primary language at home. There were no statistically significant differences between the intervention and control groups at baseline on demographic characteristics.
Attrition analysis on demographic factors indicated that those students who were present at baseline and completed 3-4 surveys compared with 1-2 surveys were more likely to be White and live with both parents. There were no significant differences on gender, receiving free/reduced price lunch, or language spoken at home. Also, those who completed 3-4 surveys compared to 1-2 surveys had slightly lower alcohol use scale scores at baseline (Mean 3-4 = 5.47, Mean 1-2 = 5.65, F (1, 4069) = 9.10, p = .003). Importantly, we found no differential attrition by treatment condition, and no differential attrition by treatment condition on demographic characteristics or alcohol use, indicating that analyses of intervention effects were not biased due to differential attrition. The analysis sample included 5698 students after removing inconsistent responders (those with 4 or more inconsistent responses) and those who moved between study conditions.
Analysis Strategy
Mixed-effects regression models for repeated measures were used to test for differences between the intervention and control conditions over time, in regards to the student survey, employing a three-level random coefficients regression model [33, 34]. Mean trajectories for each student were modeled at level one, along with the variability around the trajectory within a student over time; at level two, mean trajectories for each study unit were modeled, along with the variation in parameters between individuals within study units; and at level three, mean trajectories for each study condition were modeled, along with the variation in parameters between study units within a treatment condition. At level one, the models used a heterogeneous variance structure with off-diagonal elements fixed to zero. At levels two and three, models included a random effect for the intercept and linear terms. We tested whether a linear or nonlinear model best represented the form of the line or curve. Based on the fit statistics, a linear model was chosen to represent the trajectories for both behaviors and intermediate outcomes. Time was centered at baseline and coded in months to reflect the timing of the surveys [e.g., as 0 (T1), 6 (T2), 18 (T3), and 30 (T4) months]. Ethnicity and gender were included as time-invariant covariates in all models to increase precision. The models were estimated using maximum likelihood methods using the multi-level module in LISREL 8.72 [35, 36]. Based on simulation studies, maximum likelihood is one of two recommended approaches to provide valid, robust findings when dealing with missing data [37].
Analyses of the intermediate outcomes from the parent and community leader surveys used mixed-model ANOVA with the study unit of schools and neighborhoods specified as a nested random effect. The SAS/STAT MIXED and GLIMMIX procedures were used [38]. To analyze intervention effects on the alcohol purchase attempt data, we calculated the difference in the unit-level change in purchase rate from the baseline to follow-up and conducted ANOVA on the difference score at the unit level.
Secondary analyses of the student survey data were also performed to assess: 1) effects of the intervention on students who were present all three years (i.e., fully exposed sample) and 2) separate effects of each intervention component, as was recently performed for the original Project Northland trial [39]. Three-level growth curve analyses were used to estimate the effects of each intervention component over time. Using data collected in the process evaluation, each intervention component was entered as a time-varying covariate in the regression model [39]. Six variables were created to represent exposure to each component of the intervention using the process data described above (see Table 1): 1) % of classroom components completed, 2) engagement score for curriculum, 3) curriculum peer leader status, 4) number of community service activities attended, 5) number of home sessions completed, and 6) level of implementation of community intervention. Each student was assigned a value for each of the six intervention variables for each of the three years of the intervention; students in the control schools were given zeros. A time-varying covariate was then created to reflect cumulative exposure to an intervention component for each student at each point in time. Each intervention component was tested in a separate regression model unadjusted for a student's participation in/exposure to the other intervention components because there was a high level of multicollinearity between intervention components.
Results
Outcome Analyses
Differential Effects
We tested for potential interaction effects of treatment with gender, ethnicity, family composition, and baseline alcohol use on alcohol and drug use, to examine whether there were differential intervention effects by these demographic and risk characteristics. None of the interaction terms were statistically significant, suggesting that the intervention was not differentially effective by demographic or risk characteristics. Therefore, the outcome analyses were conducted and presented for the combined sample of youth.
Outcome Analyses on Alcohol and Drug Use
Table 2 presents intent-to-treat results from the growth curve analyses on the main outcomes of drug use (including marijuana, alcohol and tobacco), alcohol use only and alcohol intentions. At baseline, the alcohol use scale was lower in the intervention group compared to the control group. Over the three follow-up periods, there were no statistically significant differences in the growth rate of the drug use, alcohol use, and alcohol intentions scales between the intervention and control groups, evidenced by an examination of the slopes of these trajectories in each study condition.
Table 2. Baseline score and growth rate of student outcomes by Project Northland Chicago treatment condition.
| Outcome | Intervention Mean (SE) (n = 2501-2538) | Control Mean (SE) (n = 3079-3147) | χ2 | p-value |
|---|---|---|---|---|
| Main Outcomes | ||||
| Drug use scale | ||||
| Baseline score | 9.28 (.13) | 9.48 (.12) | 2.77 | .10 |
| Growth rate | 0.05 (.01) | 0.05 (.01) | 0.06 | .82 |
| Alcohol use scale | ||||
| Baseline score | 5.22 (.08) | 5.36 (.08) | 4.24 | .04 |
| Growth rate | 0.02 (.01) | 0.03 (.01) | 0.07 | .80 |
| Alcohol intentions | ||||
| Baseline score | 5.01 (.08) | 5.17 (.08) | 3.21 | .07 |
| Growth rate | 0.05 (.004) | 0.05 (.004) | 0.03 | .86 |
| Intermediate Outcomes | ||||
| Norms supportive of use | ||||
| Baseline score | 12.11 (.33) | 12.53 (.31) | 1.02 | .31 |
| Growth rate | 0.07 (.01) | 0.07 (.01) | 0.00 | .98 |
| Perceived outcomes supportive of use | ||||
| Baseline score | 14.96 (.23) | 15.36 (.22) | 3.15 | .08 |
| Growth rate | 0.13 (.01) | 0.14 (.01) | 1.17 | .28 |
| Lack of resistance self-efficacy | ||||
| Baseline score | 5.69 (.10) | 5.87 (.09) | 2.93 | .09 |
| Growth rate | 0.01 (.005) | 0.02 (.004) | 0.13 | .72 |
| Parental Involvement | ||||
| Baseline score | 37.08 (.49) | 37.08 (.46) | 0.00 | .99 |
| Growth rate | -0.18 (.01) | -0.16 (.01) | 2.63 | .11 |
| Limited access to alcohol | ||||
| Baseline score | 17.89 (.17) | 17.71 (.16) | 0.99 | .32 |
| Growth rate | -0.06 (.01) | -0.05 (.01) | 0.94 | .33 |
Note: Three-level, linear mixed-effects regression models for repeated measures data, adjusted for race and gender. Sample sizes vary by model due to missing values. Multi-items scales: (1) Drug use score ranges from 9-51 with a higher score indicating increased use; (2) Alcohol use score ranges from 5-33 with a higher score indicating increased use; (3) Alcohol intentions score ranges from 4-12 with a higher score indicating increased intentions to use; (4) Norms score ranges from 6-30 with a higher score indicating more norms supportive of use; (5) Perceived outcomes score ranges from 11-43 with a higher score indicating more perceived negative outcomes or reasons not to use; (6) Self-efficacy score ranges from 5-15 with a higher score indicating lower resistance self-efficacy; (7) Parental involvement score ranges from 10-50 with a high score indicating more parental involvement; (8) Access to alcohol access score ranges from 7-21 with a higher score indicating more difficulty in accessing alcohol.
Outcome Analyses on Intermediate Variables
Student Survey
Table 2 also presents the outcomes from the growth curve analyses on the hypothesized intermediate variables (i.e., risk and protective factors) from the student survey. At baseline, there were no statistically significant differences between the intervention and control groups on the intermediate variables. Over the three follow-up periods, there were no statistically significant differences between the intervention and control groups on the intermediate variables, as evidenced by estimates of their slopes.
Parent and Leader Surveys
At baseline and follow-up, there were no statistically significant differences between the intervention and control groups on the seven parent survey scales and on the three community leader survey scales.
Alcohol Purchase Attempts
There was a nonsignificant trend of a decrease in the alcohol purchase rate by young appearing buyers from baseline to follow-up in the intervention community units by 46% (46% to 25%) compared to a <1% decrease in the control community units (30% to 28%; F = 3.78 (1,20), p = .066). Among the 5 (out of 10) intervention community units where “merchant pledges” were conducted a 64% decrease from baseline to follow-up was found, but (because of the small number of units) was not statistically significantly different from the control communities (F = 2.78 (1,15), p = .116).
Outcome Analyses by Intervention Exposure
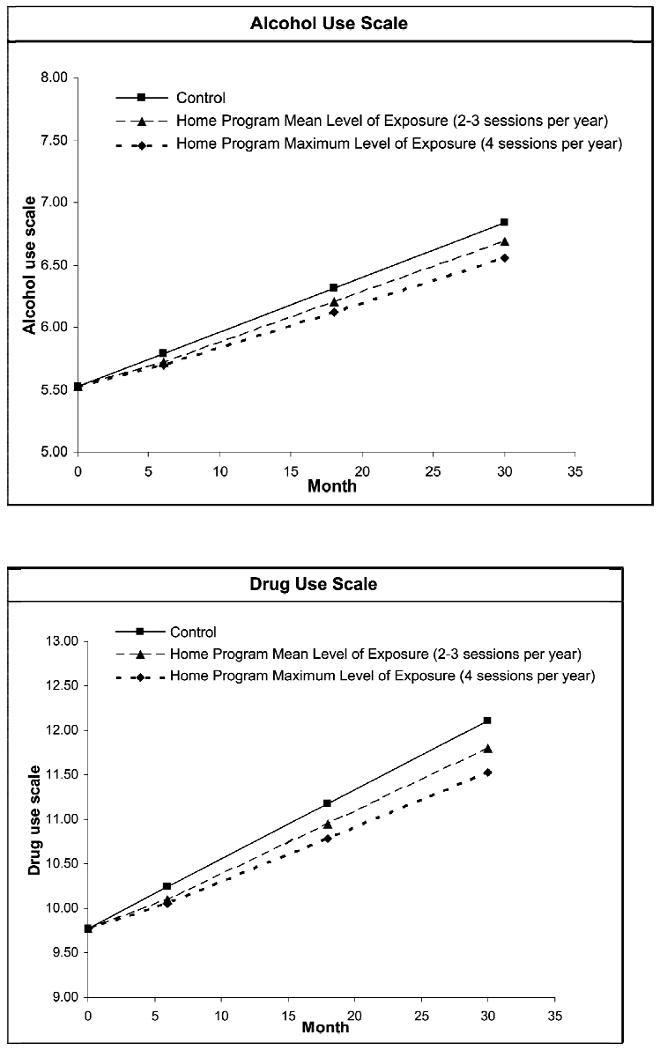
In secondary outcome analyses, we examined the relationship between participation in/exposure to each of the intervention components and alcohol and drug use over time. The association between level of participation in the home program and trajectory of drug use was statistically significant, with higher participation in the home programs associated with a lower rate of growth in drug use over time [mean = -.049 (SE = .019), z = -2.45, p = .01]. The association between level of participation in the home programs and trajectory of alcohol use approached statistical significance, with higher participation in the home programs associated with a lower rate of growth in alcohol use over time [mean = -.024 (SE = .013), z = -1.86, p = .06]. Figure 1 displays the relationship between level of participation in the home program activities and alcohol and drug use over time. There were no other statistically significant associations between participation in the additional intervention components (i.e., classroom curricula, classroom peer leader status, community service projects, or level of community intervention) and alcohol or drug use over time. In an additional secondary analysis, looking at the sample present during all three intervention years (n=2465), there was no statistically significant difference in the growth rate of alcohol use or drug use between the intervention and control groups.
Figure 1. Trajectories of alcohol and drug use by participation level in Project Northland Chicago home programs.
Discussion
The Project Northland Chicago alcohol use preventive intervention included classroom, parent, extracurricular service projects, and community organizing components. High participation from schools and teachers was achieved with high levels of fidelity to the classroom programs, including over 80% completion of the classroom components and a high level of engagement of teachers and students. However, due to student attrition, average cumulative exposure to the classroom components was 53% among the study cohort. A high level of parent participation in the home-based program was achieved during the first year (73%), followed by lower participation of just over 50% during the second and third years. This level of participation is higher than most group-based interventions where participation levels well below 50% are the norm [40]. In the Minnesota Project Northland study, 76% of families completed the first home-based program [41], a very similar participation rate to that achieved in Chicago. During the second year of the program in Minnesota the home program was mailed directly to parents and only 33% of families participated in the program [42]. In Chicago we revised the program to be implemented as homework assignments and over 50% of families participated. Average cumulative exposure among the cohort was 5 of 12 home sessions due to attrition. Forty-percent of the PNC students participated in the out-of-school community service projects. This compares to 48% of students who participated in after-school social activities in the Minnesota study [43]. And the service projects may not have been as potent as the peer-led social activities, as was found in the Minnesota study [39, 43]. In Chicago, mobilizing citizens to volunteer their time to focus on community strategies to reduce youth access to alcohol proved to be more challenging with only 22% of community action teams categorized as high implementers. Challenges to organizing around alcohol issues within inner-city communities included competition with other pressing issues (e.g., housing, gang violence), low acceptance of the importance of the issue, and resident time. The Minnesota rural residents did view youth alcohol use as a serious concern and were able to mobilize around this issue [11]. Another important difference between the Minnesota and Chicago studies was that the field staff in Minnesota had their offices located in the schools and focused on factors more proximal to the students. Whereas in Chicago, the organizers had home offices and worked in the neighborhoods on community-level and environmental factors, while also having many responsibilities with the other components, including implementation of peer leader trainings, family events, and service projects.
Despite the level of implementation fidelity of the school and family components being similar to that achieved in the Minnesota study, student attrition was higher in Chicago resulting in a lower level of intervention exposure. The adapted intervention implemented in Chicago with high fidelity, yet with student attrition typical of urban school districts, did not affect the trajectory of alcohol use or drug use among students over time, or any of the hypothesized mediating variables. In addition, among those students present all three years of the intervention, there was still no significant difference in alcohol use between the intervention and control groups. Therefore, there is no evidence that the overall intervention had an effect on alcohol use or risk factors for alcohol use. Project Northland Chicago was not more effective than “prevention as usual” given that the majority of the control schools implemented alcohol and drug prevention curricula during the three year study, as described earlier.
There was a nonsignificant trend that suggested the alcohol purchase rate in the intervention communities, especially those in which Merchant Pledges were conducted, was reduced, but the test did not achieve statistical significance with a sample of 22 community units. Merchant Pledges may be an effective strategy in reducing the ability of youth to purchase alcohol without age identification in urban areas and future research should more rigorously evaluate this strategy. However, the purchase rate in the intervention communities was higher at baseline than in the control communities, so these results should be interpreted with caution. These findings are consistent with previous research studies that have shown community organizing efforts to be successful in increasing compliance checks and reducing the ability of youth to purchase alcohol without age identification [44, 45], which may be particularly important during the high school years [44, 46].
In the secondary analyses conducted to assess the effects of each individual intervention component, the home-based programs appear to be the most promising. The home-based programs were the only intervention component that was significantly related to a lower trajectory of drug use. Each year four activity packets were sent home with the children to complete with their parent(s). Each session was designed to be completed within 30 minutes, for a total of 2 hours of home-based intervention activity per year. Given the brevity of the home-based activities, these results are promising and suggest further research into home-based prevention programs for urban youth and their families. Results of the home-based programs did not control for participation in the other intervention components and should be viewed in light of this limitation, especially since the home programs were distributed through classrooms and therefore not independent from the classroom component. In addition, self-selection cannot be ruled out as a threat to the validity of this finding since families were not randomly assigned to different levels of intervention exposure, but rather self-selected into exposure level. Nevertheless, the home-based approach appears to be able to reach low-income multi-ethnic families [40], even with less than half being two parent families, and such efforts implemented at an earlier age or more extensively may result in even greater benefits.
In summary, the overall adapted Project Northland intervention for Chicago youth was not effective in preventing or reducing alcohol use among urban youth. The only suggestion of effectiveness was for the home-based programs (in regards to reduced alcohol and drug use) and community organizing (in regards to a trend of reduced youth access to alcohol from commercial sources). Project Northland was previously effective in reducing alcohol use by 20 to 46% among youth living in rural communities in northern Minnesota [11]. Project Northland began in the 1990s. Thus, the socio-historical context in which Project Northland Chicago and the original efficacy trial were conducted differed. In Chicago, as in many cities across the country, adolescents today are more exposed to alcohol and drug prevention programs at an earlier age and to more of them throughout their school career. Thus, study results may partly differ from the original efficacy trial because the socio-historical context surrounding alcohol prevention programs has improved over the last 15 years with students exposed to more evidence-based programs than in the past. The control condition in trials like Project Northland Chicago in the current school environment cannot be considered a true control, but instead the intervention in Chicago was compared with “prevention as usual,” an issue to be addressed in future trials.
The social and environmental context of the neighborhoods in the Chicago study may have also influenced the effectiveness of the intervention. Even though rates of alcohol use among 8th graders in the study fall between national rates [47] and those found in the Minnesota study (e.g., past month use in MTF 2005-17%, Chicago-21%, Minnesota-28%), many community members did not rank alcohol use as a priority concern. Instead drug dealing, gangs, violence and housing were priority concerns. The study sample was primarily low-income with 72% of the children receiving free or reduced price lunch. There were on average 28 alcohol outlets per neighborhood unit (ranging from 7 to 107) and 15 alcohol advertisements (ranging from 0 to 109) within 1500 feet of each school participating in the study [48]. Previous research has found higher density of alcohol outlets in low-income, urban communities compared with more affluent neighborhoods [49, 50], and this puts low-income, urban communities at increased risk for alcohol-related problems [51, 52]. We found that exposure to alcohol advertising near schools at the end of 6th grade predicted alcohol intentions at the end of 8th grade [48]. It may be that in urban neighborhoods with a high proportion of families living in poverty and high exposure to alcohol outlets and advertisements, longer-term and more intense efforts are required for prevention of early onset of alcohol use and alcohol-related problems, including making significant changes in the environment.
The lack of positive outcomes from the Project Northland Chicago trial are similar to those reported in other recent adaptations or replications of prevention programs with minority, urban, low-income adolescents [16, 53, 54]. We need to rethink how we conduct research in urban and low-income communities, to more fully engage these communities as partners in the research process so that issues that matter to them most are addressed. Replications and adaptation studies are critical for prevention practice. The findings from the current study and others [16, 20, 21, 53, 54] highlight the importance of conducting replications and appropriate adaptations with different populations. We cannot assume that a program or strategy that works within one context will work within another.
The current study findings also highlight the need for further research with urban, low-income adolescents. Although it had been previously validated as a preventive alcohol intervention, Project Northland was not effective when adapted for an urban, disadvantaged environment. These results suggest that we need interventions based on expanded or alternative theoretical frameworks for urban, low-income youth. Research consistently shows that poverty has detrimental effects on school achievement, social and emotional development, and high risk behaviors [55, 56]. Adolescents living in high-poverty inner-city neighborhoods are especially at risk for feelings of hopelessness, and that has been found to be predictive of a variety of high risk behaviors [55]. Interventions may need to be longer and start prior to adolescence, with special emphasis on promoting early social competence and safe and health-enhancing environments within the home, school and neighborhood.
Acknowledgments
We are grateful for and acknowledge the support and partnership of students, parents, teachers, and administrators in our participating Chicago public schools. Dr. Inez Drummond, Manager, Office of Specialized Services, Chicago Public Schools, served as our primary district-level contact and helped us navigate the logistics of the school district in a timely and positive manner. Special acknowledgements go to our Chicago-based community organizers for implementation of the community intervention (Mirlene Cadichon, Britt Garton, Francisco Hernandez, Tamika Hinton, Carol G. Johnson, Oscar Lester, Angelique Orr, Maria T. Ramos, Gloria R. Riley, and Kate Weinans), the community action team members who worked diligently on alcohol use prevention initiatives, and our Community Advisory Committee members (Esther Sciammarella, MS; Elizabeth Copper, MPH; Marco Jacome, MA, CSADC, CEAP; Inez Drummond, Ed.D.; and Yesenia Vargas). Other management, development, and evaluation staff that deserve special acknowledgement include: 1) Karen Alfano served as the Evaluation Director and managed our excellent data collection staff; 2) Linda Bosma served as the Community Organizing Director during the first three years of the project, followed by Mirlene Cadichon during the last year of the intervention; 3) Barb Dahlquist, Susan Fitze, Jessica Hayssen, Karen Severson, and Mary Ann Thoma-Cox served as exceptional intervention and evaluation implementation support staff; 4) Mary Hearst was a productive research assistant helping especially with the community intervention and evaluation; 4) Bonnie Dudovitz served as the curriculum and parent education writer; 5) Glenn Quist provided graphic artistry for project materials; and 6) Verla Goeden provided outstanding secretarial and creative support with desktop publishing and graphic design. This study was funded by grant R01-AA13458 from the National Institute on Alcohol Abuse and Alcoholism awarded to Dr. Kelli A. Komro, PI.
References
- 1.Mokdad AH, Marks JS, Stroup DF, Gerverding JL. Actual causes of death in the United States, 2000. JAMA. 2004;291:1238–45. doi: 10.1001/jama.291.10.1238. [DOI] [PubMed] [Google Scholar]
- 2.Ellickson PL, Tucker JS, Klein DJ. Ten-year prospective study of public health problems associated with early drinking. Pediatrics. 2003 May;111:949–55. doi: 10.1542/peds.111.5.949. [DOI] [PubMed] [Google Scholar]
- 3.Warner LA, White HR. Longitudinal effects of age at onset and first drinking situations on problem drinking. Substance Use & Misuse. 2003;38:1983–2016. doi: 10.1081/ja-120025123. [DOI] [PubMed] [Google Scholar]
- 4.Greenblatt JC. Office of Applied Studies Working Paper. Rockville, MD: Substance Abuse and Mental Health Services Administration; 2000. Patterns of alcohol use among adolescents and associations with emotional and behavioral problems. [Google Scholar]
- 5.Hingson R, Heeren T, Levenson S, Jamanka A, Voas R. Age of drinking onset, driving after drinking, and involvement in alcohol related motor-vehicle crashes. Accident Analysis and Prevention. 2002 Jan;34:85–92. doi: 10.1016/s0001-4575(01)00002-1. [DOI] [PubMed] [Google Scholar]
- 6.Hingson R, Heeren T, Zakocs R. Age of drinking onset and involvement in physical fights after drinking. Pediatrics. 2001 Oct;108:872–7. doi: 10.1542/peds.108.4.872. [DOI] [PubMed] [Google Scholar]
- 7.National Research Council Institute of Medicine. Reducing Underage Drinking: A Collective Responsibility. Committee on Developing a Strategy to Reduce and Prevent Underage Drinking. Washington, DC: The National Academies Press; 2004. [PubMed] [Google Scholar]
- 8.Tobler NS, Roona MR, Ochshorn P, Marshall DG, Streke AV, Stackpole KM. School-based adolescent drug prevention programs: 1998 meta-analysis. The Journal of Primary Prevention. 2000;20:275–336. [Google Scholar]
- 9.Johnson CA, Pentz MA, Weber MD, Dwyer JH, Baer N, Mackinnon DP, et al. Relative Effectiveness of Comprehensive Community Programming for Drug-Abuse Prevention with High-Risk and Low-Risk Adolescents. Journal of Consulting and Clinical Psychology. 1990 Aug;58:447–56. doi: 10.1037//0022-006x.58.4.447. [DOI] [PubMed] [Google Scholar]
- 10.Perry CL, Williams CL, Forster JL, Wolfson M, Wagenaar AC, Finnegan JR, et al. Background, Conceptualization and Design of a Community-Wide Research-Program on Adolescent Alcohol-Use - Project Northland. Health Education Research. 1993 Mar;8:125–36. doi: 10.1093/her/8.1.125. [DOI] [PubMed] [Google Scholar]
- 11.Perry CL, Williams CL, Veblen-Mortenson S, Toomey TL, Komro KA, Anstine PS, et al. Project Northland: Outcomes of a communitywide alcohol use prevention program during early adolescence. American Journal of Public Health. 1996 Jul;86:956–65. doi: 10.2105/ajph.86.7.956. [DOI] [PMC free article] [PubMed] [Google Scholar]
- 12.United States Department of Education. Safe and drug-free schools and communities act: guidance for state and local implementation of programs: US Department of Education, Office of Safe and Drug-Free Schools. 2004. [Google Scholar]
- 13.Hallfors D, Cho H, Sanchez V, Khatapoush S, Kim HM, Bauer D. Efficacy vs effectiveness trial results of an indicated “model” substance abuse program: Implications for public health. American Journal of Public Health. 2006 Dec;96:2254–9. doi: 10.2105/AJPH.2005.067462. [DOI] [PMC free article] [PubMed] [Google Scholar]
- 14.Flewelling RL, Austin D, Hale K, LaPlante M, Liebig M, Piasecki L, et al. Implementing research-based substance abuse prevention in communities: Effects of a coalition-based prevention initiative in Vermont. Journal of Community Psychology. 2005 May;33:333–53. [Google Scholar]
- 15.Botvin GJ, Griffin KW, Diaz T, Ifill-Williams M. Drug abuse prevention among minority adolescents: posttest and one-year follow-up of a school-based preventive intervention. Prevention Science. 2001;2:1–13. doi: 10.1023/a:1010025311161. [DOI] [PubMed] [Google Scholar]
- 16.Gottfredson D, Kumpfer K, Polizzi-Fox D, Wilson D, Puryear V, Beatty P, et al. The Strengthening Washington DC Families project: A randomized effectiveness trial of family-based prevention. Prevention Science. 2006 Mar;7:57–74. doi: 10.1007/s11121-005-0017-y. [DOI] [PubMed] [Google Scholar]
- 17.Griffin KW, Botvin GJ, Nichols TR, Doyle MM. Effectiveness of a universal drug abuse prevention approach for youth at high risk for substance use initiation. Preventive Medicine. 2003 Jan;36:1–7. doi: 10.1006/pmed.2002.1133. [DOI] [PubMed] [Google Scholar]
- 18.Martinez CR, Eddy JM. Effects of culturally adapted Parent Management Training on Latino youth behavioral health outcomes. Journal of Consulting and Clinical Psychology. 2005 Oct;73:841–51. doi: 10.1037/0022-006X.73.5.841. [DOI] [PubMed] [Google Scholar]
- 19.Santisteban DA, Coatsworth JD, Perez-Vidal A, Kurtines WM, Schwartz SJ, LaPerriere A, et al. Efficacy of brief strategic family therapy in modifying Hispanic adolescent behavior problems and substance use. Journal of Family Psychology. 2003 Mar;17:121–33. doi: 10.1037/0893-3200.17.1.121. [DOI] [PMC free article] [PubMed] [Google Scholar]
- 20.Spoth R, Randall GK, Shin C, Redmond C. Randomized study of combined universal family and school preventive interventions: Patterns of long-term effects on initiation, regular use, and weekly drunkenness. Psychology of Addictive Behaviors. 2005 Dec;19:372–81. doi: 10.1037/0893-164X.19.4.372. [DOI] [PMC free article] [PubMed] [Google Scholar]
- 21.Vicary JR, Smith EA, Swisher JD, Bechtel LJ, Elek E, Henry KL, et al. Results of a 3-year study of two methods of delivery of life skills training. Health Education & Behavior. 2006 Jun;33:325–39. doi: 10.1177/1090198105285020. [DOI] [PubMed] [Google Scholar]
- 22.Komro KA, Perry CL, Veblen-Mortenson S, Bosma LM, Dudovitz BS, Williams CL, et al. Brief report: The adaptation of Project Northland for urban youth. Journal of Pediatric Psychology. 2004 Sep;29:457–66. doi: 10.1093/jpepsy/jsh049. [DOI] [PubMed] [Google Scholar]
- 23.Flay BR, Petraitis J. The theory of triadic influence: a new theory of health behavior with implications for preventive interventions. Advances in Medical Sociology. 1994;4:19–44. [Google Scholar]
- 24.Perry CL. Creating Health Behavior Change: How to Develop Community-Wide Programs for Youth. Thousand Oaks, CA: Sage Publications; 1999. [Google Scholar]
- 25.Johnston LD, O'Malley PM, Bachman JG, Schulenberg JE. Overview of key findings 2004. Bethesda, MD: National Institute on Drug Abuse; 2005. Monitoring The Future: National Results on Adolescent Drug Use. [Google Scholar]
- 26.Komro KA, Perry CL, Munson KA, Stigler MH, Farbakhsh K. Reliability and validity of self-report measures to evaluate drug and violence prevention programs. Journal of Child & Adolescent Substance Abuse. 2004;13:17–51. [Google Scholar]
- 27.Flay BR, Graumlich S, Segawa E, Burns JL, Holliday MY. Effects of 2 prevention programs on high-risk behaviors among African American youth. Archives of Pediatric & Adolescent Medicine. 2004;158:377–84. doi: 10.1001/archpedi.158.4.377. [DOI] [PMC free article] [PubMed] [Google Scholar]
- 28.Komro KA, Perry CL, Williams CL, Veblen-Mortenson S, Forster J, Munson K, et al. Research and evaluation design of a community-wide program to reduce adolescent alcohol use: Project Northland Phase II. In: Casswell S, editor. Kettil Bruun Society thematic meeting: fourth symposium on community action research and the prevention of alcohol and other drug problems. Auckland, New Zealand: Alcohol & Public Health Research Unit, University of Auckland; 1999. pp. 181–93. [Google Scholar]
- 29.Wagenaar AC, Streff FM. Public opinion on alcohol policy. Journal of Public Health Policy. 1990;17:189–205. [PubMed] [Google Scholar]
- 30.Forster JL, McGovern PG, Wagenaar AC, Wolfson M, Perry CL, Anstine PS. The Ability of Young-People to Purchase Alcohol without Age Identification in Northeastern Minnesota, USA. Addiction. 1994 Jun;89:699–705. doi: 10.1111/j.1360-0443.1994.tb00956.x. [DOI] [PubMed] [Google Scholar]
- 31.Wagenaar AC, Toomey TL, Erickson DJ. Complying with the minimum drinking age: Effects of enforcement and training interventions. Alcoholism-Clinical and Experimental Research. 2005 Feb;29:255–62. doi: 10.1097/01.alc.0000153540.97325.3a. [DOI] [PubMed] [Google Scholar]
- 32.Hansen WB, Tobler NS, Graham JW. Attrition in Substance-Abuse Prevention Research - a Meta-analysis of 85 Longitudinally Followed Cohorts. Evaluation Review. 1990 Dec;14:677–85. [Google Scholar]
- 33.Murray DM. Design and Analysis of Group-Randomized Trials. New York: Oxford; 1998. [Google Scholar]
- 34.Raudenbush SW, Bryk AS. Hierarchical linear models. Newbury Park, CA: Sage; 1992. [Google Scholar]
- 35.Du Toit S, Du Toit M, Cudeck R. Introduction to the analysis of multilevel models with LISREL 8.30. Lincolnwood, IL: Scientific Software International; 1999. [Google Scholar]
- 36.Jöreskog KG, Sörbom D. LISREL 8.72. Chicago: Scientific Software International; 2005. [Google Scholar]
- 37.Schafer JL, Graham JW. Missing data: Our view of the state of the art. Psychological Methods. 2002;7:147–77. [PubMed] [Google Scholar]
- 38.SAS. The SAS System for Windows (Release 9.1) Cary, NC: SAS Institute, Inc.; 2003. [Google Scholar]
- 39.Stigler MH, Perry CL, Komro KA, Cudeck R, Williams CL. Teasing apart a multiple component approach to adolescent alcohol prevention: What worked in Project Northland? Prevention Science. 2006 Sep;7:269–80. doi: 10.1007/s11121-006-0040-7. [DOI] [PubMed] [Google Scholar]
- 40.Komro KA, Perry CL, Veblen-Mortenson S, Farbakhsh K, Kugler KC, Alfano KA, et al. Cross-cultural adaptation of a home-based program for alcohol use prevention among urban youth: The Slick Tracy Home Team Program. The Journal of Primary Prevention. 2006;27:135–54. doi: 10.1007/s10935-005-0029-1. [DOI] [PubMed] [Google Scholar]
- 41.Williams CL, Perry CL, Dudovitz B, Veblen-Mortenson S, Anstine PS, Komro KA, et al. A home-based prevention program for sixth-grade alcohol use: results from Project Northland. The Journal of Primary Prevention. 1995;16:125–47. doi: 10.1007/BF02407336. [DOI] [PubMed] [Google Scholar]
- 42.Toomey TL, Williams CL, Perry CL, Murray DM, Dudovitz B, Veblen-Mortenson S. An alcohol primary prevention program for parents of 7th graders: The amazing alternatives! Home program. Journal of Child & Adolescent Substance Abuse. 1996;5:35–53. [Google Scholar]
- 43.Komro KA, Perry CL, Murray DM, Veblen-Mortenson S, Williams CL, Anstine PS. Peer-planned social activities for preventing alcohol use among young adolescents. Journal of School Health. 1996;66:328–34. doi: 10.1111/j.1746-1561.1996.tb03413.x. [DOI] [PubMed] [Google Scholar]
- 44.Perry CL, Williams CL, Komro KA, Veblen-Mortenson S, Stigler MH, Munson KA, et al. Project Northland: long-term outcomes of community action to reduce adolescent alcohol use. Health Education Research. 2002 Feb;17:117–32. doi: 10.1093/her/17.1.117. [DOI] [PubMed] [Google Scholar]
- 45.Wagenaar AC, Murray DM, Gehan JP, Wolfson M, Forster J, Toomey TL, et al. Communities Mobilizing for Change on Alcohol: outcomes from a randomized community trial. Journal of Studies on Alcohol. 2000;61:85–94. doi: 10.15288/jsa.2000.61.85. [DOI] [PubMed] [Google Scholar]
- 46.Hearst MO, Fulkerson JA, Maldonado-Molina MM, Perry CL, Komro KA. Who needs liquor stores when parents will do? The importance of social sources of alcohol among young urban teens. Preventive Medicine. 2007;44:471–476. doi: 10.1016/j.ypmed.2007.02.018. [DOI] [PMC free article] [PubMed] [Google Scholar]
- 47.Johnston LD, O'Malley PM, Bachman JG, Schulenberg JE. Volume I: Secondary school students. Bethesda, MD: National Institute on Drug Abuse; 2006. Monitoring the Future national survey results on drug use, 1975-2005. [Google Scholar]
- 48.Pasch KE, Komro KA, Perry CL, Hearst M, Farbakhsh K. Outdoor alcohol advertising near schools: What does it advertise and how is it related to intentions and use of alcohol among young adolescents? Journal of Studies on Alcohol & Drugs. 2007;68:587–96. doi: 10.15288/jsad.2007.68.587. [DOI] [PubMed] [Google Scholar]
- 49.LaVeist TA, Wallace JM. Health risk and inequitable distribution of liquor stores in African American neighborhood. Social Science & Medicine. 2000 Aug;51:613–7. doi: 10.1016/s0277-9536(00)00004-6. [DOI] [PubMed] [Google Scholar]
- 50.Romley JA, Cohen D, Ringel J, Sturm R. Alcohol and environmental justice: The density of liquor stores and bars in urban neighborhoods in the United States. Journal of Studies on Alcohol. 2007 Jan;68:48–55. doi: 10.15288/jsad.2007.68.48. [DOI] [PubMed] [Google Scholar]
- 51.Gruenewald PJ, Freisthler B, Remer L, LaScala EA, Treno A. Ecological models of alcohol outlets and violent assaults: crime potentials and geospatial analysis. Addiction. 2006 May;101:666–77. doi: 10.1111/j.1360-0443.2006.01405.x. [DOI] [PubMed] [Google Scholar]
- 52.Gruenewald PJ, Remer L. Changes in outlet densities affect violence rates. Alcoholism-Clinical and Experimental Research. 2006 Jul;30:1184–93. doi: 10.1111/j.1530-0277.2006.00141.x. [DOI] [PubMed] [Google Scholar]
- 53.Cho HS, Halfors DD, Sanchez V. Evaluation of a high school peer group intervention for at-risk youth. Journal of Abnormal Child Psychology. 2005 Jun;33:363–374. doi: 10.1007/s10802-005-3574-4. [DOI] [PubMed] [Google Scholar]
- 54.Spoth R, Guyll M, Chao W, Molgaard V. Exploratory study of a preventive intervention with general population African American families. Journal of Early Adolescence. 2003 Nov;23:435–68. [Google Scholar]
- 55.Bolland JM. Hopelessness and risk behaviour among adolescents living in high-poverty inner-city neighbourhoods. Journal of Adolescence. 2003 Apr;26:145–58. doi: 10.1016/s0140-1971(02)00136-7. [DOI] [PubMed] [Google Scholar]
- 56.McLoyd VC. Socioeconomic disadvantage and child development. American Psychologist. 1998 Feb;53:185–204. doi: 10.1037//0003-066x.53.2.185. [DOI] [PubMed] [Google Scholar]