

Abstract
Objective
To evaluate whether HRV measures are predictive of neurological outcome in babies with hypoxic ischemic encephalopathy (HIE).
Study Design
This case-control investigation included 20 term encephalopathic newborns treated with systemic hypothermia in a regional NICU. Electrocardiographic data were collected continuously during hypothermia. Spectral analysis of beat-to-beat heart rate interval was used to quantify HRV. HRV measures were compared between infants with adverse outcome (death or neurodevelopmental impairment at 15 months, n=10) and those with favorable outcome (survivors without impairment, n=10).
Results
HRV differentiated infants by outcome during hypothermia through post-rewarming, with the best distinction between groups at 24 hours and after 80 hours of life.
Conclusions
HRV during hypothermia treatment distinguished HIE babies who subsequently died or had neurodevelopmental impairment from intact survivors. This physiological biomarker may identify infants in need of adjuvant neuroprotective interventions. These findings warrant further investigation in a larger population of infants with HIE.
Perinatal hypoxic ischemic encephalopathy (HIE) is a major cause of death and long-term disability in children.1, 2 Although therapeutic hypothermia improves outcomes in babies with HIE, approximately half of treated infants continue to suffer death or disability despite treatment with cooling.3–6 Additional work is needed, and ongoing, to identify adjuvant therapies aimed to further improve outcome in this high-risk population. Key to advancing neuroprotective interventions in babies with HIE, is the ability to tailor therapies to an individual’s biological profile and ongoing response (or non-response) to treatment. Physiological biomarkers of brain injury can help to identify appropriate candidates for treatment, gauge treatment failure with need for escalation of therapy, and offer means for prognostication during and after intervention in babies with HIE.
A major impediment to the design of more effective neuroprotection is the lack of continuous real-time monitoring techniques capable of identifying critical thresholds in the early evolution of neonatal brain injury, and its response to intervention. This problem is compounded by the narrow therapeutic window for most neuroprotective agents. Current methods to assess brain injury risk in the critically-ill newborn are inadequate. Clinical exam is subjective, often confounded by neuroactive medications or medical devices, and evolves over time7, 8 requiring serial assessments that can be time and resource consuming. While magnetic resonance imaging (MRI) is helpful to discern structural brain injury, its utility is limited by the need for transport, requisite neuroradiology personnel with neonatal expertise for accurate interpretation, and limited sensitivity in the first 24 hours of life when key therapeutic decisions are often made.9, 10 Although advances in digital electroencephalography (EEG) monitors have improved continuous neuromonitoring capabilities, these tools likewise require specialized equipment and interpretive expertise. Thus, a bedside tool that provides an easily interpretable measure of neurological risk is needed in the intensive care unit.
Continuous cardiorespiratory monitoring has long aided clinicians in caring for the most critically ill infants. However, these physiological data are currently used only at the most basic level for clinical decision-making. This results in identifying critical events well after their occurrences, such as recognition of bradycardia or systemic oxygen desaturation. Advanced physiological signals processing of data acquired during critical care may augment the current monitoring scheme by detecting patterned changes that can serve as earlier indicators of autonomic failure, allowing for preventative interventions before systemic or neurological compromise to the patient. Specifically, interrogation of heart rate variability (HRV) via quantitative means may provide such actionable information. Few studies have evaluated HRV in babies with HIE.11–13 While preliminary studies have demonstrated reduced HRV in more severely affected infants, no studies have evaluated changes in HRV over time in HIE newborns undergoing hypothermia. This study aims to evaluate the evolution of HRV during the first 4 days of life and whether HRV measures are predictive of neurological outcome in babies with HIE.
METHODS
Study Population
This study included newborns who were part of an ongoing prospective longitudinal study evaluating physiological and biochemical biomarkers of brain injury in babies with HIE. Infants were treated with whole-body hypothermia according to the NICHD Neonatal Research Network protocol, with inclusion criteria according to established NICHD criteria (i.e. infants were greater than 36 weeks gestational age, greater than 1800 grams at birth, demonstrated metabolic acidosis and/or low Apgar scores, and exhibited signs of moderate to severe clinical encephalopathy).3 Infants were cooled using the Blanketrol® II cooling unit (Cincinnati Sub-Zero, Cincinnati OH) for 72 hours followed by rewarming over 6 hours. Twenty infants with available outcome data were randomly selected from the overall cohort of 64 patients for this nested case-control secondary study. Infants were stratified by outcome into two groups: 1) cases with adverse outcome defined as death in the neonatal period or Bayley Developmental Index scores >2SD below the mean at 15 month follow-up and 2) controls with favorable outcome defined as survivors with Bayley scores within 2SD at 15 months. The study was approved by the Children’s National Medical Center Institutional Review Board. Informed consent and Health Insurance Portability and Authorization Act Authorization was obtained from the parent of the participant for the parent study, which included provisions for secondary analyses of clinical data collected during the participants’ NICU course.
Clinical and Outcome Data Collection
Clinical and outcome data were extracted from the parent study database that includes data collected from birth hospital and study site medical records. Presenting characteristics were noted, including umbilical cord or arterial blood gas obtained in the first hour of life, Apgar scores and initial grade of encephalopathy classified according to modified Sarnat criteria.3, 14 Data from the infants’ NICU hospitalization was also collected including hour of cooling initiation, need for vasoactive therapy, and mortality. Enrolled participants were followed longitudinally in our developmental follow-up program and assessed with the Bayley Scales of Infant Development – Second Edition (BSID-II).15 The BSID-II is a standardized assessment that evaluates a child’s level of cognitive/language skills (reflected by the Mental Developmental Index- MDI) and fine and gross motor development (reflected by the Psychomotor Developmental Index – PDI). MDI or PDI scores of 100 ± 15 represent the mean ± 1sd. Although the Third Edition of the Bayley Scales became available in 2006,16 our clinical program continued to use the BSID-II for developmental assessment during the study period in order to have comparable data to previously described infants treated for HIE.3, 6 Evaluations were performed by an experienced developmental psychologist who was blinded to the clinical history of the child and scores were entered into the database following each subject’s visit to the clinic.
EKG Signal Processing
Electrocardiogram (EKG) data were retrieved from archived continuous EEG recordings obtained from each participant. Infants treated with hypothermia during the study period underwent routine continuous EEG monitoring (NicoletOne™ system, Viasys Healthcare, San Diego CA) initiated as soon as possible after admission and continued through at least 12 hours after completion of rewarming. Signal processing was done using MATLAB (Mathworks, Inc., MA, USA). The data was sampled at 256 Hz. EKG data was isolated and bandpass filtered between 0.5–70Hz using Butterworth filter with zero-phase distortion. Artifacts caused by missing data were excluded. The R-wave was identified using adaptive Hilbert transform approach17, 18 and beat-to-beat interval (RR interval) was computed as successive difference of R-wave occurrence expressed in seconds. The RR interval was converted into evenly sampled data using cubic-spline interpolation at a sample rate of 4 Hz. The RR interval was divided into 10-minute windows. In each 10-minute window, the power spectrum was estimated via previously described methods.19, 20 The relative low-frequency (LF) and high frequency (HF) power were analyzed as measures of autonomic nervous system (ANS) regulation of HRV.21–23 The power in the LF band quantifies predominantly the sympathetic components, while the HF band quantifies the parasympathetic (vagal) components of the ANS. The LF power was calculated as the sum of power in the frequency bands covering 0.05–0.25 Hz11, while HF power was calculated as the sum of power in the frequency bands covering 0.3–0.8 Hz.11, 24 Both LF and HF power were divided by the total power (sum of power in the frequency bands covering 0.05–2Hz) to calculate the relative LF and HF power. Continuous HRV data were partitioned into 3-hour windows for analyses over time. If patients were off EEG at any point during the 3-hour window (e.g. for imaging studies, for EEG electrode replacement or other clinical reasons), those particular 10-minute epochs were excluded. Group comparisons were made between all power spectrum calculations within a given 3-hour time window.
Statistical Analysis
Descriptive statistics included standard measures of central tendency and variability for continuous data and frequencies for categorical variables. Non-parametric testing (Wilcoxin Rank-Sum Test) was used to evaluate the differences in HRV measures in each 3-hour window between outcome groups. Intra-subject correlation was not considered in these analyses. Correction for multiple comparisons across the total number of 3-hour time windows (n=34) was performed with the Bonferroni method. The predictive ability of HRV to distinguish outcome groups was further evaluated by receiver operating curve (ROC) analyses where the area under the curve (AUC) of 1 denotes 100% model discrimination, whereas an AUC of 0.5 signifies no significant ability of the test (HRV) to distinguish between outcome groups. Values of 0.7–0.8 are considered acceptable, and values of greater than 0.8 are considered excellent. Thus, the magnitude of the AUC is a reflection of the predictive ability of HRV at a given time point to predict adverse outcome.
RESULTS
Ten infants were included in each outcome group. Infants with adverse outcome were more likely to present with severe clinical encephalopathy and had lower presenting pH and 10-minute Apgar score. Otherwise, demographic and clinical characteristics were similar between groups (Table 1). The adverse outcome group was comprised of 5 infants who died in the neonatal period and 5 infants who survived with neurodevelopmental impairment (4 infants with Bayley MDI and PDI <50 and 1 infant with PDI <70). All deaths were due to withdrawal of care due to poor neurological prognosis (based on severely abnormal EEG background pattern, clinical exam and neuroimaging findings). Three infants were withdrawn prior to the completion of rewarming but after 48 hours of life. The favorable outcome group included 10 infants who survived with developmental scores within the normal range: MDI median (range)= 92 (81–103), PDI= 89 (77–101) at 15-month follow-up assessment.
Table 1.
| Adverse Outcome (n=10) |
Favorable Outcome (n=10) |
P Value | |
|---|---|---|---|
| Gestational Age (wks) | 38.9±0.4 | 38.5±0.6 | 0.628 |
| Birth weight (kg) | 3.63±0.15 | 3.33±0.29 | 0.375 |
| Head Circumference (cm) | 35.0±0.4 | 34.1±0.7 | 0.294 |
| Gender (n male) | 7 | 4 | 0.178 |
| Initial pH* a | 6.80 (6.50–7.15) | 7.00 (6.79–7.30) | 0.026 |
| Initial Base Deficitb | 19.2±2.9 | 20.1±2.7 | 0.829 |
| Apgars* | |||
| 1 minute | 0 (0–4) | 2 (0–6) | 0.168 |
| 5 minute | 1 (0–5) | 5 (0–7) | 0.065 |
| 10 minutec | 3 (0–6) | 6.5 (2–7) | 0.040 |
| Cesarean Delivery (n) | 8 | 5 | 0.160 |
| Encephalopathy Grade | 0.002 | ||
| Moderate (n) | 2 | 9 | |
| Severe (n) | 8 | 1 | |
| Clinical Seizures at Presentation (n) | 4 | 2 | 0.329 |
| Patients with EEG Seizures during monitoring (n) | 7 | 1 | 0.006 |
| Hour of Life Cooling Started | 4.0±0.4 | 4.6±0.3 | 0.297 |
| Hour of Life HRV Started | 11.1±1.6 | 13.3±1.8 | 0.397 |
| Patients on Vasoactives (n) | 6 | 3 | 0.178 |
| Ventilator Days* | 8 (4–22)d | 2 (1–5) | 0.003 |
| Age at Follow-up | 15.6±0.5 | 15.2±0.3 | 0.235 |
Data presented as mean ± SEM except where noted, *median (range)
Documented for 9/10 patients
Documented for 6/10 patients and 8/10 patients
Documented for 8/10 patients and 6/10 patients
Duration of mechanical ventilation presented for surviving infants
HRV = Heart rate variability recording
EEG/EKG monitoring began at a median 11.6 (Range 4.7–40.7) hours of life. Total study duration varied between 20–110 hours (median 90.05 hours). Shorter duration studies were, as expected, present in the infants who died during cooling. Evolution of HRV over time for each outcome group is depicted in Figure 1. LF relative power was lower at nearly all timepoints in infants in the adverse outcome group compared to those with favorable outcome. These differences remained statistically significant (p<0.01) between 18–54 hours (except at 39 hours) and after 80 hours when controlling for multiple comparisons. In contrast, HF relative power was significantly higher in the adverse outcome group at nearly all time points.
Figure 1.
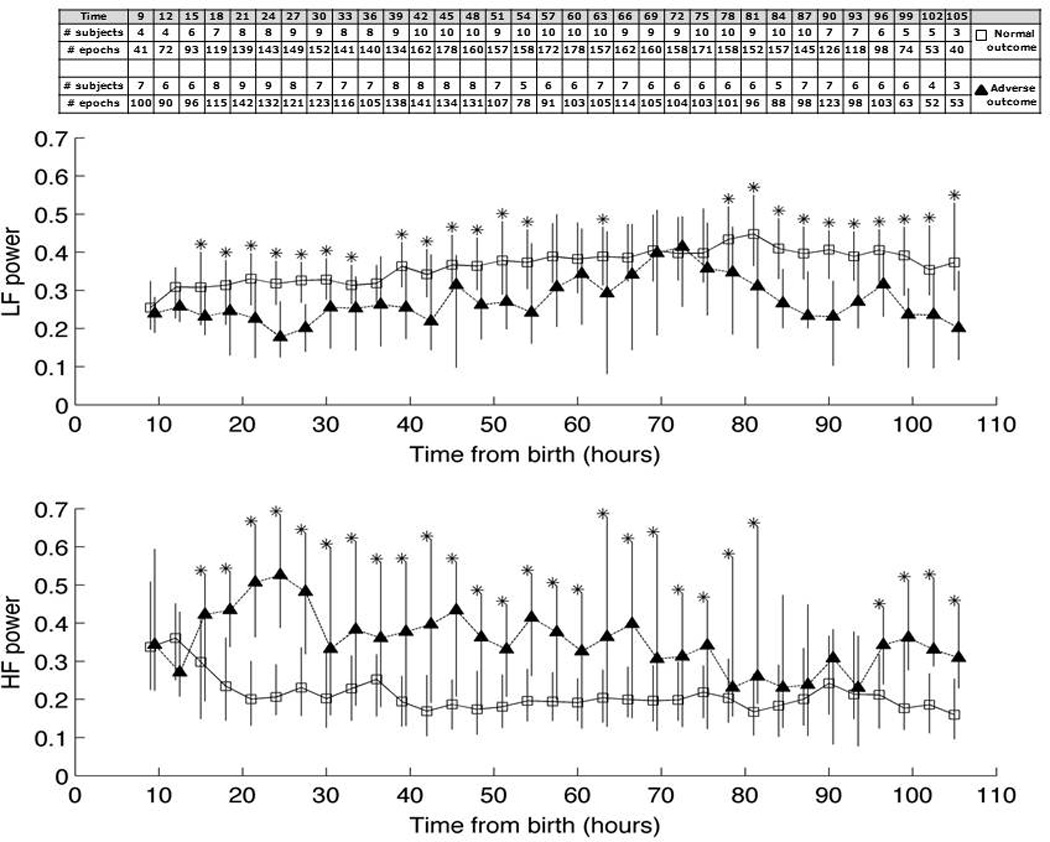
Heart rate variability (HRV), expressed as relative [A] low-frequency (LF) and [B] high-frequency (HF) power, over time from birth in favorable outcome (open squares) versus adverse outcome (filled triangles) groups. Data is depicted as median (IQR). Number of epochs per comparison and number of patients from whom data were available are shown in the embedded table. Asterisks mark significant differences (p<0.01) between groups after Bonferonni correction.
Area under the receiver operating curve for discrimination of outcome group is plotted over time in Figure 2. The highest AUC values for LF relative power were demonstrated around 24 hours of life and after 80 hours of life. This signifies two key periods of vulnerability, during which time the separation between outcome groups became most evident. For HF relative power, a similar peak AUC was observed around 24 hours of life, while the second increase in AUC was observed after 96 hours of life. Selected cutpoints at key time periods of peak AUC and their respective sensitivities and specificities are presented in Table 2.
Figure 2.
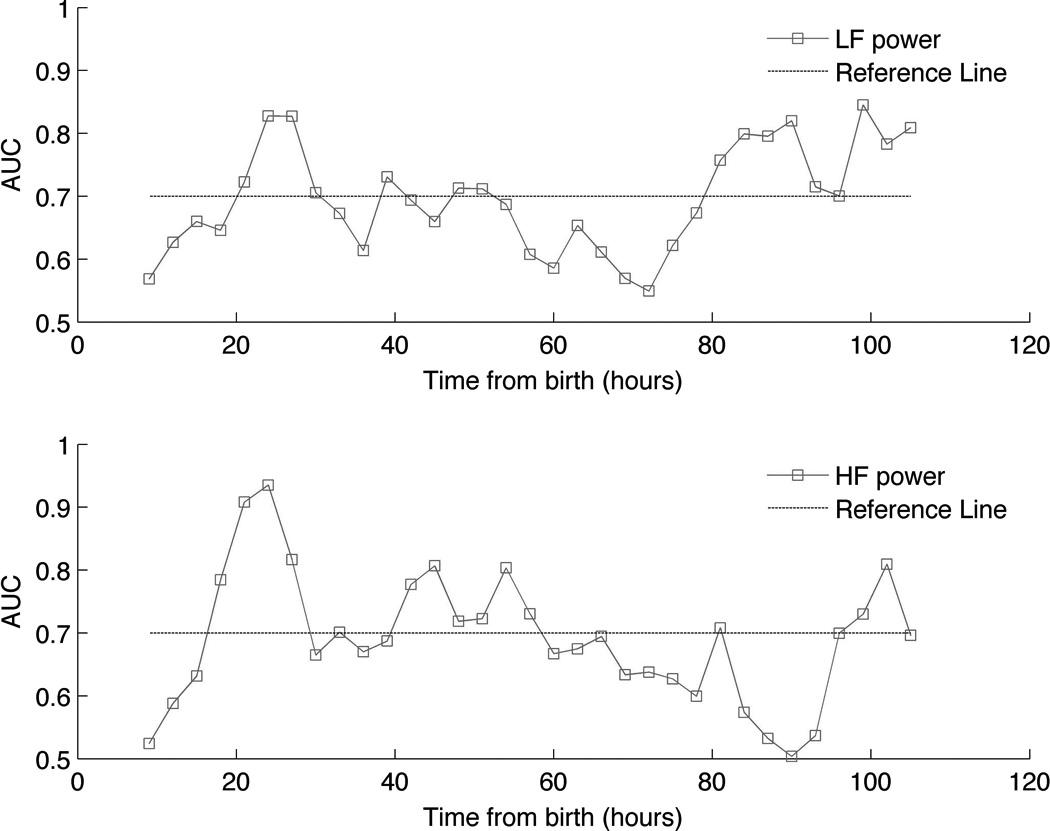
Area under the receiver operating curve (AUC) values plotted over time for ability of relative [A] low-frequency (LF) and [B] high-frequency (HF) power to discriminate between outcome groups. Dashed reference line is provided at the AUC value of 0.7. Note the relative peaks at 24 hours and after 80 hours of life.
Table 2.
Selected Cutpoints and Predictive Values from the ROC
| Time Window (hour of life) |
Cutpoint | Sensitivity | Specificity | AUC | |
|---|---|---|---|---|---|
| LF Relative Power | 24–27 | 0.21 | 0.92 | 0.7 | 0.83 |
| 93–96 | 0.32 | 0.8 | 0.65 | 0.82 | |
| HF Relative Power | 24–27 | 0.34 | 0.84 | 0.87 | 0.94 |
| 102–105 | 0.27 | 0.81 | 0.76 | 0.81 |
DISCUSSION
This is the first study to evaluate the evolution of HRV longitudinally over the course of hypothermia and rewarming in newborns with HIE. Consistent with prior work evaluating short periods of EKG data in babies with HIE,12, 13 we demonstrated that HIE infants with adverse outcome have decreased HRV compared to infants with favorable outcome. However, this study suggests that HRV is most affected in brain-injured patients during two key periods of vulnerability: 1) at 24 hours of life coincident with the peak of secondary energy failure, and 2) after 80 hours of life upon the completion of rewarming. That the discriminatory power of HRV reflects these known pathophysiological and clinical events supports its validity as a biomarker of ongoing brain injury in this population.
The clinical significance of HRV was first described as a harbinger of fetal distress26. HRV has since been described as a predictor of outcome in other high-risk populations including neurosurgical patients,27 patients traumatic brain injury28, preterm infants29, 30, newborns with sepsis31 and necrotizing enterocolitis,32 and other critically ill populations.33 Few studies have evaluated HRV in newborns with HIE. Aliefendioglu and colleagues12 evaluated HRV on EKG data from 22 HIE infants (of whom 10 had severe HIE) at one week of life. While they found HRV to differentiate HIE infants with moderate versus severe encephalopathy, distinction between these groups after the acute phase of injury has limited therapeutic implications. More recently, Matic and colleagues evaluated EKG data from 19 HIE infants during the first 48 hours of life and found several heart rate characteristics to be predictive of outcome by MRI and developmental assessment.13 The investigators evaluated 2-hour EKG segments recorded any time during the first 18–48 hours of life. This intermittent sampling at variable ages did not allow the investigators to establish the role of HRV in the context of the evolving process of brain injury. The advantages of our study include the longitudinal recordings and comparative analyses between groups based on time from birth. This approach enabled inferences that could account for recovery from initial insult and any maturational effects of postnatal age. One prior case report described HRV changes during the rewarming phase,11 supporting the importance of group comparisons at similar stages of physiological response to injury and critical care interventions.
While other methods have been described to characterize HRV,34 power spectral analysis of the beat to beat (RR) interval was first described by Akselrod and colleagues35 as an advanced signals processing approach for quantitative analysis of HRV in continuous EKG data. Both animal and human studies have supported the notion that reduced spectral power in the low-frequency component of the EKG signal is indicative of impaired autonomic nervous system (ANS) function.21–23 In the aforementioned study by Matic and colleagues, LF power was amongst the best discriminators of outcome selected from 24 different quantitative HRV parameters evaluated.13 Relative HF power also discriminated between groups. Increased HF power within the adverse outcome group likely reflects increased ventilator dependency in these critically-ill patients, as the respiratory sinus arrhythmia is represented in the HF band.24
A key finding of the current study is the temporal evolution of HRV in the two outcome groups. It is well established that hypoxia-ischemia triggers a delayed series of events (i.e. excitotoxic, pro-inflammatory, oxidative stress, and pro-apoptotic cell signaling pathways) that lead to cell death in the brain. The timing of this secondary injury cascade has been demonstrated via both laboratory and clinical observations to peak after 24 hours post-insult. This secondary injury is mitigated by hypothermia treatment. However, it is known that hypothermia does not benefit all patients, and that death and disability are frequent outcomes despite treatment with cooling. The prominent reduction in HRV seen around 24 hours of life in the adverse outcome group may identify infants in whom hypothermia is failing to prevent secondary energy failure and subsequent brain injury. Thus, HRV may be helpful in selecting patients for adjuvant neuroprotective therapies. The second significant distinguishing HRV time period occurred after 80 hours of life following the completion of rewarming. It is possible that HRV changes in the adverse outcome group signified progression of injury after the cessation of cooling. Thus, HRV may help determine the adequate duration of cooling on an individualized basis, which is currently unknown.
There are limitations to the current study. The association between hypoxic-ischemic insults and reduced HRV may be related to several factors. Whether decreased HRV is related to direct effects of asphyxia on the myocardium, the impact of medications or other critical care interventions, brainstem injury leading to autonomic dysfunction, presence of seizures or a combination of these factors cannot be elucidated by this study. That patients in the adverse outcome group required more vasopressor support is perhaps indicative of myocardial dysfunction that could be contributory to reduced HRV. It is important to note that we did not control for the effect of seizures in these analyses. Seizure has been reported to have complex interaction with HRV depending on the location, propagation and duration of the ictal activity.37–39 It is possible that the some of the alterations seen in HRV in the adverse outcome group may therefore be attributable to seizure activity, as the predominant seizure burden was observed in this group. However, given the aim of this pilot study was to evaluate the temporal evolution of HRV and its relation to outcome, elucidating the effect of seizures and other possible etiological factors that could explain why HRV relates to poor outcomes was beyond the scope of this study. The interaction of these factors with the association between HRV and outcome warrant further study in a larger population. The assessment of developmental outcome at 15-months in surviving infants was performed according to our clinical protocol during the study period. It is recognized that neurodevelopmental assessment at this relatively early age may be considered less reliable and further work is needed (on ongoing) to correlate HRV measures with longer-term outcome. Missing data was another important consideration and potential source of bias. Initiation (and cessation) of EEG/EKG recordings was influenced by many clinical and logistic factors that could not be controlled for the purposes of this study. Artifact in the EKG recordings could also impact results, as this is not an uncommon occurrence in the intensive care unit setting. However, our analytical approach incorporated an automated artifact rejection method and a modification that mitigated effects of non-stationarity in the data that could result from signal artifact.20 It should be noted that although we used a well established method to interrogate HRV, other methods to quantify heart rate characteristics have been proposed. For example, while evaluation of LF/HF ratio as a measure of symptho-vagal balance has also been reported, we did not evaluate this metric as recent reports have questioned whether this measure accurately reflects the pathophysiological condition.36 Another limitation of this preliminary study is the small sample size, although this was mitigated by the large number of observations provided by a continuous dataset. However, as we did not consider intra-subject correlation in these analyses, and the few patients included may not be representative of a larger HIE population, we consider these analyses hypothesis generating that warrant confirmation in a larger prospective study.
CONCLUSIONS
Heart rate variability during hypothermia treatment and after rewarming distinguished HIE infants who died or had neurodevelopmental impairment from intact survivors. Quantitative measures of HRV may provide a robust bedside physiological biomarker of ongoing brain injury that can help direct therapeutic interventions in babies with HIE.
ACKNOWLEDGEMENTS
This project was supported by Award Numbers UL1RR031988 and KL2 RR031987 from the NIH National Center for Research Resources. Its contents are solely the responsibility of the authors and do not necessarily represent the official views of the National Center for Research Resources or the National Institutes of Health
Footnotes
CONFLICT OF INTEREST
The authors have no conflicts of interest to declare.
REFERENCES
- 1.Shankaran S, Woldt E, Koepke T, Bedard MP, Nandyal R. Acute neonatal morbidity and long-term central nervous system sequelae of perinatal asphyxia in term infants. Early Hum Dev. 1991;25:135–148. doi: 10.1016/0378-3782(91)90191-5. [DOI] [PubMed] [Google Scholar]
- 2.Dilenge ME, Majnemer A, Shevell MI. Long-term developmental outcome of asphyxiated term neonates. J Child Neurol. 2001;16:781–792. doi: 10.1177/08830738010160110201. [DOI] [PubMed] [Google Scholar]
- 3.Shankaran S, Laptook AR, Ehrenkranz RA, et al. Whole-body hypothermia for neonates with hypoxic-ischemic encephalopathy. N Engl J Med. 2005;353:1574–1584. doi: 10.1056/NEJMcps050929. [DOI] [PubMed] [Google Scholar]
- 4.Azzopardi DV, Strohm B, Edwards AD, et al. Moderate hypothermia to treat perinatal asphyxial encephalopathy. N Engl J Med. 2009;361:1349–1358. doi: 10.1056/NEJMoa0900854. [DOI] [PubMed] [Google Scholar]
- 5.Jacobs SE, Morley CJ, Inder TE, et al. Whole-body hypothermia for term and near-term newborns with hypoxic-ischemic encephalopathy: a randomized controlled trial. Arch Pediatr Adolesc Med. 2011;165:692–700. doi: 10.1001/archpediatrics.2011.43. [DOI] [PubMed] [Google Scholar]
- 6.Gluckman PD, Wyatt JS, Azzopardi D, et al. Selective head cooling with mild systemic hypothermia after neonatal encephalopathy: multicentre randomised trial. Lancet. 2005;365:663–670. doi: 10.1016/S0140-6736(05)17946-X. [DOI] [PubMed] [Google Scholar]
- 7.Gunn AJ, Wyatt JS, Whitelaw A, et al. Therapeutic hypothermia changes the prognostic value of clinical evaluation of neonatal encephalopathy. J Pediatr. 2008;152:55–58. 8 e1. doi: 10.1016/j.jpeds.2007.06.003. [DOI] [PubMed] [Google Scholar]
- 8.Shankaran S, Laptook AR, Tyson JE, et al. Evolution of encephalopathy during whole body hypothermia for neonatal hypoxic-ischemic encephalopathy. J Pediatr. 2012;160:567–572. e3. doi: 10.1016/j.jpeds.2011.09.018. [DOI] [PMC free article] [PubMed] [Google Scholar]
- 9.McKinstry RC, Miller JH, Snyder AZ, et al. A prospective, longitudinal diffusion tensor imaging study of brain injury in newborns. Neurology. 2002;59:824–833. doi: 10.1212/wnl.59.6.824. [DOI] [PubMed] [Google Scholar]
- 10.Barkovich AJ, Miller SP, Bartha A, et al. MR imaging, MR spectroscopy, and diffusion tensor imaging of sequential studies in neonates with encephalopathy. AJNR Am J Neuroradiol. 2006;27:533–547. [PMC free article] [PubMed] [Google Scholar]
- 11.Lasky RE, Parikh NA, Williams AL, Padhye NS, Shankaran S. Changes in the PQRST intervals and heart rate variability associated with rewarming in two newborns undergoing hypothermia therapy. Neonatology. 2009;96:93–95. doi: 10.1159/000205385. [DOI] [PMC free article] [PubMed] [Google Scholar]
- 12.Aliefendioglu D, Dogru T, Albayrak M, Dibekmisirlioglu E, Sanli C. Heart rate variability in neonates with hypoxic ischemic encephalopathy. Indian J Pediatr. 2012;79:1468–1472. doi: 10.1007/s12098-012-0703-2. [DOI] [PubMed] [Google Scholar]
- 13.Matic V, Cherian PJ, Widjaja D, et al. Heart rate variability in newborns with hypoxic brain injury. Adv Exp Med Biol. 2013;789:43–48. doi: 10.1007/978-1-4614-7411-1_7. [DOI] [PubMed] [Google Scholar]
- 14.Sarnat HB, Sarnat MS. Neonatal encephalopathy following fetal distress. A clinical and electroencephalographic study. Arch Neurol. 1976;33:696–705. doi: 10.1001/archneur.1976.00500100030012. [DOI] [PubMed] [Google Scholar]
- 15.Bayley N. Manual for the Bayley scales of infant development. New York: Psychological Corporation; 1969. [Google Scholar]
- 16.Bayley N. Bayley Scales of Infant Development - Third Edition. San Antonio, TX: Harcourt Assessment; 2006. [Google Scholar]
- 17.Govindan RB, Vairavan S, Ulusar UD, et al. A novel approach to track fetal movement using multi-sensor magnetocardiographic recordings. Ann Biomed Eng. 2011;39:964–972. doi: 10.1007/s10439-010-0231-z. [DOI] [PMC free article] [PubMed] [Google Scholar]
- 18.Ulusar UD, Govindan RB, Wilson JD, Lowery CL, Preissl H, Eswaran H. Adaptive rule based fetal QRS complex detection using hilbert transform. Conf Proc IEEE Eng Med Biol Soc. 2009;1:4666–4669. doi: 10.1109/IEMBS.2009.5334180. [DOI] [PMC free article] [PubMed] [Google Scholar]
- 19.Halliday DM, Rosenberg JR, Amjad AM, Breeze P, Conway BA, Farmer SF. A framework for the analysis of mixed time series/point process data--theory and application to the study of physiological tremor, single motor unit discharges and electromyograms. Prog Biophys Mol Biol. 1995;64:237–278. doi: 10.1016/s0079-6107(96)00009-0. [DOI] [PubMed] [Google Scholar]
- 20.Govindan RB, Massaro AN, Niforatos N, duPlessis A. Mitigating the effect of non-stationarity in spectral analysis- an application to neonate heart rate analysis. Computers in Biology and Medicine. 2013 doi: 10.1016/j.compbiomed.2013.09.019. in press. [DOI] [PMC free article] [PubMed] [Google Scholar]
- 21.Piccirillo G, Magri D, Ogawa M, et al. Autonomic nervous system activity measured directly and QT interval variability in normal and pacing-induced tachycardia heart failure dogs. J Am Coll Cardiol. 2009;54:840–850. doi: 10.1016/j.jacc.2009.06.008. [DOI] [PMC free article] [PubMed] [Google Scholar]
- 22.Piccirillo G, Ogawa M, Song J, et al. Power spectral analysis of heart rate variability and autonomic nervous system activity measured directly in healthy dogs and dogs with tachycardia-induced heart failure. Heart Rhythm. 2009;6:546–552. doi: 10.1016/j.hrthm.2009.01.006. [DOI] [PMC free article] [PubMed] [Google Scholar]
- 23.Shah AJ, Lampert R, Goldberg J, Veledar E, Bremner JD, Vaccarino V. Posttraumatic stress disorder and impaired autonomic modulation in male twins. Biol Psychiatry. 2013;73:1103–1110. doi: 10.1016/j.biopsych.2013.01.019. [DOI] [PMC free article] [PubMed] [Google Scholar]
- 24.Andriessen P, Oetomo SB, Peters C, Vermeulen B, Wijn PF, Blanco CE. Baroreceptor reflex sensitivity in human neonates: the effect of postmenstrual age. J Physiol. 2005;568:333–341. doi: 10.1113/jphysiol.2005.093641. [DOI] [PMC free article] [PubMed] [Google Scholar]
- 25.Johnston MV, Fatemi A, Wilson MA, Northington F. Treatment advances in neonatal neuroprotection and neurointensive care. Lancet Neurol. 2011;10:372–382. doi: 10.1016/S1474-4422(11)70016-3. [DOI] [PMC free article] [PubMed] [Google Scholar]
- 26.Hon EH. The electronic evaluation of the fetal heart rate; preliminary report. Am J Obstet Gynecol. 1958;75:1215–1230. doi: 10.1016/0002-9378(58)90707-5. [DOI] [PubMed] [Google Scholar]
- 27.Haji-Michael PG, Vincent JL, Degaute JP, van de Borne P. Power spectral analysis of cardiovascular variability in critically ill neurosurgical patients. Crit Care Med. 2000;28:2578–2583. doi: 10.1097/00003246-200007000-00066. [DOI] [PubMed] [Google Scholar]
- 28.Biswas AK, Scott WA, Sommerauer JF, Luckett PM. Heart rate variability after acute traumatic brain injury in children. Crit Care Med. 2000;28:3907–3912. doi: 10.1097/00003246-200012000-00030. [DOI] [PubMed] [Google Scholar]
- 29.Yiallourou SR, Witcombe NB, Sands SA, Walker AM, Horne RS. The development of autonomic cardiovascular control is altered by preterm birth. Early Hum Dev. 2013;89:145–152. doi: 10.1016/j.earlhumdev.2012.09.009. [DOI] [PubMed] [Google Scholar]
- 30.Golder V, Hepponstall M, Yiallourou SR, Odoi A, Horne RS. Autonomic cardiovascular control in hypotensive critically ill preterm infants is impaired during the first days of life. Early Hum Dev. 2013;89:419–423. doi: 10.1016/j.earlhumdev.2012.12.010. [DOI] [PubMed] [Google Scholar]
- 31.Fairchild KD, O'Shea TM. Heart rate characteristics: physiomarkers for detection of late-onset neonatal sepsis. Clin Perinatol. 2010;37:581–598. doi: 10.1016/j.clp.2010.06.002. [DOI] [PMC free article] [PubMed] [Google Scholar]
- 32.Stone ML, Tatum PM, Weitkamp JH, et al. Abnormal heart rate characteristics before clinical diagnosis of necrotizing enterocolitis. J Perinatol. 2013 doi: 10.1038/jp.2013.63. [DOI] [PMC free article] [PubMed] [Google Scholar]
- 33.Gang Y, Malik M. Heart rate variability in critical care medicine. Curr Opin Crit Care. 2002;8:371–375. doi: 10.1097/00075198-200210000-00002. [DOI] [PubMed] [Google Scholar]
- 34.Heart rate variability: standards of measurement, physiological interpretation and clinical use. Task Force of the European Society of Cardiology and the North American Society of Pacing and Electrophysiology. Circulation. 1996;93:1043–1065. [PubMed] [Google Scholar]
- 35.Akselrod S, Gordon D, Ubel FA, Shannon DC, Berger AC, Cohen RJ. Power spectrum analysis of heart rate fluctuation: a quantitative probe of beat-to-beat cardiovascular control. Science. 1981;213:220–222. doi: 10.1126/science.6166045. [DOI] [PubMed] [Google Scholar]
- 36.Billman GE. The LF/HF ratio does not accurately measure cardiac sympatho-vagal balance. Front Physiol. 2013;4:26. doi: 10.3389/fphys.2013.00026. [DOI] [PMC free article] [PubMed] [Google Scholar]
- 37.Assaf N, Weller B, Deutsh-Castel T, Cohen A, Tirosh E. The relationship between heart rate variability and epileptiform activity among children--a controlled study. J Clin Neurophysiol. 2008;25:317–320. doi: 10.1097/WNP.0b013e318182ed2d. [DOI] [PubMed] [Google Scholar]
- 38.Malarvili MB, Mesbah M. Combining newborn EEG and HRV information for automatic seizure detection. Conf Proc IEEE Eng Med Biol Soc. 2008;2008:4756–4759. doi: 10.1109/IEMBS.2008.4650276. [DOI] [PubMed] [Google Scholar]
- 39.Malarvili MB, Mesbah M. Newborn seizure detection based on heart rate variability. IEEE Trans Biomed Eng. 2009;56:2594–2603. doi: 10.1109/TBME.2009.2026908. [DOI] [PubMed] [Google Scholar]