Abstract
Shear wave speed can be used to assess tissue elasticity, which is associated with tissue health. Ultrasound shear wave elastography techniques based on measuring the propagation speed of the shear waves induced by acoustic radiation force are becoming promising alternatives to biopsy in liver fibrosis staging. However, shear waves generated by such methods are typically very weak. Therefore, the penetration may become problematic, especially for overweight or obese patients. In this study, we developed a new method called External Vibration Multi-directional Ultrasound Shearwave Elastography (EVMUSE), in which external vibration from a loudspeaker was used to generate a multi-directional shear wave field. A directional filter was then applied to separate the complex shear wave field into several shear wave fields propagating in different directions. A two-dimensional (2D) shear wave speed map was reconstructed from each individual shear wave field, and a final 2D shear wave speed map was constructed by compounding these individual wave speed maps. The method was validated using two homogeneous phantoms and one multi-purpose tissue-mimicking phantom. Ten patients undergoing liver Magnetic Resonance Elastography (MRE) were also studied with EVMUSE to compare results between the two methods. Phantom results showed EVMUSE was able to quantify tissue elasticity accurately with good penetration. In vivo EVMUSE results were well correlated with MRE results, indicating the promise of using EVMUSE for liver fibrosis staging.
Index Terms: Directional filter, external vibration, liver fibrosis, magnetic resonance elastography, shear wave elastography, shear wave speed
I. INTRODUCTION
Liver fibrosis and cirrhosis are the result of chronic liver injury, and affect hundreds of millions of patients worldwide [1]. Staging of liver fibrosis is crucial for treatment decision making and follow-up. Liver biopsy is currently considered as the gold standard for liver fibrosis staging and diagnosis [2]. However, it is an invasive procedure, and is also subject to sampling error and interpretation variability [3].
The state of tissue health is found to be associated with tissue elasticity, which can be noninvasively and quantitatively estimated by inducing shear waves into the tissue and measuring shear wave propagation speed, cs, in the tissue [4]. Many techniques based on cs measurement or on the direct estimation of material properties from shear wave propagation have been applied for noninvasive liver fibrosis staging. In particular, Magnetic Resonance Elastography (MRE) has outstanding performance for liver fibrosis staging [5, 6]. It can quantify tissue elasticity over a relatively large area of the liver, and therefore does not suffer from sampling or interpretation variability as does liver biopsy. However, MRE is not widely available and the associated cost is relatively high, thus its clinical use is limited to a few large medical centers.
Techniques such as Acoustic Radiation Force Impulse (ARFI) shear wave imaging [7, 8] and supersonic shear imaging (SSI) [9, 10] use acoustic radiation force (ARF) to produce shear waves and are capable of providing a two-dimensional (2D) quantitative elasticity imaging of in vivo liver tissue. However, the shear waves generated by ARF are typically very weak (motion amplitudes on the order of micrometers), limiting the penetration of these methods, which may become problematic in overweight or obese patients. In a recent study, SSI failed to obtain reliable measurements in 15% of the subjects [11]. The Body Mass Index (BMI) of subjects in the successful group and failed group was 22.3 ± 3.7 and 29.7 ± 3.3, respectively. In another study of 321 patients, ARFI shear wave imaging failed in 49% of patients with BMI greater than 30 [12]. The prevalence of adult obesity (defined by BMI ≥ 30) in the United States is over one third of the population and keeps increasing [13]. It is estimated that by 2025, there will be about 25 million nonalcoholic steatohepatitis (NASH) patients in America, who are commonly obese and in need of fibrosis staging [14]. Therefore, shear wave penetration is becoming a non-trivial limitation for these ARF-based methods.
External mechanical vibration can produce shear waves with higher amplitude for more reliable shear wave speed estimates in deeper tissues. Fibroscan (or transient elastography) uses a piston-like vibrator to generate a transient longitudinally polarized shear wave on the axis of the vibrator inside the liver, and measures the liver elasticity based on the shear wave propagation speed [15]. It has been widely applied for studying liver fibrosis [16, 17]. Recently Tzschatzsch et al. proposed a method called time-harmonic elastography (THE) to study liver elasticity and viscosity using continuous vibrations at a range of frequencies [18]. However, both methods provide only one-dimensional localized elasticity information and lack imaging guidance for its measurements.
Multiple vibrations using one or more vibration sources can fill the field of view (FOV) with propagating shear waves from which a 2D elasticity image could be calculated [19, 20]. Shear waves generated by such methods often have complicated patterns with unknown propagation directions due to reflection, diffraction and other phenomena, making it difficult for conventional time-of-flight methods [7, 21] to measure cs. A 2D cs estimator has been proposed to improve the accuracy of cs estimation in sonoelastographic shear velocity imaging [20, 22]. Such a method requires consistent shear wave propagation direction, which is often difficult to obtain in in vivo applications. A time reversal approach also has been proposed for elasticity imaging based on correlations of a diffuse wave field [23], which is, however, also difficult to obtain in vivo.
In this study, we propose a new method called External Vibration Multi-direction Ultrasound Shearwave Elastography (EVMUSE) to assess liver fibrosis. EVMUSE uses the external mechanical vibration from a loudspeaker to create a multi-directional shear wave field. Such a wave field does not have to be diffuse, and there is no restriction on the direction, location, and occurrence of the shear waves propagating in the image plane. EVMUSE uses directional filtering to separate shear waves moving in different directions. For each direction, a 2D cs map is calculated based on the local 2D shear wave speed estimation method. The final cs map is constructed by compounding the cs maps calculated from all the directions. EVMUSE was validated using two tissue-mimicking homogeneous phantoms and one multi-purpose phantom. Ten patients undergoing liver MRE were also studied with the EVMUSE method and the results were compared between the two methods.
II. METHOD
A. Experimental Setup
As illustrated in Fig. 1, a single loudspeaker (Pioneer SW-8, Pioneer Electronics Inc., Japan) was embedded as a part of the examination bed, with the diaphragm exposed and facing upward. This setup is similar to that used in the time-harmonic elastography study reported by Tzschatzsch, et al. [24]. During the experiment, the subject was laid supine with the back (lower rib cage) coupled with the loudspeaker and right arm abducted, giving the transducer access to the available intercostal acoustic windows.
Fig. 1.
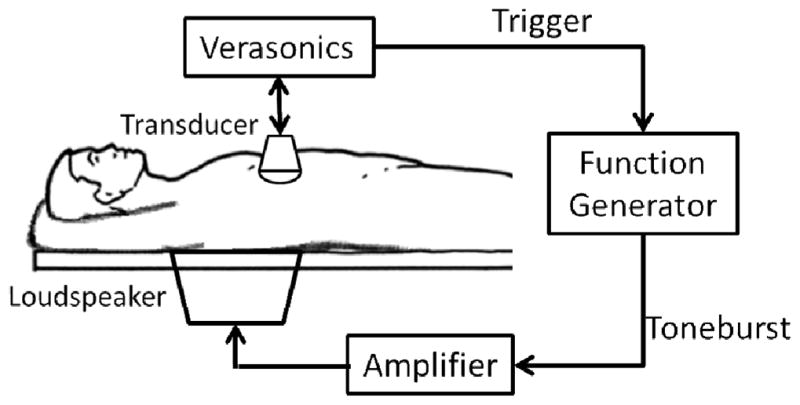
Illustration of the experimental setup. The embedded loudspeaker is driven by an amplifier controlled by a function generator. The Verasonics ultrasound system sends out a trigger signal to activate the vibration, and then acquires the B-mode image and records the motion.
A Verasonics ultrasound system with a C5-2v curved array transducer (Verasonics Inc., Redmond, WA) was programmed to have both B-mode imaging and shear wave motion detection capabilities. Under the guidance of the B-mode imaging, the transducer can be adjusted to locate the region of interest (ROI). By hitting a button, the system immediately sends a trigger signal to a function generator (Agilent 33250A, Agilent Technologies, Inc., Santa Clara, CA) to activate the loudspeaker after the signal is amplified (Crown XLS202, Crown Audio, Inc., Elkhart, IN), and then quickly switches to the high frame rate imaging mode [25] for shear wave motion detection. Once triggered, the function generator sends out a 50 Hz tone burst with a duration of 100 ms and an amplitude of 1.2 V to the speaker via the amplifier (voltage gain: 30 dB). The frequency and duration were selected such that the speaker had a high amplitude response while being capable of delivering sufficient shear wave motion into the liver.
Because the transducer was in rigid contact with the subject (between the ribs), transducer motion induced by speaker vibration can introduce artifacts in the shear wave motion tracking. Therefore, in this study the high frame rate motion detection did not start until 10 ms after the termination of the vibration, at which time the propagating shear waves were still present in the ROI while the transducer motion was negligible. The motion detection lasted for 200 ms with 0.5 mm spatial resolution and 3-angle (−2°, 0°, and 2°) spatial compounding [25] at a frame rate of 1 kHz.
B. Directional Filter
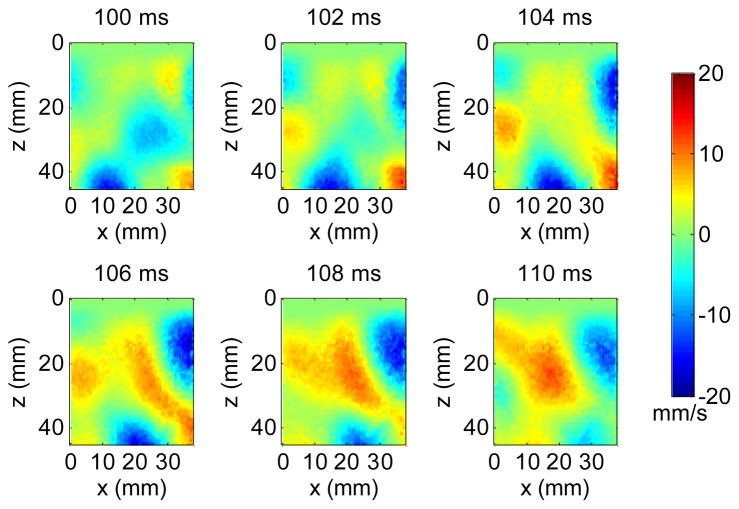
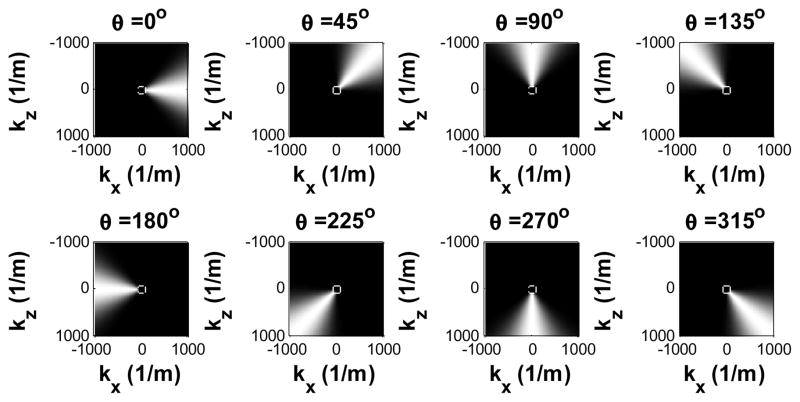
Shear wave particle velocity in the axial (z) direction was calculated from the recorded in-phase/quadrature (IQ) signals based on 2D autocorrelation [26]. Fig. 2 shows snapshots from a movie of a typical multi-directional shear wave field in a phantom generated by the loudspeaker. Because the vibration is transmitted from the loudspeaker to the phantom through a large coupling area, multiple shear waves may occur at different locations and propagate in different directions at any given time. Therefore, they have to be separated in order for conventional time-of-flight shear wave speed estimation [7, 21] to work. To isolate the shear waves propagating in different directions, the spatiotemporal (x, z, t) motion signals were first converted to the spatiotemporal-frequency (kx, kz, ft) domain, or k-f domain, using a three-dimensional (3D) Fourier transform. Tukey windows were applied to the spatiotemporal signals to create a smooth transition from the FOV to surrounding zeros, minimizing the edge effects due to the Fourier transform. Directional filters were then applied by multiplying the directional filter response with the signals in the k-f domain [27]. Fig. 3 shows the directional filter response in 8 directions. For each direction, shear waves propagating within an angular range near the primary direction can pass through whereas shear waves moving in other directions were suppressed.
Fig. 2.
Snapshots from a movie of a shear wave field generated by the loudspeaker in a phantom. The number above each snapshot indicates the elapsed time since the data acquisition started.
Fig. 3.
Eight directional filters from 0° to 315° separated by 45° steps. The cutoff region at the center indicates the speed limit of 5m/s evaluated at ft = 400 Hz.
Both compressional waves [28] and out-of-plane shear waves (for geometric reasons; see [29]) appear as high speed waves which are present as low spatial frequency components in the k-f domain. Given an upper speed limit ch at a temporal frequency ft, a spatial frequency limit kl = ft/ch can be imposed upon the directional filter to suppress waves with propagation speeds higher than ch, by removing spatial frequency components lower than kl as indicated by the regions inside the white circle at the center of the directional filter response in Fig. 3. According to the relation between kl and ft, the radius of the removed region increases with the temporal frequency ft. A 6th-order Butterworth high-pass filter was designed to apply smooth transitions for kl to avoid Gibbs ringing effects. According to a review of 1,377 patients with liver diseases studied by MRE, the highest measured cs was 4.3 m/s for cirrhotic liver [30]. Therefore, a speed limit of 5 m/s was applied in this study, and Fig. 3 shows the corresponding directional filter response at ft = 400 Hz.
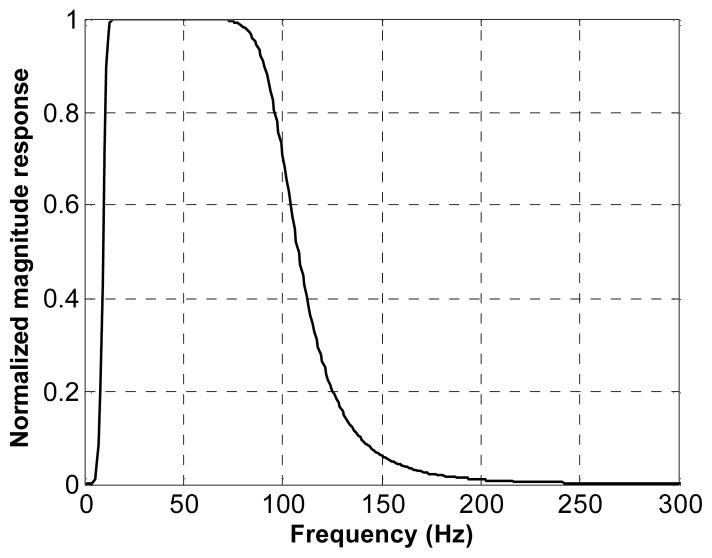
Besides the spatial high-pass filtering, another 6th-order Butterworth band-pass filter was applied in the temporal frequency direction to remove low frequency drift and high frequency noise, as shown in Fig. 4. Given the vibration frequency of 50 Hz, the cut-off frequencies of the filter were set at 10 Hz and 100 Hz, respectively.
Fig. 4.
Normalized magnitude response of the temporal band-pass filter. The cut-off frequencies are 10 Hz and 100 Hz, respectively.
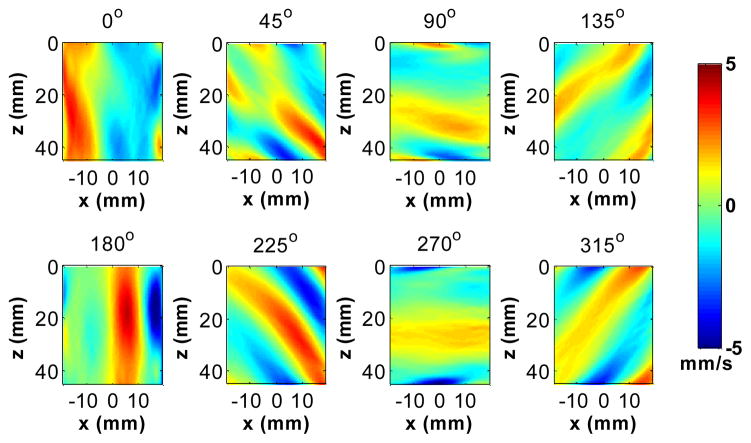
After the directional filtering, the resulting shear wave signals in different directions were converted back to the spatiotemporal domain using an inverse 3D Fourier transform. Fig. 5 shows snapshots at 106 ms (after the data acquisition started) of the shear wave movie after applying the 8 directional filters and the high-pass spatial frequency filter (Fig. 3) and the temporal filter (Fig. 4) to the multi-direction wave field (Fig. 2).
Fig. 5.
A snapshot from a movie of the shear waves after applying the directional filters in Fig. 3 to the shear wave field shown in Fig. 2 (at 106 ms after the data acquisition started).
C. 2D Shear Wave Speed Estimation
After directional filtering, shear waves propagating in different directions were separately processed using a 2D shear wave speed estimation method. Data filtered by each directional filter mainly contain waves propagating in that direction, which can be at an oblique angle to the lateral and axial coordinates (x, z) of the ultrasound detection data grid. Similar to the method introduced in [20, 22], cross-correlation was applied to calculate the time delays between the temporal signal at one pixel and the signals from two other pixels a certain distance away in the x and z directions, respectively. As illustrated in Fig. 6, consider a plane shear wave (indicated by the long dashed lines) moving at a constant speed of cs with an angle of θ with respect to the x axis. The time delays are measured between the origin o and two locations x and z, both with a distance of r from o. There is a tradeoff for the selection of r, since a shorter distance would result in higher resolution and lower signal decorrelation, but also a larger percentage error for time delay estimation [31]. In this study, r was empirically set at 4 mm (8 pixels). The time for the shear wave to travel from o to x is Δtx, and the time for the shear wave to propagate from o to z is Δtz. Based on geometry, it follows that rcosθ = cs · Δtx and rsinθ = cs · Δtz. Therefore . To improve the estimation accuracy, the temporal signals were upsampled 10 times and parabolic interpolation was applied to locate the sub-pixel correlation peaks [32, 33]. Normalized correlation coefficients (CC) [34] were also calculated in both the x and z directions to control the quality of cs estimation. Because there were two CCs for each pixel from shear wave estimation along x and z directions, respectively, the lower value of the two was selected to represent the CC for that pixel to be conservative.
Fig. 6.
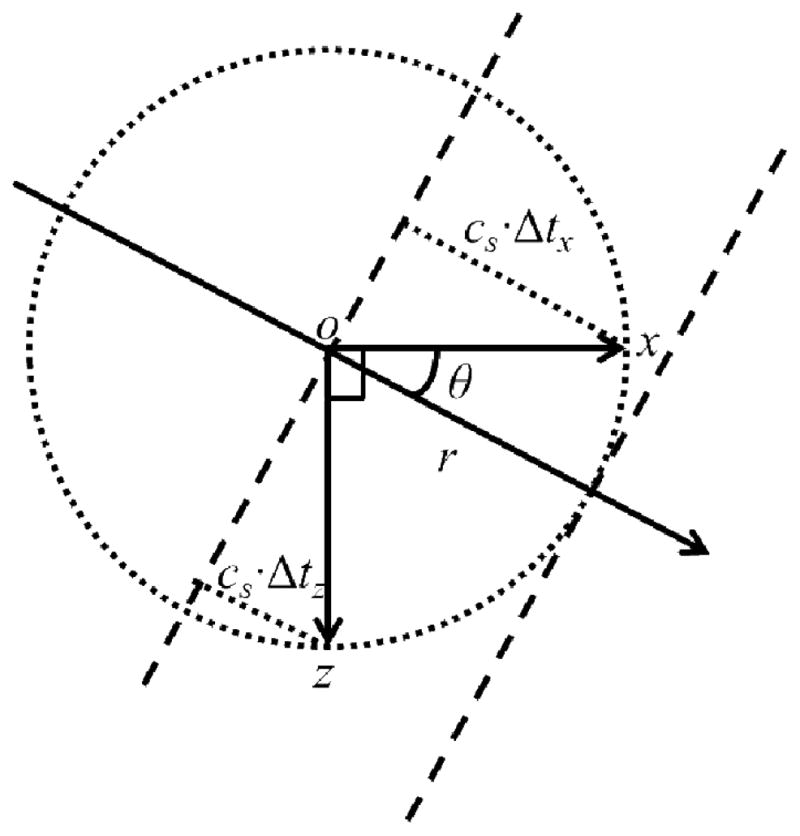
Illustration of the principle of the 2D cs estimation.
To further improve the robustness of the measurement, the value of cs at one pixel (c̄s) was determined by averaging with estimates from the surrounding pixels. Both inverse distance weighting (IDW) [35] and correlation coefficient weighting (CCW) were applied to calculate the average speed as described in Eq. (1) [22]:
| (1) |
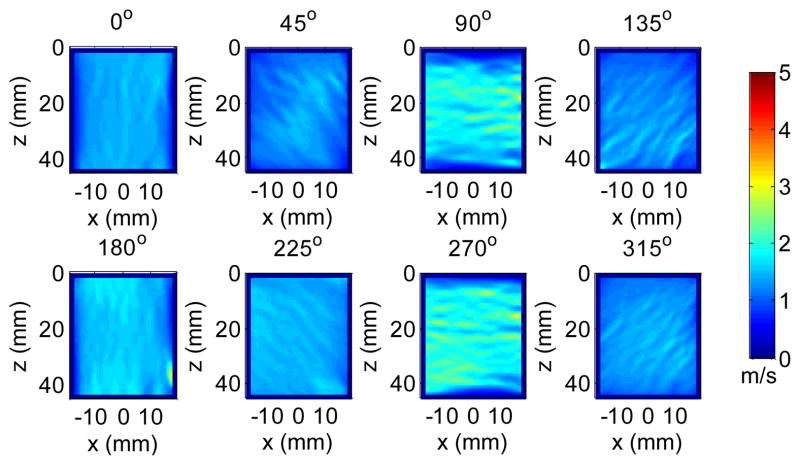
where cs(x, z) is the speed measured at a location with a CC of cc(x, z) and a distance of r(x, z) (unit: pixel) away from the center pixel (0, 0). N determines the range of the pixels involved in the averaging (also the spatial resolution of the cs image), which were each 4 pixels away from the center pixel in the x and z directions in this study, resulting an image resolution of 4 mm (8 pixels) in x and z. The above process was applied to each imaging pixel of Fig. 5 to form a 2D cs image in each direction as shown in Fig. 7.
Fig. 7.
Estimated cs in eight directions from the shear waves in Fig. 5 using 2D cross-correlation and spatial averaging. The mean and standard deviation for each direction was 1.46 ± 0.05, 1.40 ± 0.10, 1.89 ± 0.21, 1.32 ± 0.09, 1.61 ±0.05, 1.48 ± 0.03, 1.94 ± 0.16, 1.44 ± 0.06 m/s for angles 0–315°, respectively.
D. Shear Wave Speed Image Compounding
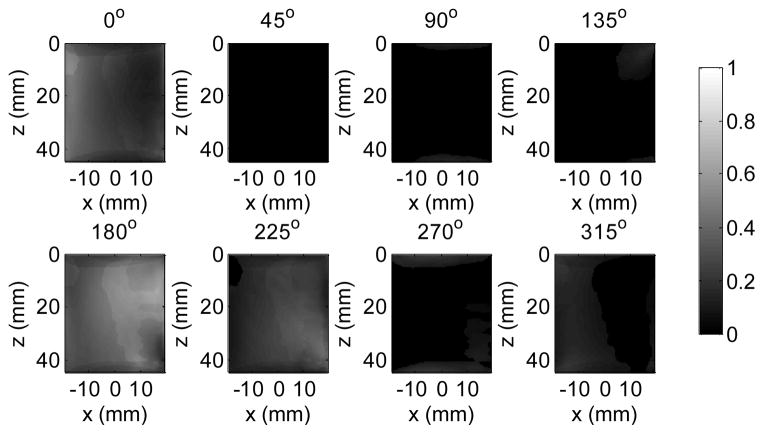
After the 2D cs maps from each of the directions are calculated, they can be compounded into a final image by averaging the measured cs in each direction. In some cases, especially for in vivo measurement, the shear wave field may mostly propagate in one or two directions instead of in many directions. The cs results should be more reliable in directions where there are strong shear waves. Therefore, in this study the final cs value at each pixel was calculated as a weighted average of the cs results in different directions, using the shear wave energy for that direction as the weight. The shear wave energy at each pixel in each direction was calculated by summation of the corresponding squared temporal signal, and normalized by the aggregation of the shear wave energy over different directions, such that the weights in different directions from each pixel always add up to 1 [22] as shown in Fig. 8. The cs images from Fig. 7 can be compounded into a final image as shown in Fig. 9, using the energy weights from Fig. 8.
Fig. 8.
Energy weight calculated from the shear wave signals in each direction in Fig. 5 after directional filtering. For each pixel, the sum of the weights from eight directions is always one.
Fig. 9.
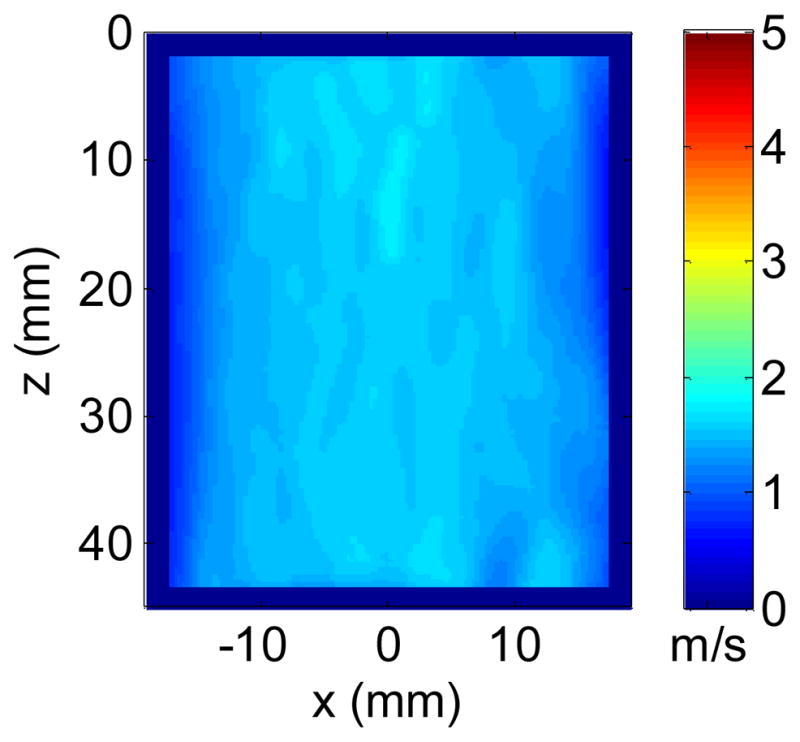
Final cs image using energy weighted compounding from Fig. 7. The mean and standard deviation of the final image was 1.59 ± 0.05 m/s.
E. Phantom Study
Two homogeneous elasticity phantoms (Phantoms 1 and 2; CIRS Inc., Norfolk, VA) calibrated with SSI using the Aixplorer scanner (SuperSonic Imagine, Aix-en-Provence, France) were studied using EVMUSE. Each phantom was placed on the examination bed with the bottom coupled with the loudspeaker. The C5-2v transducer was held by hand perpendicularly to the surface of the phantom with minimum pressure. Five EVMUSE measurements were taken for each phantom at 5 random locations on the phantom. For each measurement, a 2D cs image was constructed and a mean value was calculated from all the pixels of the image. For comparison, five SSI images were acquired at 5 random locations on the phantom using a curved array transducer SC6-1 and the Aixplorer [36]. The SSI images were analyzed offline, and a mean Young’s modulus (E) was measured from a round ROI with 2 cm diameter centered at 3 cm depth in each of the SSI images, from which a mean cs value was calculated based on [36], where ρ is the mass density of the medium (assumed to be 1000 kg/m3) and μ is the shear modulus.
To demonstrate the penetration of the proposed method, a multi-purpose phantom (Model 040GSE; CIRS Inc., Norfolk, VA) was studied using EVMUSE. The maximum depth of the measured phantom section was 16 cm with attenuation coefficient of 0.7 dB/cm/MHz. One EVMUSE measurement was taken with an ROI reaching the depth of 14 cm using the C5-2v transducer. For comparison, one SSI measurement was taken using the Aixplorer and SC6-1 with an ROI centered at 6.5 cm depth, where measurements failed at the bottom half of the ROI due to the penetration limitations. Five more SSI measurements were taken using the Aixplorer and the SC6-1 with the ROI centered at 3 cm depth where elasticity of the phantom was reliably measured, and the results were used as validation for EVMUSE measurement at deeper depth.
F. In Vivo Liver Study
Ten patients (8 women and 2 men; age range: 30–77 years; BMI: 19.4–34.0) undergoing clinically indicated liver MRE exams participated in the study. Among the 10 patients, 4 patients had primary sclerosing cholangitis, 3 patients had chronic hepatitis C, and one patient each had chronic hepatitis B, NASH, and hemochromatosis. Five patients were overweight with BMI between 25 and 30, and two patients were obese with BMI over 30. The study was approved by the institutional review board (IRB) of the Mayo Clinic and written consent was obtained from each subject.
During the experiment, the subject was laid supine on the examination bed with the back coupled with the loudspeaker and right arm abducted. For each measurement, a sonographer (26 years of experience) positioned the transducer using B-mode imaging to locate a relatively large liver region free of major vessels through intercostal spaces. Then the subject was instructed to suspend breathing while the operator pressed the button to activate the loudspeaker followed by shear wave motion detection and data recording. For each subject, 15 measurements were obtained through 3 intercostal spaces (between ribs 9 and 10, 8 and 9, 7 and 8) with 5 repetitions for each intercostal space.
Nine subjects underwent MRE on the same day of their EVMUSE study. One subject had the MRE exam one day before the EVMUSE study. The MRE exams were performed using a 1.5T MRI scanner (GE Healthcare, Milwaukee, WI), with a pneumatic driver attached to the subject’s abdomen to provide a harmonic mechanical vibration at 60 Hz. Standard MRE exam acquired images of wave propagation in the liver were analyzed by physicians following the standardized clinical routine [37].
III. RESULTS
A. Phantom Study
Fig. 10 shows representative 2D cs images measured from the two homogeneous phantoms superimposed over their B-mode images. The edges of the cs images were 1 cm away from the edges of the FOV to avoid possible edge effects due to the Fourier transform in the directional filters. For each measurement, a mean value was calculated from the entire cs image. The measured cs averaged over 5 measurements were 1.18 ± 0.04 m/s and 2.08 ± 0.05 m/s for Phantom 1 and 2, respectively, compared to 1.18 ± 0.01 m/s and 2.04 ± 0.01 m/s, respectively using SSI. The penetration of EVMUSE in both phantoms was over 7 cm.
Fig. 10.
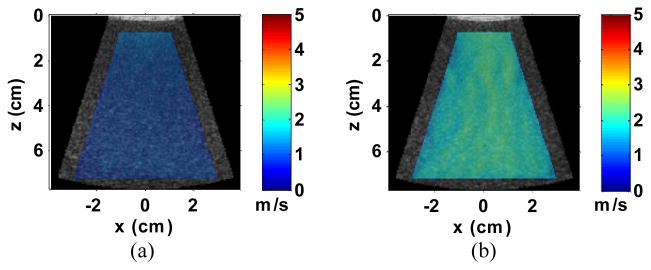
Representative cs images of Phantoms 1 (a) and 2 (b) superimposed over their corresponding B-mode images.
Fig. 11(a) shows the 2D cs image measured from the multi-purpose phantom using EVMUSE. The image was superimposed over a B-mode image in order to compare with the SSI image shown in Fig. 11(b). The ROI of the EVMUSE image was centered at 12.5 cm depth (11–14 cm) with measured cs averaged over the ROI of 2.60 ± 0.15 m/s. The ROI of the SSI image was centered at 6.5 cm depth. No elasticity result could be acquired from the lower part of the ROI due to the attenuation. For the other five SSI measurements at 3 cm depth, the cs averaged over different measurements was 2.60 ± 0.01 m/s, which was comparable to the single EVMUSE measurement result. Note that the standard deviation for EVMUSE was calculated from the cs at different pixels within the ROI, whereas the standard deviation for SSI was from the mean cs of different measurements.
Fig. 11.
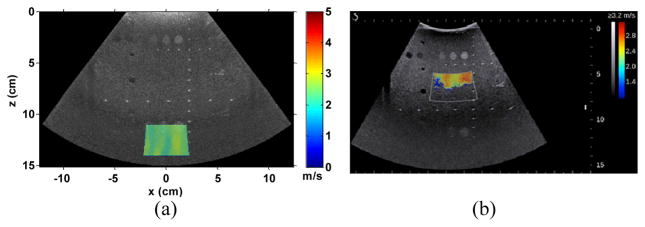
(a) 2D cs image of the multi-purpose phantom superimposed over its B-mode image. The ROI of the image was centered at 12.5 cm with measured average cs over the ROI of 2.60 ± 0.15 m/s; (b) SSI image of the same phantom with ROI centered at 6.5 cm depth.
B. In Vivo Liver Study
EVMUSE data from the 10 patients were processed using the proposed method. For each measurement, a 2D cs image was calculated. Fig. 12(a) shows a representative cs image superimposed over the B-mode image from one measurement of one patient (BMI: 26.4). The EVMUSE ROI of in vivo liver reached around 7 cm. A mean value was computed over a trapezoidal ROI, the edges of which were 1 cm away from the liver capsule, the left, right, and bottom edges of the FOV, respectively. The ROI was set to cover a large area of the liver, while also avoiding possible edge effects.
Fig. 12.
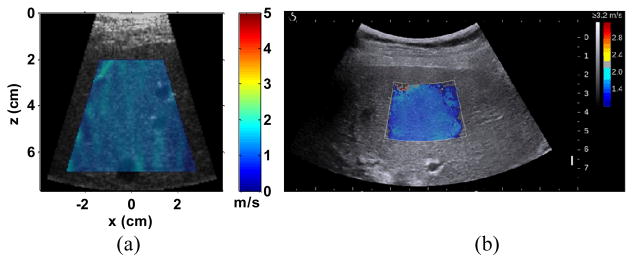
(a) Representative cs image of the in vivo liver superimposed over its corresponding B-mode images from one patient (patient No. 6). The measured cs within the colored region of the image was 1.48 ± 0.07 m/s. (b) Representative SSI image of the same patient. The measured cs based on the offline analysis described in the phantom study was 1.46 m/s. The mean shear modulus of the patient measured by MRE was 2.3 kPa which corresponds to a cs of 1.52 m/s.
Among the 10 patients, 5 patients were also examined by SSI on the same day of the EVMUSE study following similar protocol (15 measurements through 3 different intercostal spaces). A representative SSI image of the same patient is shown in Fig. 12(b).
Fig. 13 shows representative measurement results from a patient with obesity (BMI: 32.3) using EVMUSE and SSI. For EVMUSE, relatively uniform cs image was obtained, whereas SSI failed to give uniform measurement within the ROI.
Fig. 13.
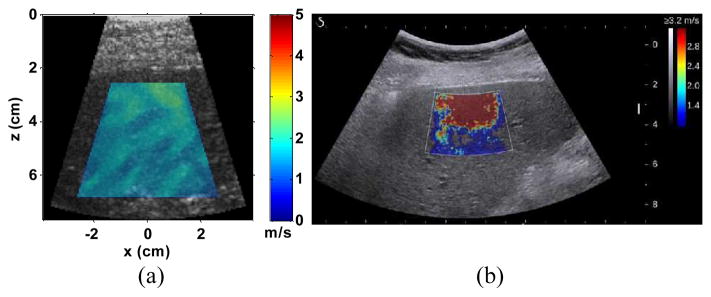
(a) Representative cs image of the in vivo liver superimposed over its corresponding B-mode images from one obese patient (patient No. 8). The measured cs within the colored region of the image was 1.80 ± 0.22 m/s; (b) Representative SSI image of the liver from the same patient using the Aixplorer, which failed to give a reliable elasticity map. The mean shear modulus of the patient measured by MRE was 3.9 kPa, which corresponds to a cs of 1.97 m/s.
For each patient, a median value was calculated from the 15 mean values from the EVMUSE measurements as that patient’s result. The interquartile ratio, defined as the ratio between the interquartile range (from the first quartile to the third quartile) and the median value, was also calculated to evaluate the reliability of the results [12, 38]. The interquartile ratios for the EVMUSE results are listed in Table 1. All of the ratios using EVMUSE were below the 30% boundary, within which the results are regarded as reliable [38]. The ratios of the SSI measurements from the 5 patients are also listed in Table 1. The interquartile ratios of the EVMUSE and SSI measurements for the patient shown in Fig. 12 were 10.1% and 10.8%, respectively, whereas the ratios for the patient shown in Fig. 13 were 15.6% and 74.4%, respectively. Data in Table I suggest that EVMUSE may be able to give more consistent results within each patient.
TABLE I.
INTERQUARTILE RATIOS OF EVMUSE AND SSI RESULTS
| Patient No. | BMI | EVMUSE Ratio (%) | SSI Ratio (%) |
|---|---|---|---|
| 1 | 26.9 | 8.0 | |
| 2 | 28.4 | 22.8 | |
| 3 | 27.4 | 9.8 | |
| 4 | 34.0 | 17.1 | |
| 5 | 22.7 | 8.0 | 5.0 |
| 6 | 26.4 | 10.1 | 10.8 |
| 7 | 19.4 | 13.5 | |
| 8 | 32.3 | 15.6 | 74.4 |
| 9 | 24.2 | 19.8 | 69.0 |
| 10 | 23.5 | 9.1 | 84.1 |
To compare with MRE results, cs results of EVMUSE were converted to shear modulus μ based on [4], where ρ is the mass density of the medium (assumed to be 1000 kg/m3). EVMUSE results from the 10 patients were plotted against MRE results as shown in Fig. 14. The Pearson product-moment correlation coefficient between the MRE and ultrasound results was 0.86 (95% confidence interval: 0.71–0.98) with p < 0.001, indicating the correlation was significant.
Fig. 14.
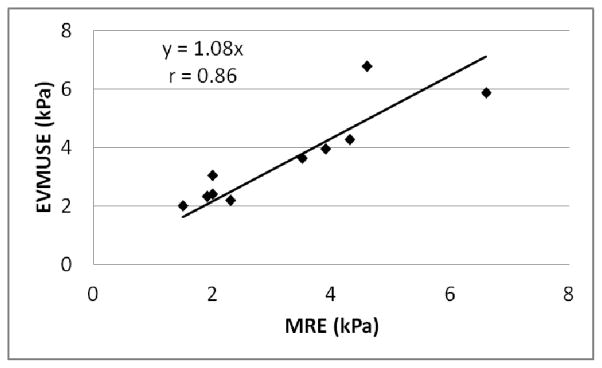
EVMUSE results from the 10 patients plotted against the MRE results. The Pearson product-moment correlation coefficient r was 0.86 with p < 0.001, indicating the correlation was significant.
IV. DISCUSSION
In this study, we developed a new method called EVMUSE to assess liver fibrosis. A loudspeaker was used to generate a multi-directional shear wave field inside the liver. Directional filtering and a 2D shear velocity estimator were used to construct 2D cs images of the liver from which the elasticity of the liver was calculated. Phantom and in vivo liver studies showed EVMUSE had sufficient penetration, accurate elasticity measurement, and good correlation with liver elasticity results measured by MRE.
A single loudspeaker was used as the vibration source in this study. As the transcostal vibration was delivered into the liver, the ribs functioned as multiple shear wave sources according to the Huygens principle [39], generating multi-directional shear waves which can fill up the FOV and enable cs measurement everywhere. Such a configuration requires minimum setup effort, and also leaves the subject’s lateral intercostal gaps open for the transducer to access. However, the portability of the setup may be an issue, because a specially designed bed is required. Multiple electromagnetic or pneumatic actuators could also be used to generate a multi-directional shear wave field [40]. Such configurations may be more portable and flexible for multi-directional shear wave production. However, it would take more effort to attach the actuators to the body and to minimize their interference with the ultrasound transducer.
To minimize the transducer vibration, shear wave motion detection was conducted after the vibration stopped. Such an approach is not the most efficient, as the larger motion during the vibration is not used to estimate cs. Also, when the external vibration stopped, the remaining vibration of the tissue may follow its own resonant frequency. Therefore, it was difficult to compare cs at the same shear wave frequency among all the patients. Future study will be conducted to mitigate the effect of transducer motion so that shear wave motion detection could be done during the vibration.
The frequency of the shear waves produced by mechanical vibration is generally lower than those generated by ultrasound radiation force, resulting in larger spatial wavelength of the shear waves and consequently lower spatial resolution of the cs images. Since liver fibrosis is generally a diffuse disease, the impact of lower image resolution for liver fibrosis staging is limited.
In this study, directional filters in eight directions were designed to adequately cover all directions of the shear wave field. In principle more directions might improve the quality of the cs images, because the filters would align better with the shear waves. However, more directions would require more computation. Therefore, the number of the directions is a tradeoff between the cs image quality and the computational load. Future investigation would be needed to evaluate the relationship between directional filter design and image quality.
Shear wave energy was used to weight cs values in different directions when compounding them into a final image. If the shear waves are diffuse, then the cs measured in each direction contribute to the final compounded image. If the shear waves are not diffuse, such an image compounding method emphasizes the estimation results from the direction(s) where the shear waves are strongest. This may not be optimal for imaging inclusions, because without multi-directional shear compounding [22, 36], the resulting cs image may not have good delineation of the inclusions. Therefore, such an approach may work better for homogeneous media such as liver.
The out-of-plane and compressional waves were suppressed by setting a speed limit in the directional filter, which is possible for most clinical applications, as the physiological range of shear wave speed values is usually known. However, the remaining out-of-plane waves can still introduce an overestimation bias to the cs measurement. The choice of speed limit is likely application dependent and this is a limitation of the method. Adopting multiple vibration sources and arranging them in the image plane of the transducer may minimize the out-of-plane waves. 3D ultrasound imaging [41] may help mitigate the bias caused by out-of-plane waves. More studies are needed to effectively suppress the generation of or contribution from out-of-plane waves.
In this study, both MRE and EVMUSE calculated shear modulus μ from the cs based on , where viscosity was ignored. However, liver tissue is viscoelastic [42], and the measured cs should increase with shear wave frequency because of the dispersion effect [43]. Compared to the 60 Hz shear wave frequency in MRE, the center frequency of the shear waves after 50 Hz vibration in EVMUSE is probably lower, which should result in a lower measured μ than MRE. However, the EVMUSE results are probably biased high by the remaining out-of-plane waves, which we believe is the reason for a slope slightly greater than 1.0 in Fig. 12. MRE can either minimize the out-of-plane waves by selecting the optimal image plane in the 3D space [44], or correctly process 3D waves by acquiring true 3D data. Nevertheless, the good correlation still indicates EVMUSE has promising performance in fibrosis staging, despite the differences of the absolute values between EVMUSE and MRE results.
The MRE results of the ten patients participating in the study ranged from 1.5 kPa to 6.6 kPa. The clinical cut-points for MRE routinely used at our institute to classify normal and cirrhotic livers are shear modulus μMRE < 2.5 kPa and μMRE > 5.0 kPa, respectively. Therefore, the ten patients involved in this study should cover such range. According to a review of 1,377 patients with liver diseases studied by MRE, the shear moduli measured in the liver ranged from 1.1 kPa to 18.8 kPa [30]. Therefore, more patients will be needed to fully evaluate the performance of EVMUSE in liver fibrosis staging.
Among the ten patients, one patient had a relatively low BMI of 22.7 and an abnormal back curvature, such that the coupling between the back and the loudspeaker was not ideal. Also the patient had difficulty keeping still during the EVMUSE experiment. The corresponding result of this patient appears to be an outlier in Fig. 12 (the data point with highest EVMUSE value), without which the correlation coefficient r would be 0.98 (95% confidence interval: 0.95–1.00).
The penetration advantage of EVMUSE over radiation force methods was demonstrated by the multi-purpose phantom study. To further investigate the penetration capability of EVMUSE, we measured a volunteer without any history of liver disease who had a BMI of 40 using EVMUSE and SSI. The representative cs image of EVMUSE and SSI elasticity image are shown in Figs. 15(a) and (b), respectively. The ROIs of both EVMUSE and SSI images were centered at 9.5 cm depth (8–11 cm). EVMUSE was still able to measure the cs at over 11 cm depth, whereas SSI failed to make such measurements. The measured cs by EVMUSE in the colored region of Fig. 15(a) was 1.38 ± 0.19 m/s. We do not have MRE results in the subject. The cs of 1.38 m/s corresponds to a shear modulus of 1.9 kPa, which is within the range of normal liver stiffness [6].
Fig. 15.
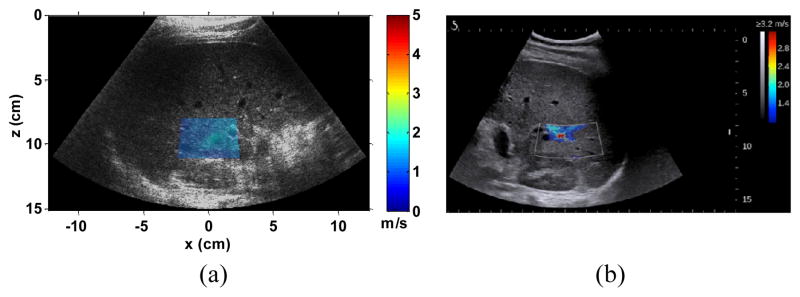
(a) Representative cs image of the in vivo liver superimposed over its corresponding B-mode images from one subject with a BMI of 40 and without any history of liver disease. The ROI was centered at 9.5 cm with measured cs within the ROI of 1.38 ± 0.19 m/s. (b) Representative SSI image of the same subject with the ROI centered at 9.5 cm, where it failed to make the measurement.
In this study, the motion was monitored for 200 ms. The CC values should increase with the motion detection time duration, because more shear wave events can be recorded, making cross-correlation results more reliable. However, a longer recording time would not work for measuring rapid stiffness change, for example in contracting muscles. Multiple vibration sources may be advantageous over a single source for such applications, because they could simultaneously generate as many shear waves coming from many directions as possible.
The cs image compounding method in this study assumes the medium is isotropic, meaning the cs is the same in all the directions. However, the proposed method potentially could be used to study anisotropic media by measuring cs in various directions.
V. CONCLUSION
In this study, EVMUSE was developed for liver fibrosis staging by measuring the cs from a multi-directional shear wave field in the liver. Results showed the proposed method is capable of measuring tissue elasticity accurately, as validated by SSI in phantom studies, and the in vivo measurements in patients with liver disease correlate well with MRE results. EVMUSE was demonstrated to have better penetration than the radiation force based method, and thus has potential for non-invasive staging of liver fibrosis in obese patients.
Acknowledgments
This work was supported by National Institute of Health under grants EB002167, DK092255, and DK082408.
The authors would like to thank Dr. Stefan Catheline and Dr. Meng Yin for their helpful discussions and Theresa Nielson for coordinating the patient study. The content is solely the responsibility of the authors and does not necessarily represent the official views of NIH. The technology described here has been licensed, and Mayo Clinic and some of the authors may have conflict of interest.
Footnotes
This paper has supplementary downloadable material available at http://ieeexplore.ieee.org, provided by the authors.
Contributor Information
Heng Zhao, Email: heng.zhao@sonavation.com, Mayo Clinic College of Medicine, Rochester, MN 55905 USA. He is now with Sonavation Inc., Palm Beach Gardens, FL 33410 USA.
Pengfei Song, Department of Physiology and Biomedical Engineering, Mayo Clinic College of Medicine, Rochester, MN 55905 USA.
Duane D. Meixner, Department of Radiology, Mayo Clinic College of Medicine, Rochester, MN 55905 USA
Randall R. Kinnick, Department of Physiology and Biomedical Engineering, Mayo Clinic College of Medicine, Rochester, MN 55905 USA
Matthew R. Callstrom, Email: callstrom.matthew@mayo.edu, Department of Radiology, Mayo Clinic College of Medicine, Rochester, MN 55905 USA
William Sanchez, Email: sanchez.william@mayo.edu, Department of Gastroenterology and Hepatology, Mayo Clinic College of Medicine, Rochester, MN 55905 USA.
Matthew W. Urban, Department of Physiology and Biomedical Engineering, Mayo Clinic College of Medicine, Rochester, MN 55905 USA.
Armando Manduca, Department of Physiology and Biomedical Engineering, Mayo Clinic College of Medicine, Rochester, MN 55905 USA.
James F. Greenleaf, Email: jfg@mayo.edu, Department of Physiology and Biomedical Engineering, Mayo Clinic College of Medicine, Rochester, MN 55905 USA.
Shigao Chen, Email: chen.shigao@mayo.edu, Department of Physiology and Biomedical Engineering, Mayo Clinic College of Medicine, Rochester, MN 55905 USA.
References
- 1.Friedman SL. Liver fibrosis -- from bench to bedside. J Hepatol. 2003;38(Suppl 1):S38–53. doi: 10.1016/s0168-8278(02)00429-4. [DOI] [PubMed] [Google Scholar]
- 2.Bravo AA, Sheth SG, Chopra S. Liver biopsy. N Engl J Med. 2001 Feb 15;344:495–500. doi: 10.1056/NEJM200102153440706. [DOI] [PubMed] [Google Scholar]
- 3.Regev A, Berho M, Jeffers LJ, Milikowski C, Molina EG, Pyrsopoulos NT, Feng ZZ, Reddy KR, Schiff ER. Sampling error and intraobserver variation in liver biopsy in patients with chronic HCV infection. Am J Gastroenterol. 2002 Oct;97:2614–8. doi: 10.1111/j.1572-0241.2002.06038.x. [DOI] [PubMed] [Google Scholar]
- 4.Sarvazyan AP, Rudenko OV, Swanson SD, Fowlkes JB, Emelianov SY. Shear wave elasticity imaging: A new ultrasonic technology of medical diagnostics. Ultrasound Med Biol. 1998 Nov;24:1419–1435. doi: 10.1016/s0301-5629(98)00110-0. [DOI] [PubMed] [Google Scholar]
- 5.Huwart L, Peeters F, Sinkus R, Annet L, Salameh N, ter Beek LC, Horsmans Y, Van Beers BE. Liver fibrosis: non-invasive assessment with MR elastography. NMR Biomed. 2006 Apr;19:173–9. doi: 10.1002/nbm.1030. [DOI] [PubMed] [Google Scholar]
- 6.Yin M, Talwalkar JA, Glaser KJ, Manduca A, Grimm RC, Rossman PJ, Fidler JL, Ehman RL. Assessment of hepatic fibrosis with magnetic resonance elastography. Clin Gastroenterol Hepatol. 2007 Oct;5:1207–1213. e2. doi: 10.1016/j.cgh.2007.06.012. [DOI] [PMC free article] [PubMed] [Google Scholar]
- 7.Palmeri ML, Wang MH, Dahl JJ, Frinkley KD, Nightingale KR. Quantifying hepatic shear modulus in vivo using acoustic radiation force. Ultrasound Med Biol. 2008 Apr;34:546–558. doi: 10.1016/j.ultrasmedbio.2007.10.009. [DOI] [PMC free article] [PubMed] [Google Scholar]
- 8.Boursier J, Isselin G, Fouchard-Hubert I, Oberti F, Dib N, Lebigot J, Bertrais S, Gallois Y, Cales P, Aube C. Acoustic radiation force impulse: a new ultrasonographic technology for the widespread noninvasive diagnosis of liver fibrosis. Eur J Gastroenterol Hepatol. 2010 Sep;22:1074–84. doi: 10.1097/MEG.0b013e328339e0a1. [DOI] [PubMed] [Google Scholar]
- 9.Bavu E, Gennisson JL, Couade M, Bercoff J, Mallet V, Fink M, Badel A, Vallet-Pichard A, Nalpas B, Tanter M, Pol S. Noninvasive in vivo liver fibrosis evaluation using supersonic shear imaging: a clinical study on 113 hepatitis C virus patients. Ultrasound Med Biol. 2011 Sep;37:1361–73. doi: 10.1016/j.ultrasmedbio.2011.05.016. [DOI] [PubMed] [Google Scholar]
- 10.Muller M, Gennisson JL, Deffieux T, Tanter M, Fink M. Quantitative Viscoelasticity Mapping of Human Liver Using Supersonic Shear Imaging: Preliminary in Vivo Feasability Study. Ultrasound Med Biol. 2009 Feb;35:219–229. doi: 10.1016/j.ultrasmedbio.2008.08.018. [DOI] [PubMed] [Google Scholar]
- 11.Sirli R, Bota S, Sporea I, Jurchis A, Popescu A, Gradinaru-Tascau O, Szilaski M. Liver stiffness measurements by means of supersonic shear imaging in patients without known liver pathology. Ultrasound Med Biol. 2013 Aug;39:1362–7. doi: 10.1016/j.ultrasmedbio.2013.03.021. [DOI] [PubMed] [Google Scholar]
- 12.Cassinotto C, Lapuyade B, Ait-Ali A, Vergniol J, Gaye D, Foucher J, Bailacq-Auder C, Chermak F, Le Bail B, de Ledinghen V. Liver Fibrosis: Noninvasive Assessment with Acoustic Radiation Force Impulse Elastography--Comparison with FibroScan M and XL Probes and FibroTest in Patients with Chronic Liver Disease. Radiology. 2013 Oct;269:283–92. doi: 10.1148/radiol.13122208. [DOI] [PubMed] [Google Scholar]
- 13.Ogden CL, Carroll MD, Kit BK, Flegal KM. Prevalence of obesity in the United States, 2009–2010. NCHS Data Brief. 2012 Jan;:1–8. [PubMed] [Google Scholar]
- 14.Agopian VG, Kaldas FM, Hong JC, Whittaker M, Holt C, Rana A, Zarrinpar A, Petrowsky H, Farmer D, Yersiz H, Xia V, Hiatt JR, Busuttil RW. Liver transplantation for nonalcoholic steatohepatitis: the new epidemic. Ann Surg. 2012 Oct;256:624–33. doi: 10.1097/SLA.0b013e31826b4b7e. [DOI] [PubMed] [Google Scholar]
- 15.Sandrin L, Tanter M, Gennisson JL, Catheline S, Fink M. Shear elasticity probe for soft tissues with 1-D transient elastography. IEEE Trans Ultrason Ferroelectr Freq Control. 2002 Apr;49:436–446. doi: 10.1109/58.996561. [DOI] [PubMed] [Google Scholar]
- 16.Sandrin L, Fourquet B, Hasquenoph JM, Yon S, Fournier C, Mal F, Christidis C, Ziol M, Poulet B, Kazemi F, Beaugrand M, Palau R. Transient elastography: a new noninvasive method for assessment of hepatic fibrosis. Ultrasound Med Biol. 2003 Dec;29:1705–13. doi: 10.1016/j.ultrasmedbio.2003.07.001. [DOI] [PubMed] [Google Scholar]
- 17.Castera L, Vergniol J, Foucher J, Le Bail B, Chanteloup E, Haaser M, Darriet M, Couzigou P, De Ledinghen V. Prospective comparison of transient elastography, Fibrotest, APRI, and liver biopsy for the assessment of fibrosis in chronic hepatitis C. Gastroenterology. 2005 Feb;128:343–50. doi: 10.1053/j.gastro.2004.11.018. [DOI] [PubMed] [Google Scholar]
- 18.Tzschatzsch H, Ipek-Ugay S, Guo J, Streitberger KJ, Gentz E, Fischer T, Klaua R, Schultz M, Braun J, Sack I. In vivo time-harmonic multifrequency elastography of the human liver. Phys Med Biol. 2014 Apr 7;59:1641–54. doi: 10.1088/0031-9155/59/7/1641. [DOI] [PubMed] [Google Scholar]
- 19.Wu Z, Taylor LS, Rubens DJ, Parker KJ. Sonoelastographic imaging of interference patterns for estimation of the shear velocity of homogeneous biomaterials. Phys Med Biol. 2004 Mar 21;49:911–22. doi: 10.1088/0031-9155/49/6/003. [DOI] [PubMed] [Google Scholar]
- 20.Hoyt K, Castaneda B, Parker KJ. Two-dimensional sonoelastographic shear velocity imaging. Ultrasound Med Biol. 2008 Feb;34:276–88. doi: 10.1016/j.ultrasmedbio.2007.07.011. [DOI] [PubMed] [Google Scholar]
- 21.McLaughlin J, Renzi D. Shear wave speed recovery in transient elastography and supersonic imaging using propagating fronts. Inverse Probl. 2006 Apr;22:681–706. [Google Scholar]
- 22.Song P, Manduca A, Zhao H, Urban MW, Greenleaf JF, Chen S. Fast shear compounding using robust two-dimensional shear wave speed calculation and multi-directional filtering. 2014 doi: 10.1016/j.ultrasmedbio.2013.12.026. in press. [DOI] [PMC free article] [PubMed] [Google Scholar]
- 23.Catheline S, Benech N, Brum J, Negreira C. Time reversal of elastic waves in soft solids. Phys Rev Lett. 2008 Feb 15;100:064301. doi: 10.1103/PhysRevLett.100.064301. [DOI] [PubMed] [Google Scholar]
- 24.Tzschatzsch H, Hattasch R, Knebel F, Klaua R, Schultz M, Jenderka KV, Braun J, Sack I. Isovolumetric elasticity alteration in the human heart detected by in vivo time-harmonic elastography. Ultrasound Med Biol. 2013 Dec;39:2272–8. doi: 10.1016/j.ultrasmedbio.2013.07.003. [DOI] [PubMed] [Google Scholar]
- 25.Tanter M, Bercoff J, Sandrin L, Fink M. Ultrafast compound imaging for 2-D motion vector estimation: Application to transient elastography. IEEE Trans Ultrason Ferroelectr Freq Control. 2002 Oct;49:1363–1374. doi: 10.1109/tuffc.2002.1041078. [DOI] [PubMed] [Google Scholar]
- 26.Loupas T, Powers JT, Gill RW. An Axial Velocity Estimator for Ultrasound Blood-Flow Imaging, Based on a Full Evaluation of the Doppler Equation by Means of a 2-Dimensional Autocorrelation Approach. IEEE Trans Ultrason Ferroelectr Freq Control. 1995 Jul;42:672–688. [Google Scholar]
- 27.Manduca A, Lake DS, Kruse SA, Ehman RL. Spatio-temporal directional filtering for improved inversion of MR elastography images. Med Image Anal. 2003 Dec;7:465–73. doi: 10.1016/s1361-8415(03)00038-0. [DOI] [PubMed] [Google Scholar]
- 28.Sarvazyan AP, Urban MW, Greenleaf JF. Acoustic waves in medical imaging and diagnostics. Ultrasound Med Biol. 2013 Jul;39:1133–46. doi: 10.1016/j.ultrasmedbio.2013.02.006. [DOI] [PMC free article] [PubMed] [Google Scholar]
- 29.Zhao H, Song P, Urban MW, Kinnick RR, Yin M, Greenleaf JF, Chen S. Bias Observed in Time-of-Flight Shear Wave Speed Measurements Using Radiation Force of a Focused Ultrasound Beam. Ultrasound Med Biol. 2011 Nov;37:1884–92. doi: 10.1016/j.ultrasmedbio.2011.07.012. [DOI] [PMC free article] [PubMed] [Google Scholar]
- 30.Yin M, Talwalkar JA, Glaser KJ, Ehman RL. MR Elastography of the Liver: Observations from a Review of 1,377 Exams. Proc. Intl. Soc. Mag. Reson. Med; 2011; p. 390. [Google Scholar]
- 31.Wang M, Byram B, Palmeri M, Rouze N, Nightingale K. On the precision of time-of-flight shear wave speed estimation in homogeneous soft solids: initial results using a matrix array transducer. IEEE Trans Ultrason Ferroelectr Freq Control. 2013 Apr;60:758–70. doi: 10.1109/TUFFC.2013.2624. [DOI] [PMC free article] [PubMed] [Google Scholar]
- 32.Lai X, Torp H. Interpolation methods for time-delay estimation using cross-correlation method for blood velocity measurement. IEEE Trans Ultrason Ferroelectr Freq Control. 1999;46:277–90. doi: 10.1109/58.753016. [DOI] [PubMed] [Google Scholar]
- 33.Pinton GF, Dahl JJ, Trahey GE. Rapid tracking of small displacements with ultrasound. 2006 Jun;53:1103–1117. doi: 10.1109/tuffc.2006.1642509. [DOI] [PubMed] [Google Scholar]
- 34.Viola F, Walker WF. A comparison of the performance of time-delay estimators in medical ultrasound. IEEE Trans Ultrason Ferroelectr Freq Control. 2003 Apr;50:392–401. doi: 10.1109/tuffc.2003.1197962. [DOI] [PubMed] [Google Scholar]
- 35.Shepard D. A two-dimensional interpolation function for irregularly-spaced data. Proceedings of the ACM Conference; 1968; pp. 517–24. [Google Scholar]
- 36.Bercoff J, Tanter M, Fink M. Supersonic shear imaging: A new technique for soft tissue elasticity mapping. IEEE Trans Ultrason Ferroelectr Freq Control. 2004 Apr;51:396–409. doi: 10.1109/tuffc.2004.1295425. [DOI] [PubMed] [Google Scholar]
- 37.Venkatesh SK, Yin M, Ehman RL. Magnetic resonance elastography of liver: technique, analysis, and clinical applications. J Magn Reson Imaging. 2013 Mar;37:544–55. doi: 10.1002/jmri.23731. [DOI] [PMC free article] [PubMed] [Google Scholar]
- 38.Ferraioli G, Tinelli C, Dal Bello B, Zicchetti M, Filice G, Filice C. Accuracy of real-time shear wave elastography for assessing liver fibrosis in chronic hepatitis C: a pilot study. Hepatology. 2012 Dec;56:2125–33. doi: 10.1002/hep.25936. [DOI] [PubMed] [Google Scholar]
- 39.Uffmann K, Ladd ME. Actuation systems for MR elastography: design and applications. IEEE Eng Med Biol Mag. 2008 May-Jun;27:28–34. doi: 10.1109/EMB.2007.910268. [DOI] [PubMed] [Google Scholar]
- 40.Zhao H, Song P, Manduca A, Kinnick RR, Urban MW, Greenleaf JF, Chen S. Two-dimensional shear elasticity imaging using external mechanical vibration. presented at the Joint UFFC, EFTF and PFM Symposium; Prague, Czech Republic. 2013. [Google Scholar]
- 41.Wang M, Byram B, Palmeri M, Rouze N, Nightingale K. Imaging transverse isotropic properties of muscle by monitoring acoustic radiation force induced shear waves using a 2-D matrix ultrasound array. IEEE Trans Med Imaging. 2013 Sep;32:1671–84. doi: 10.1109/TMI.2013.2262948. [DOI] [PMC free article] [PubMed] [Google Scholar]
- 42.Liu Z, Bilston L. On the viscoelastic character of liver tissue: experiments and modelling of the linear behaviour. Biorheology. 2000;37:191–201. [PubMed] [Google Scholar]
- 43.Chen S, Fatemi M, Greenleaf JF. Quantifying elasticity and viscosity from measurement of shear wave speed dispersion. J Acoust Soc Am. 2004 Jun;115:2781–2785. doi: 10.1121/1.1739480. [DOI] [PubMed] [Google Scholar]
- 44.Yin M, Rouviere O, Glaser KJ, Ehman RL. Diffraction-biased shear wave fields generated with longitudinal magnetic resonance elastography drivers. Magn Reson Imaging. 2008 Jul;26:770–80. doi: 10.1016/j.mri.2008.01.019. [DOI] [PMC free article] [PubMed] [Google Scholar]


