

Abstract
The geographically constrained distribution of Epstein-Barr virus (EBV)-associated nasopharyngeal carcinoma (NPC) in southeast Asian populations suggests that both viral and host genetics may influence disease risk. Although susceptibility loci have been mapped within the human genome, the role of viral genetics in the focal distribution of NPC remains an enigma. Here we report a molecular phylogenetic analysis of an NPC-associated viral oncogene, LMP1, in a large panel of EBV isolates from southeast Asia and from Papua New Guinea, Africa, and Australia, regions of the world where NPC is and is not endemic, respectively. This analysis revealed that LMP1 sequences show a distinct geographic structure, indicating that the southeast Asian isolates have evolved as a lineage distinct from those of Papua New Guinea, African, and Australian isolates. Furthermore, a likelihood ratio test revealed that the C termini of the LMP1 sequences of the southeast Asian lineage are under significant positive selection pressure, particularly at some sites within the C-terminal activator regions. We also present evidence that although the N terminus and transmembrane region of LMP1 have undergone recombination, the C-terminal region of the gene has evolved without any history of recombination. Based on these observations, we speculate that selection pressure may be driving the LMP1 sequences in virus isolates from southeast Asia towards a more malignant phenotype, thereby influencing the endemic distribution of NPC in this region.
The oncogenic potential of Epstein-Barr virus (EBV) is well recognized, and the virus is associated with a number of human malignancies such as Burkitt's lymphoma, which is endemic to equatorial Africa and Papua New Guinea, and nasopharyngeal carcinoma (NPC), which is common to southeast Asia, Mediterranean Africa, and Inuit populations (reviewed in reference 14). Given the geographically constrained distribution of some of these malignancies, the degree to which host and viral genetic factors influence disease risk is uncertain. Although the influence of host genetic factors has been explored for NPC (6, 12, 19), the role of viral phylogenetics and its impact on the predisposition to malignancy has not been defined.
Each of the EBV-associated malignancies is characterized by a unique viral and cellular phenotype. In most of the EBV-associated malignancies, viral gene expression is often restricted to a limited number of proteins. One such protein that has received considerable attention is latent membrane antigen 1 (LMP1), which is expressed in all EBV-associated pathological diseases except Burkitt's lymphoma. This protein is of particular interest because it has been recognized as one of the most crucial latent proteins for EBV-mediated transformation of normal B cells and is uniquely able to induce malignant outgrowth and hyperplasia in transgenic mice (17). Previous studies have shown that LMP1 acts as a constitutively active receptor-like molecule independent of the binding of a ligand. The transmembrane domains mediate oligomerization of LMP1 molecules in the plasma membrane, a prerequisite for LMP1 function. The C terminus of LMP1 initiates signaling through C-terminal activator regions (referred to as CTAR) which are involved in the induction of NF-κB, STAT, and Janus kinase 3 (JAK3) (11, 16, 22).
Over the last few years, there has been increasing evidence that specific amino acid changes within the various functional domains of LMP1 may alter its oncogenic potential (3, 4, 26). Particular attention has been focused on a 10-amino-acid region (amino acids 343 to 352) of LMP1 adjacent to the CTAR2 domain which is frequently deleted from EBV isolates from regions of high NPC endemicity (18, 21). However, the clinical significance of this variant form of LMP1 has been challenged because the aggressively oncogenic phenotype of the variant form of LMP1 does not map to these 10 amino acids (13, 21). An alternative approach is to employ viral phylogenetics at the population level to understand the focal distribution of NPC in southeast Asia. This analysis revealed that LMP1 sequences from EBV isolates from regions where NPC is endemic have evolved under significant selection pressure and also as a distinct lineage with almost negligible exchange of isolates with other regions of the world.
MATERIALS AND METHODS
Virus Isolates.
Lymphoblastoid cell lines were established from a panel of unrelated, healthy, EBV-seropositive African, Australian Caucasian, southeast Asian, and Papua New Guinean donors by spontaneous outgrowth from peripheral lymphocytes cultured in the presence of 0.1 μg of cyclosporine A per ml (25). A total of 26 spontaneous lymphoblastoid cell lines (eight Australian Caucasian, nine Papua New Guinean, two African, and seven southeast Asian) were used to recover the resident EBV isolates from each individual. In addition, 17 virus isolates from southeast Asia were directly sequenced from EBV-carrying NPC biopsies. These isolates were classified as type 1 EBV based on the DNA sequence divergence within the BamHI WYH and E regions of the genome. Lymphoblastoid cell lines were also established by exogenous virus transformation of peripheral B cells with type 1 (B95-8 and IARC-BL74) or type 2 (Ag876) EBV isolates (23). Cell lines were routinely maintained in RPMI 1640 containing 2 mM glutamine, 100 IU of penicillin per ml, and 100 μg of streptomycin per ml plus 10% fetal calf serum (growth medium).
PCR and DNA sequencing of EBV gene fragments.
Specific oligonucleotide primers flanking three different regions of the LMP1 sequence (N terminus, 219 bp; transmembrane, 270 bp; and C terminus, 478 bp) were selected for PCR amplification. The resulting PCR products were purified with QIAquick spin columns (Qiagen Inc., Chatsworth, Calif.) and sequenced in both directions with a Prism ready reaction dideoxy terminator cycle sequencing kit (Applied Biosystems Inc., Foster City, Calif.) following the manufacturer's protocol.
Molecular phylogenies.
Alignments of sequences from three regions of LMP1 (N terminus, transmembrane domains, and C terminus) were made with the sequence editor Se-Al (24). In addition to these three alignments, a concatenated alignment of all three regions was created. We used maximum likelihood to reconstruct the phylogeny of the nucleotide sequences of the EBV isolates, for each gene region and for the concatenated alignment. Although it requires more computational time than simpler methods such as parsimony or neighbor joining, maximum likelihood is more generally accurate and robust than other phylogenetic inference methods (10). We used the HKY+Γ model, which allows for variation in substitution rates across sites, base frequency bias, and transition-transversion bias (7, 31). We estimated the parameters of the model from the data with maximum likelihood. All maximum-likelihood phylogenies were estimated with the phylogenetic inference package PAUP* (28).
Analysis of selection across codons.
The rate of accumulation of synonymous substitutions, which change the DNA sequence of a gene but do not change the translated amino acid sequence, is expected to be governed primarily by the mutation rate. The rate of nonsynonymous substitutions, which change the amino acid sequence, may be influenced by selection. Therefore, the ratio of the rates of nonsynonymous and synonymous substitutions (signified by omega ω) can be used as a test of the action of selection on the evolution of a protein-coding gene. Codons under no selection would be expected to have no restriction on changing the amino acid and so should accumulate nonsynonymous and synonymous substitutions at the same rate, so the ratio will be one (ω = 1). Codons under negative selection, so that some amino acid changes have lower fitness than the existing amino acid, will accumulate nonsynonymous changes at a slower rate, so the ratio will be less than one (ω < 1). Codons under such strong negative selection that no amino acid changes are permitted would have a ratio of zero (ω = 0). Codons under positive selection, so that favorable changes in amino acids are promoted by selection, will have a greater rate of nonsynonymous substitutions than synonymous, so the ratio will be greater than one (ω > 1).
In order to test for codons with Ω > 1, we compared the likelihoods of a nested series of models estimated by the program PAML 3.13, using a likelihood ratio test (5, 10). For this test, the estimated likelihood of the data given the first (simpler) model is compared to the likelihood given the second (more parameter-rich) model. If the second model has a significantly higher likelihood, the simpler model is rejected in favor of the more parameter-rich model. The test statistics for this comparison, twice the difference of the likelihoods of the two models, was compared to a chi-squared distribution (19a). The comparison between models was made with a likelihood ratio test (5, 10).
First, it is necessary to test whether ω varies significantly across codons. If codons do not vary significantly in the ratio of nonsynonymous and synonymous rates, then there is no evidence that the rate at some sites is being determined by selection. However, if we can show that a multiple-ratio model (M1; codons differ in value of ω) is a significantly better fit to the data than the single-ratio model (M0; all codons have the same value of ω), then we can assume that different codons are being differently affected by selection. To determine whether the difference in the ratio of rates is due to positive or negative selection, two more nested pairs of models must be tested.
Under the two-ratio “neutral” model (M1), codons are either completely free to accept nonsynonymous changes (ω = 1) or completely constrained so that no change of amino acid is permitted (ω = 0). This two-ratio model only allows codons that are neutral or constrained, so in order to demonstrate that some codons are under selection, it must be shown that this model is inadequate to describe the data and that an additional rate category must be added (the three-ratio model, M3) (35).
The existence of a third category of sites that are neither completely neutral (ω = 1) nor completely constrained (ω = 0) suggests that some codons are under selection, either negative (some but not all amino acid changes allowed; ω < 1) or positive (some amino acid changes are promoted by selection; ω > 1). Since we are specifically interested in sites under positive selection, a further test is needed. We need to show that a model (M7) that allows codons to be constrained (ω = 0), neutral (ω = 1), or under negative selection (ω < 1) is not adequate to describe the data. Only after model M7 is rejected in favor of the M8 model, which allows for codons under positive selection (ω > 1), can we conclude that some codons in the sequence are under positive selection (34). Codons under positive selection can then be identified with an empirical Bayesian approach (35) and mapped onto the alignment.
Analysis of selection across lineages.
In order to test whether LMP1 sequences in the southeast Asian region show different patterns of molecular evolution than isolates from other regions, we took the maximum-likelihood phylogeny for each of the three LMP1 sequences and identified each edge of the tree as southeast Asian or non-southeast Asian. An edge of the tree is the lineage connecting two nodes (branching points) or between a node and a tip. “Southeast Asian edges” were those tips leading to southeast Asian isolates plus internal edges if the majority of edges attached to them were southeast Asian. The approach taken is similar to that described above for comparing nested sets of models to determine how many parameters are needed to describe the data. We used the codeml program in PAML 3.1 (33) to test a single-ratio model, where all lineages have the same ratio of nonsynonymous and synonymous rates (ω), against a model which allowed two different ratios, one for southeast Asian edges and one for non-southeast Asian edges (32). We then tested whether the NPC lineages had a different ω than non-NPC lineages within the southeast Asian clade by comparing a one-rate model (all lineages have the same ω) to a two-ratio model (NPC lineages have a different value of ω from non-NPC lineages).
Analysis of recombination.
To determine whether there was any evidence for recombination within the LMP1 sequences, we conducted four different tests for recombination on each of the alignments (1). Geneconv (S. A. Sawyer, 1999, http://www.math.wustl.edu/≈sawyer) and maximum chi-square (27) tests were used to determine if there was any significant clustering of substitution between each pair of sequence. The decrease in linkage disequilibrium between segregating alleles, measured as r2, with distance was calculated as described previously (2). Finally, we also conducted a maximum-likelihood permutation test (20), which is designed to estimate the rate of recombination and assesses the significance of the estimate by randomly shuffling the sites.
RESULTS AND DISCUSSION
Molecular phylogenies.
LMP1 sequences from EBV isolates from regions where NPC is endemic (southeast Asia) and nonendemic (Australia, Papua New Guinea, and Africa) were analyzed with the phylogenetic inference package PAUP* (28). The phylogenetic trees of three different regions of LMP1 (N terminus, transmembrane, and C terminus) from multiple EBV isolates showed a strong geographical structure, with most isolates from each region occurring together on the tree (Fig. 1a to d). One of the interesting aspects of this analysis was that LMP1 sequences from all southeast Asian isolates (both NPC patients and healthy virus carriers) were generally evolving on a distinct lineage compared to the EBV isolates from Papua New Guinean, African, and Australian Caucasian donors. This pattern of geographic distribution was quite distinct from the one seen for the EBNA genes, which showed that southeast Asian and Papua New Guinean isolates were evolving on the same lineage (15).
FIG. 1.
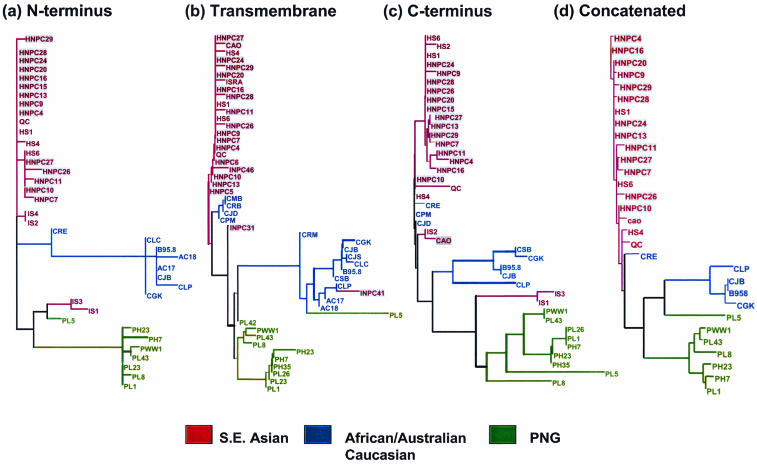
Maximum-likelihood phylogenies of EBV isolates for three regions of the LMP1 gene: (a) N terminus, (b) transmembrane, and (c) C terminus. (d) Concatenated alignment of isolates for which all three regions were sequenced. See the text for details of phylogeny estimation. Each tree shows distinct clustering of isolates from different geographical regions: southeast Asia, Africa, Australia, and Papua New Guinea (PNG). Note that these trees are unrooted and so cannot be used to determine which regional group is basal. Isolates from NPC patients are shown in grey shading.
Although a clear geographical structure was observed in all the trees, some minor differences in topology were evident when individual trees for different regions were compared. It is possible that these differences represent divergence in the evolutionary history of different regions of the LMP1 gene, through recombination between different isolates (30). Given the low degree of divergence between isolates for these sequences (and consequently the very short branch lengths on most lineages), the minor differences in topology may have arisen from variation in the number of substitutions supporting alternative trees. These phylogenies indicate that there has been little or no exchange of isolates between southeast Asia and the other geographic regions (Papua New Guinea, Africa, and Australia). The strong geographic structure of EBV isolates is consistent with geographic patterns in NPC incidence, which is much higher in southeast Asia than in the regions where NPC is not endemic. Therefore, it seems possible that some aspects of the genotype of EBV strains present in southeast Asia could be responsible for the high incidence of NPC.
The tree based on LMP1 sequences shows very low resolution between the isolates within each region (particularly southeast Asia), as shown by the short branches within these groups. This suggests either that the LMP1 sequences sampled have a relatively recent common origin or that the rate of evolution of these sequences has been relatively low. Furthermore, because of the shallow divergences between the southeast Asian isolates, it is difficult to determine whether the LMP1 sequences from the NPC patients form a distinct clade within the region (which would indicate a common origin of NPC strains). Thus, the current analyses show no evidence that NPC lineages display a distinct origin within the southeast Asian clade (Fig. 2), and on the basis of the LMP1 sequences reported here, we cannot identify a unique strain of EBV that is responsible for NPC. However, these data does not rule out the possibility that unique sequence motifs within the southeast Asian strains predispose this population to a higher risk of NPC.
FIG. 2.
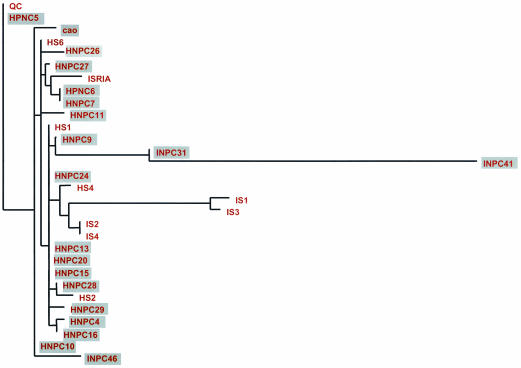
Maximum-likelihood phylogeny of LMP1 sequences from the southeast Asian isolates. All three gene regions—C terminus, transmembrane, and N terminus—were included in the alignment on which this tree is based, although not all three sequences were available for all isolates. Isolates from NPC patients are shown with grey shading.
Evidence of selection across lineages.
We used the program PAML 3.1 (33) to test for significant variation in the ratio of nonsynonymous to synonymous substitution rates (signified by ω) between isolates from distinct geographic regions for the three different regions of LMP1 and for the concatenated alignment of all three gene regions. In order to demonstrate that some codons in a sequence are under positive selection pressure, it must be shown that there is an excess of nonsynonymous substitutions (ω > 1); that is, that more amino acid substitutions have occurred more frequently than would be expected by chance. The procedure established by Yang and colleagues (35) allows testing of a series of nested models of substitution against the data, at each step asking whether the data reject a simpler model in favor of a more complex model.
We found that ω was higher in the southeast Asian lineages than in the non-southeast Asian lineages for all three regions of the LMP1 sequence (Table 1). However, these differences were not statistically significant, potentially as a result of low statistical power due to relatively short sequences. To increase the power of the test by increasing the sequence length, we repeated the test for a concatenated alignment of all three regions (987 nucleotides) for a subset of 12 isolates (six southeast Asian and six non-southeast Asian). For the concatenated alignment, the southeast Asian isolates showed a significantly higher ω, suggesting that they were under different selection pressure than non-southeast Asian lineages (Table 1).
TABLE 1.
Comparisons of the ratios of nonsynonymous to synonymous substitution rates (ω) across lineages, for three regions of the LMP1 gene and for the concatenated alignment of all three gene regions
| Comparison | Region | ωone ratio | ωa | ωb |
|---|---|---|---|---|
| Southeast Asian (a) vs. non-southeast Asian (b) isolates | C terminus | 2.8889 | 7.9025 | 2.2606 |
| N terminus | 0.6324 | 0.8211 | 0.5806 | |
| Transmembrane | 1.8561 | 3.4159 | 1.6189 | |
| Concatenated | 0.9872 | ∞ | 0.7302a | |
| NPC (a) vs non-NPC (b) isolates | C terminus | 10.5389 | ∞ | 7.2927 |
| N terminus | 0.9923 | 2719 | 0.5559 | |
| Transmembrane | 0.9646 | 0.7961 | ∞ | |
| Concatenated | ∞ | ∞ | ∞ |
P < 0.01.
Within the southeast Asian clade, the NPC lineages showed a higher ω than non-NPC southeast Asian lineages for the C-terminal and N-terminal regions but not for the transmembrane region: however, none of these differences were statistically significant (Table 1). We also tested the concatenated alignment of all three regions of the LMP1 gene for six isolates, comparing ω in the NPC and non-NPC southeast Asian isolates. For both of these groups of isolates, ω = ∝, indicating that in this alignment there were nonsynonymous substitutions but no synonymous substitutions, and so the ω values for the NPC and non-NPC lineages cannot be statistically compared. It should be noted that none of the models in the analysis allows for variation in ω both between lineages and across sites within lineages, so when analyzing ω across lineages, ω is averaged across all the sites in the alignment (and vice versa). This makes it a conservative test, as a higher ω in one lineage than the other will only be detected if it affects many sites. Similarly, a change in ω at only a few sites is unlikely to be detected, even if the change is large.
Evidence of selection across codons.
We looked for evidence of selection on specific codons within the LMP1 gene with an additional series of nested models. For the three different regions of LMP1 sequences analyzed in this study, only for the C terminus can the null (M0) and neutral (M1) models be rejected (Table 2). This may be because the analysis concerns the average ω for each site, taken across all lineages in the phylogeny, and so will only detect positive selection in sites that are under selection in many lineages or for which selection is strong enough in a subset of lineages to make a significant difference to the average rate. For the C-terminal region, M7 is rejected in favor of M8, indicating that a model that allows some positively selected sites (ω > 1) is a significantly better fit to the data than a model that allows only constrained sites, neutral sites, or sites under negative selection (Table 2). Sites with a probability of greater than 50% of being under positive selection are shown in Table 3 and Fig. 3. Of particular interest were residues 321, 350, and 356 within the C terminus of LMP1, which showed a probability of >99% of being positively selected. Two of these residues (N350 and A356) lie within box 2 of the JAK3 motif, while the other residue (D321) is located within the repeat region of LMP1 (Fig. 3). Other residues that showed a probability of >50 to 90% of being positively selected included a number of sites within the repeat region and CTAR2 and CTAR3 domains (Table 3 and Fig. 3).
TABLE 2.
Likelihood ratio tests of variation in ratio of nonsynonymous to synonymous substitution rates (ω) across codons for three regions of the LMP1 genea
| Sequence | Comparison (a vs. b) | Likelihood of models
|
Test statistic (2 × [a − b]) | df | |
|---|---|---|---|---|---|
| −lnL (a) | −lnL (b) | ||||
| C terminus | M3 vs M0 | −1023.76087 | −1034.80274 | 22.083726 | 4* |
| N terminus | M3 vs M0 | −696.322549 | −702.057203 | 11.469308 | 4 |
| Transmembrane | M3 vs M0 | −548.304565 | −548.442031 | 0.274932 | 4 |
| C terminus | M3 vs M1 | −1023.76087 | −1039.5224 | 31.523048 | 5* |
| N terminus | M3 vs M1 | −696.322549 | −698.729951 | 4.814804 | 5 |
| Transmembrane | M3 vs M1 | −548.304565 | −549.670193 | 2.731256 | 5 |
| C terminus | M8 vs M7 | −1024.82898 | −1039.87408 | 30.090182 | 2* |
Each line represents the comparison of two nested models of substitution rates with a likelihood ratio test; see the text for details of the models tested. −lnL, negative log likelihood; df, degrees of freedom. *, P < 0.05.
TABLE 3.
Amino acid residues within the C terminus of LMP1 sequences that have a > 50% probability of being positively selecteda
| Amino acid residue relative to CAO-LMP1b | Position sequence | Probability that ω > 1 |
|---|---|---|
| D | 282 | 0.8195 |
| G | 303 | 0.6955 |
| D | 321 | 0.9947* |
| S | 337 | 0.5629 |
| N | 350 | 1.0000* |
| A | 356 | 0.9966* |
| N | 357 | 0.5506 |
| G | 359 | 0.8289 |
| S | 366 | 0.9184 |
| S | 347 | 0.7457 |
| G | 373 | 0.5500 |
Sites with a greater than 99% probability of being under positive selection are marked with asterisks.
CAO-LMP1 is an EBV isolate from an NPC patient from southeast Asia.
FIG. 3.
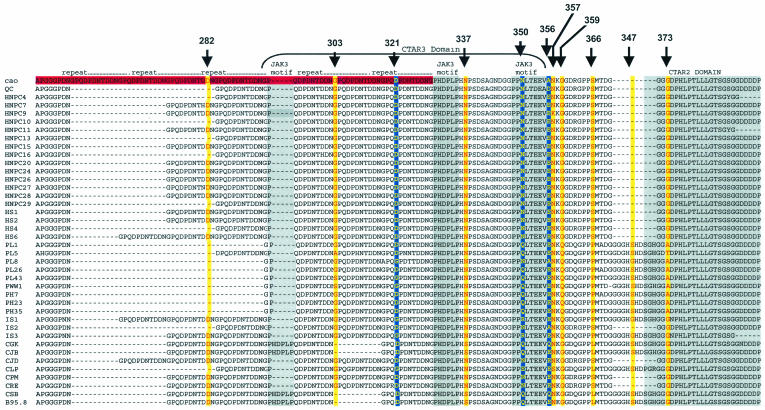
C-terminal alignment, with the putative positively selected sites shown. Sites for which P is >99% are shown in bold yellow letters on a blue background, while sites for which P is >50% but less than 99% are shown as red letters on a yellow background. The repeat region is shown as a red box. The CTAR domains and JAK3 motif are also indicated. For more details on the analysis, see the text and Table 3.
It has been shown that recombination between sequences can affect the reliability of estimates of ω (1). To confirm that our finding of significant positive selection on codons in the C terminus is not due to recombination, we conducted four different tests of recombination on the alignments for each gene region. Since each of these methods makes different assumptions about the data, it is very likely that any signal of recombination would be detected by at least one of them. First, we used the Geneconv (Sawyer, http://www.math.wustl.edu/≈sawyer) and maximum chi square (27) tests to determine if there was any significant clustering of substitutions between each pair of sequences. Second, we looked at another fingerprint of recombination, the decrease in linkage disequilibrium between segregating alleles, measured as r2, with distance (2). We also conducted a maximum-likelihood permutation test (20), which is designed to estimate the rate of recombination and assesses the significance of the estimate by randomly shuffling the sites and testing whether the fit of the model to the data gets worse.
A summary of these analyses is presented in Table 4. These analyses revealed conclusive evidence of recombination for the N-terminal region (two methods detected recombination), while only weak evidence for recombination was observed for the transmembrane region of LMP1 (one method detected recombination). However, none of the four tests detected any evidence for recombination in the C-terminal region (Table 4). These analyses further support our conclusions that that the C terminus of the LMP1 gene is under significant positive selection pressure, particularly at some sites within the C-terminal activator regions.
TABLE 4.
Output of the recombination detection methods useda
| Region | Result with test:
|
|||
|---|---|---|---|---|
| MChi | GCV | LPT | LD | |
| N terminus | 0.013 | 0.2699 | 0.31, r = 0 | 0.012, p = −0.146628 |
| Transmembrane | 0.002 | 0.953 | 0.33, r = 0 | 0.646, p = 0.04187 |
| C terminus | 0.204 | 0.0754 | 0.28, r = 1.7 | 0.202, p = −0.05973 |
P was assessed by permuting sites 1,000 times. Mchi, maximum chi-square; GCV, geneconv; LPT, likelihood permutation test; r, estimated recombination rate; LD, linkage disequilibrium versus distance; p, Pearson correlation coefficient between linkage disequilibrium and distance.
The results in this study show that the EBV-encoded oncogene LMP1 in southeast Asian virus isolates displays distinct evolutionary dynamics compared to LMP1 sequences from other regions of the world. We speculate that positive selection on LMP1 may enhance the oncogenic potential of some southeast Asian isolates of EBV, e.g., by altering downstream signaling through STAT/NF-κB and/or AP-1 activation. Further effects, such as promotion of cell survival through the induction of antiapoptotic proteins (8) and/or by reducing the immunogenicity of malignant cells (29), may also contribute to the endemic distribution of NPC in this region. This hypothesis is strongly supported by recent studies by Hu and colleagues, who showed that LMP1 sequences derived from LMP1-expressing NPC tumors were highly mutated and poorly immunogenic (9).
This study suggests that the focal distribution of NPC may be influenced not only by host genetics, diet, and environment but also by an interplay with viral genetics. Furthermore, the present study also provides an important platform from which to explore the similar interplay of viral genetics in other human malignancies, especially those associated with hepatitis B virus, human papillomavirus, and human T-cell leukemia virus type 1.
REFERENCES
- 1.Anisimova, M., R. Nielsen, and Z. Yang. 2003. Effect of recombination on the accuracy of the likelihood method for detecting positive selection at amino acid sites. Genetics 164:1229-1236. [DOI] [PMC free article] [PubMed] [Google Scholar]
- 2.Awadalla, P., A. Eyre-Walker, and J. Maynard-Smith. 1999. Linkage disequilibrium and recombination in hominid mitochondrial DNA. Science 286:2524-2525. [DOI] [PubMed] [Google Scholar]
- 3.Cheung, S. T., S. F. Leung, K. W. Lo, K. W. Chiu, J. S. Tam, T. F. Fok, P. J. Johnson, J. C. Lee, and D. P. Huang. 1998. Specific latent membrane protein 1 gene sequences in type 1 and type 2 Epstein-Barr virus from nasopharyngeal carcinoma in Hong Kong. Int. J. Cancer 76:399-406. [DOI] [PubMed] [Google Scholar]
- 4.Edwards, R. H., F. Seillier-Moiseiwitsch, and N. Raab-Traub. 1999. Signature amino acid changes in latent membrane protein 1 distinguish Epstein-Barr virus strains. Virology 261:79-95. [DOI] [PubMed] [Google Scholar]
- 5.Felsenstein, J. 1981. Evolutionary trees from DNA sequences: a maximum likelihood approach. J. Mol. Evol. 17:368-376. [DOI] [PubMed] [Google Scholar]
- 6.Feng, B. J., W. Huang, Y. Y. Shugart, M. K. Lee, F. Zhang, J. C. Xia, H. Y. Wang, T. B. Huang, S. W. Jian, P. Huang, Q. S. Feng, L. X. Huang, X. J. Yu, D. Li, L. Z. Chen, W. H. Jia, Y. Fang, H. M. Huang, J. L. Zhu, X. M. Liu, Y. Zhao, W. Q. Liu, M. Q. Deng, W. H. Hu, S. X. Wu, H. Y. Mo, M. F. Hong, M. C. King, Z. Chen, and Y. X. Zeng. 2002. Genome-wide scan for familial nasopharyngeal carcinoma reveals evidence of linkage to chromosome 4. Nat. Genet. 31:395-399. [DOI] [PubMed] [Google Scholar]
- 7.Hasegawa, M., H. Kishino, and T. Yano. 1985. Dating of the human-ape splitting by a molecular clock of mitochondrial DNA. J. Mol. Evol. 21:160-174. [DOI] [PubMed] [Google Scholar]
- 8.Henderson, S., M. Rowe, C. Gregory, D. Croom-Carter, F. Wang, R. Longnecker, E. Kieff, and A. B. Rickinson. 1991. Induction of bcl-2 expression by Epstein-Barr virus latent membrane protein 1 protects infected B cells from programmed cell death. Cell 65:1107-1115. [DOI] [PubMed] [Google Scholar]
- 9.Hu, L., B. Troyanovsky, X. Zhang, P. Trivedi, I. Ernberg, and G. Klein. 2000. Differences in the immunogenicity of latent membrane protein 1 (LMP1) encoded by Epstein-Barr virus genomes derived from LMP1-positive and -negative nasopharyngeal carcinoma. Cancer Res. 60:5589-5593. [PubMed] [Google Scholar]
- 10.Huelsenbeck, J. P., and B. Rannala. 1997. Phylogenetic methods come of age:testing hypothesis in an evolutionary context. Science 276:227-232. [DOI] [PubMed] [Google Scholar]
- 11.Izumi, K. M., and E. D. Kieff. 1997. The Epstein-Barr virus oncogene product latent membrane protein 1 engages the tumor necrosis factor receptor-associated death domain protein to mediate B lymphocyte growth transformation and activate NF-κB. Proc. Natl. Acad. Sci. USA 94:12592-12597. [DOI] [PMC free article] [PubMed] [Google Scholar]
- 12.Jalbout, M., N. Bouaouina, J. Gargouri, M. Corbex, S. Ben Ahmed, and L. Chouchane. 2003. Polymorphism of the stress protein HSP70-2 gene is associated with the susceptibility to the nasopharyngeal carcinoma. Cancer Lett. 193:75-81. [DOI] [PubMed] [Google Scholar]
- 13.Johnson, R. J., M. Stack, S. A. Hazlewood, M. Jones, C. G. Blackmore, L. F. Hu, and M. Rowe. 1998. The 30-base-pair deletion in Chinese variants of the Epstein-Barr virus LMP1 gene is not the major effector of functional differences between variant LMP1 genes in human lymphocytes. J. Virol. 72:4038-4048. [DOI] [PMC free article] [PubMed] [Google Scholar]
- 14.Khanna, R., S. R. Burrows, and D. J. Moss. 1995. Immune regulation in Epstein-Barr virus-associated diseases. Microbiol. Rev. 59:387-405. [DOI] [PMC free article] [PubMed] [Google Scholar]
- 15.Khanna, R., R. W. Slade, L. Poulsen, D. J. Moss, S. R. Burrows, J. Nicholls, and J. M. Burrows. 1997. Evolutionary dynamics of genetic variation in Epstein-Barr virus isolates of diverse geographical origins: evidence for immune pressure-independent genetic drift. J. Virol. 71:8340-8346. [DOI] [PMC free article] [PubMed] [Google Scholar]
- 16.Kieff, E. 1996. Epstein-Barr virus and its replication, p. 2343-2396. In B. N. Fields, D. M. Knipe, and P. M. Howley (ed.), Virology. Raven Press, Philadelphia, Pa.
- 17.Kulwichit, W., R. H. Edwards, E. M. Davenport, J. F. Baskar, V. Godfrey, and N. Raab-Traub. 1998. Expression of the Epstein-Barr virus latent membrane protein 1 induces B cell lymphoma in transgenic mice. Proc. Natl. Acad. Sci. USA 95:11963-11968. [DOI] [PMC free article] [PubMed] [Google Scholar]
- 18.Li, S. N., Y. S. Chang, and S. T. Liu. 1996. Effect of a 10-amino acid deletion on the oncogenic activity of latent membrane protein 1 of Epstein-Barr virus. Oncogene 12:2129-2135. [PubMed] [Google Scholar]
- 19.Lu, C. C., J. C. Chen, Y. T. Jin, H. B. Yang, S. H. Chan, and S. T. Tsai. 2003. Genetic susceptibility to nasopharyngeal carcinoma within the HLA-A locus in Taiwanese. Int. J. Cancer 103:745-751. [DOI] [PubMed] [Google Scholar]
- 19a.Maynard-Smith, J. 1992. Analyzing the mosaic structure of genes. J. Mol. Evol. 34:126-129. [DOI] [PubMed] [Google Scholar]
- 20.McVean, G., P. Awadalla, and P. Fearnhead. 2002. A coalescent-based method for detecting and estimating recombination from gene sequences. Genetics 160:1231-1241. [DOI] [PMC free article] [PubMed] [Google Scholar]
- 21.Miller, W. E., J. L. Cheshire, A. S. J. Baldwin, and N. Raab-Traub. 1998. The NPC derived C15 LMP1 protein confers enhanced activation of NF-kappa B and induction of the EGFR in epithelial cells. Oncogene 16:1869-1877. [DOI] [PubMed] [Google Scholar]
- 22.Miller, W. E., G. Mosialos, E. Kieff, and N. Raab-Traub. 1997. Epstein-Barr virus LMP1 induction of the epidermal growth factor receptor is mediated through a TRAF signaling pathway distinct from NF-κB activation. J. Virol. 71:586-594. [DOI] [PMC free article] [PubMed] [Google Scholar]
- 23.Moss, D. J., I. S. Misko, S. R. Burrows, K. Burman, R. McCarthy, and T. B. Sculley. 1988. Cytotoxic T-cell clones discriminate between A- and B-type Epstein-Barr virus transformants. Nature 331:719-721. [DOI] [PubMed] [Google Scholar]
- 24.Rambaut, A. E. 1996. Sequence alignment editor. Oxford University, Oxford, United Kingdom.
- 25.Rickinson, A. B., and M. A. Epstein. 1978. Sensitivity of the transforming and replicative functions of Epstein-Barr virus to inhibition by phosphonoacetate. J. Gen. Virol. 40:409-420. [DOI] [PubMed] [Google Scholar]
- 26.Sandvej, K., J. W. Gratama, M. Munch, X. G. Zhou, R. L. Bolhuis, B. S. Andresen, N. Gregersen, and S. Hamilton-Dutoit. 1997. Sequence analysis of the Epstein-Barr virus (EBV) latent membrane protein-1 gene and promoter region: identification of four variants among wild-type EBV isolates. Blood 90:323-330. [PubMed] [Google Scholar]
- 27.Smith, P. R., and B. E. Griffin. 1992. Transcription of the Epstein-Barr virus gene EBNA-1 from different promoters in nasopharyngeal carcinoma and B-lymphoblastoid cells. J. Virol. 66:706-714. [DOI] [PMC free article] [PubMed] [Google Scholar]
- 28.Swofford, D. L. 1999. PAUP*: phylogenetic analysis using parsimony (* and other methods), version 4. Sinauer Associates, Sunderland, Mass.
- 29.Trivedi, P., L. F. Hu, F. Chen, B. Christensson, M. G. Masucci, G. Klein, and G. Winberg. 1994. Epstein-Barr virus (EBV)-encoded membrane protein LMP1 from a nasopharyngeal carcinoma is non-immunogenic in a murine model system, in contrast to a B cell-derived homologue. Eur. J. Cancer 30:84-88. [DOI] [PubMed] [Google Scholar]
- 30.Walling, D. M., N. Shebib, S. C. Weaver, C. M. Nichols, C. M. Flaitz, and J. Webster-Cyriaque. 1999. The molecular epidemiology and evolution of Epstein-Barr virus: sequence variation and genetic recombination in the latent membrane protein-1 gene. J. Infect. Dis. 179:763-774. [DOI] [PubMed] [Google Scholar]
- 31.Yang, Z. 1994. Maximum likelihood phylogenetic estimation from DNA sequences with variable rates over sites: approximate methods. J. Mol. Evol. 39:306-314. [DOI] [PubMed] [Google Scholar]
- 32.Yang, Z. 1998. Likelihood ratio tests for detecting positive selection and application to primate lysozyme evolution. Mol. Biol. Evol. 15:568-573. [DOI] [PubMed] [Google Scholar]
- 33.Yang, Z. 2001. Phylogenetic analysis by maximum likelihood (PAML), version 3.1. University College London, London, England.
- 34.Yang, Z. H., and J. P. Bielawski. 2000. Statistical methods for detecting molecular adaptation. Trends Ecol. Evol. 15:496-503. [DOI] [PMC free article] [PubMed] [Google Scholar]
- 35.Yang, Z. H., R. Nielsen, N. Goldman, and A. K. Pedersen. 2000. Codon-substitution models for heterogeneous selection pressure at amino acid sites. Genetics 155:431-449. [DOI] [PMC free article] [PubMed] [Google Scholar]