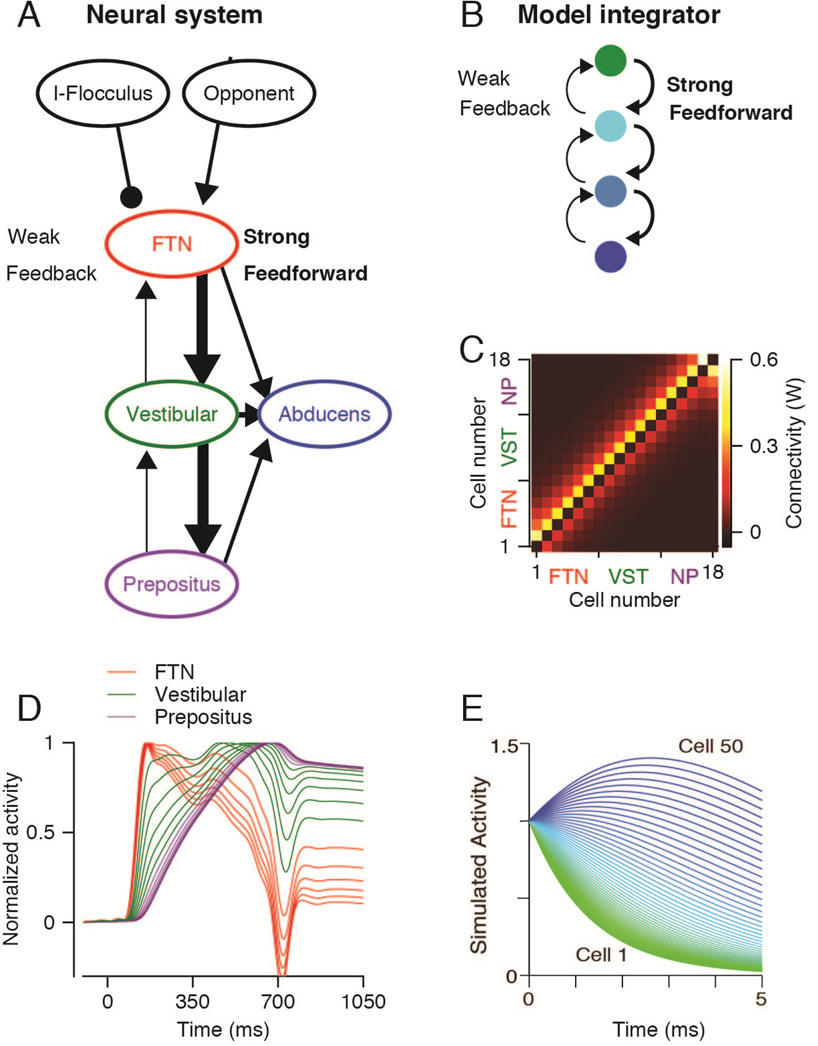
Figure 3. A network model that integrates and reproduces the time-varying firing rates of neurons in the oculomotor neural integrator of monkeys and zebrafish.
A: Schematic representation of the brainstem pursuit network as defined by recordings from functionally identified neurons in monkeys. Each ellipse represents a population of neurons, arrows are excitatory connections, and lines ending with a circle represent inhibitory connections. Thick and thin arrows indicate strong versus weak connections. B. The architecture of a neural integrator model. Each circle represents a single neuron or group of neurons, and the arrows represent connections. Each neuron is connected strongly the next neuron and weakly to the previous neuron. C: The connectivity matrix used for simulation of monkey brainstem. The colors indicate the connection weights in the connection matrix (W) between neurons for a network with stronger feed-forward versus feedback connections. D–E. Each trace shows the time-varying firing rate of an individual model neuron in the neural networks used by the two laboratories to simulate neural integration in monkey (D) and zebrafish (E). In panel D, the colors of the traces indicate the functional group assigned to the three groups of 6 neurons in the model integrator. Panels A–D are adapted with permission from Joshua et al. (2013). Panel E is adapted with permission from Miri et al. (2011).

