

Abstract
Two types of geminate structures were purified from African cassava mosaic geminivirus (ACMV)-infected Nicotiana benthamiana plants and analyzed by electron cryomicroscopy and image reconstruction. After cesium sulfate density gradient centrifugation, they were separated into lighter top (T) and heavier bottom (B) components. T particles comigrated with host proteins, whereas B particles were concentrated in a cesium density typical for complete virions. Both particles were composed of two incomplete icosahedra of 11 capsomers each, but T particles were slightly larger (diameter, 22.5 nm) and less dense in the interior than B particles (diameter, 21.5 nm). T particles were frequently associated with small globules of ∼14 nm diameter of unknown origin. The overall structure of ACMV, a begomovirus transmitted by whiteflies, was similar to that of Maize streak virus (MSV), a mastrevirus transmitted by leafhoppers, although the vertices of the icosahedra were less pronounced. Models of ACMV coat proteins based on Satellite tobacco necrosis virus support the exposure of parts of the molecule essential for transmission specificity by whiteflies and provide possible structural explanations for the smaller protrusion of the ACMV capsid relative to MSV. The differences of ACMV and MSV virion shapes are discussed with reference to their different animal vectors.
Geminiviruses are major plant pathogens in tropical and subtropical countries (21). They possess a unique capsid structure of 18 by 30 nm in diameter (24). Their circular single-stranded DNA (ssDNA) is packaged into two incomplete T1 icosahedra, which are formed by multiples of a single coat protein (CP). Early electron microscopic investigations revealed a first detailed model for Chloris striate mosaic virus (8, 9, 14), which was recently refined by electron cryomicroscopy and image reconstruction for Maize streak virus (MSV) (29). Both viruses belong to the genus Mastrevirus of the family Geminiviridae, which comprises viruses with a monopartite genome infecting monocotyledonous hosts and vectored by different species of leafhoppers (24).
In contrast, African cassava mosaic virus (ACMV) belongs to the genus Begomovirus, most members of which possess bipartite genomes, dicotyledonous hosts, and one whitefly species (Bemisia tabaci Genn.) as a vector. Transmission by insects is dependent on the CP (5, 16, 17), and therefore it is conceivable that the capsid structure might have been adapted to different receptors of the particular insects. To analyze such an interaction, detailed structural information on the capsid morphology is desirable. Therefore, electron cryomicroscopy was used in combination with image reconstruction to get more detailed structural information on ACMV in order to compare its structure with that of MSV (29).
MATERIALS AND METHODS
Purification of virus particles.
Nicotiana benthamiana plants were infected with cloned ACMV DNA, and virus particles were purified by using differential and cesium sulfate-gradient centrifugation as described in detail elsewhere (27). Virus particle-containing fractions were identified by analyzing each sample by Southern blotting and hybridization against ACMV DNA A, as well as by Western blotting with anti-ACMV CP antibodies (27). Fractions with viral ssDNA and CP were pooled, dialyzed overnight against 0.1 M sodium borate buffer (pH 8.0) at 4°C, concentrated, and washed with borate buffer in Microcon YM-10 filtration tubes according to the manufacturer's recommendations (Millipore, Bedford, Mass.). To remove residual glycerol that may interfere with cryoelectron microscopy, filtration tubes were washed with borate buffer (30 min, 14,000 × g, 4°C) prior to application of the sample. The samples were applied sequentially in 500-μl portions on the membrane, washed once with borate buffer (40 min [each spin], 14,000 × g, 4°C), and the concentrated virus particles were eluted (1 min, 1,000 × g, 4°C).
Electron microscopy and image processing. (i) Unstained samples.
Samples were frozen in a modified controlled environment freezing apparatus (3) at room temperature. Two sponges soaked in hot water were placed inside the environmental chamber of the device ensuring a humidity of nearly 100%. The sample (2 μl) was applied to grids (400 mesh copper-rhodium; Maxtaform HR26R) coated with a perforated carbon film covered with an additional thinner continuous carbon film. The additional carbon support reduced charging effects and raised the number of particles observed in the field of view. To ensure a homogeneous spread of the particle solution, the grids were treated by glow discharge in air prior to use.
For freezing the grids loaded with sample were mounted inside the chamber of the freezing device. Most of the sample was removed by blotting for 15 s with two layers of filter paper (Whatman no. 1). The grid was then plunged into liquid ethane, which was cooled by a surrounding bath of liquid nitrogen. A heating device inside the ethane pot prevented freezing of the ethane. Prepared grids were stored in liquid nitrogen until used for microscopy.
(ii) Stained samples.
Samples stained with uranyl formate and sandwiched between two layers of carbon were prepared as described in the supplement to reference 12. The grids were frozen within 10 min by dipping them into liquid nitrogen. Frozen grids were stored in liquid nitrogen until used for microscopy.
The frozen grids of the unstained sample were transferred with a Gatan Cryo-Holder 626 into a Philips CM-200-FEG equipped with a field emission gun. The microscope was operated under low dose conditions at a 200-kV accelerating voltage. Micrographs were taken on Kodak SO-163 film, at a nominal magnification of ×66,000 and with a defocus of 1.3 to 3.5 μm.
Stained samples were transferred into a CM-120-Biotwin equipped with an LaB6-filament. The microscope was operated at 100 kV. Micrographs were taken at a nominal magnification of ×52,000 and with a defocus of 200 to 800 nm. The exposed micrographs were developed for 10 min in full-strength Kodak D-19 developer at room temperature.
For image processing, suitable micrographs were scanned with a Zeiss SCAI scanner. For the unstained samples, a pixel size of 14 μm corresponding to 2.1 Å at the specimen level was chosen (stained particles were scanned with a pixel size of 21 μm, 4 Å at the specimen level). Particle images were selected interactively and were boxed off from the micrographs by using the MRC image processing programs (6). For the unstained particles, a box size for the individual particles of 220 by 220 pixels (for stained particles, 128 by 128 pixels) was used. The individual particle images were corrected for the contrast transfer function (ctf) of the microscope. In order to do this, the defocus and the astigmatism of each micrograph were determined by using the program ctffind2 of the MRC package. For correction, the particle images were first floated to an average gray value of zero and then padded with zeros to a larger box size of 756 by 756 pixels (512 by 512 pixels for stained particles). Amplitudes and phases were ctf corrected by using ctfapply, assuming a Wiener weighting factor of 0.7 and an amplitude contrast of 0.06 (0.15 for stained particles). After correction, the box size was again reduced to 220 by 220 pixels (128 by 128 for stained particles).
Further image processing was carried out by using the IMAGIC-5 software package (28). Two-by-two pixels of the ctf-corrected particle images were combined, giving a pixel size of 4.2 Å at the specimen level (for stained particles pixels were not combined). For further processing, particle images were normalized in their gray value distribution and band-pass filtered, including information between 1/9 Å−1 and 1/168 Å−1 (1/10 Å and 1/160 Å for stained particles). Further image processing was carried out as outlined in the IMAGIC-5 manual. For the three-dimensional reconstructions and the determination of the Euler-angles, a D5 symmetry was assumed. To check whether the result depended on the imposed symmetry, we did several rounds of refinement and image reconstruction (alignment, classification, sinogram correlation, and map reconstruction), assuming the lower C1 symmetry, which basically showed the same result but with less resolution.
For estimation of the resolution, two three-dimensional maps were calculated from half of the data each. Both maps were compared by Fourier-shell correlation. The resolution was estimated either according to the spatial frequency where the correlation dropped to 0.5 or to where it cut the symmetry-corrected 3σ (23) curve.
The initial band-pass filtering and the contrast transfer function of the microscope lead to an underestimation of the low-resolution amplitudes, causing dark fringes and an overestimation of the holes inside the virus particle. To compensate for this effect in the unstained particles, the amplitudes of the low spatial frequencies in the final map were scaled as described earlier (20).
Sequence and structural alignments and molecular modeling.
Standard (BLAST) and iterative (PSI-BLAST) sequence similarity searches (1) were run at the web server of the National Center for Biotechnology Information of the National Institutes of Health (http://www.ncbi.nih.gov). For multiple sequence alignment, sequences were evaluated by the CLUSTAL W (15) server at the European Bioinformatics Institute (http://www.ebi.ac.uk). The resulting alignment of geminivirus CPs was compared to the seed alignment of the profile PF00844 at the PFAM (2) server of the Sanger Institute (http://www.sanger.ac.uk). For structure predictions, we used MetaServer at http://BioInfo.pl, which derives and scores consensus predictions from the results of various primary structure prediction servers (11). Based on the consensus alignment of the ACMV CP to that of the Satellite tobacco necrosis virus (STNV), a pseudoatomic model of the ACMV CP was built with version 6.2 of the program MODELLER (25). Version 2.1 of the program Molscript (19) was used to generate the graphics in Fig. 9.
FIG.9.
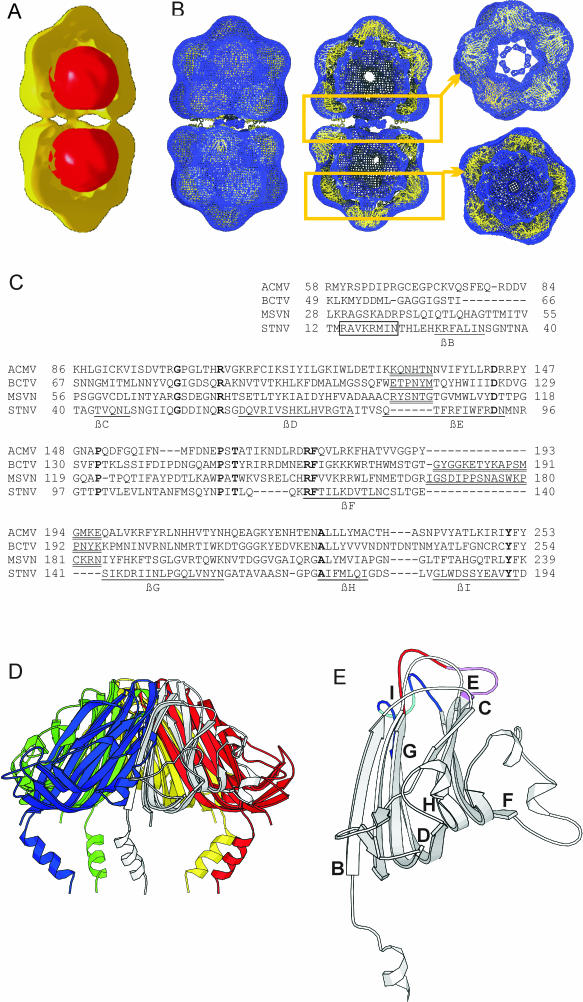
(A) Surface representation of stained ACMV particle B component (yellow) superimposed on a three-dimensional reconstruction of paired globules of the T component (red). For clarity, only half of the map of the ACMV B-component particles is shown. For calculating thethree-dimensional reconstruction of the paired globules, D5 symmetry was assumed. (B) Superposition of an ACMV model capsid generated from the atomic model of the ACMV CP with the density map derived by electron microscopy. The Cα-chain is shown in yellow and was fitted into the three-dimensional density map (blue wireframe). (Left) View from the outside; (center) slice shows the inner surface of the particle; (top right) slice of the equatorial part of the geminate particle; (bottom right) slice through the lower part of the geminate particle. (C to E) Modeling of the ACMV CP. (C) Consensus alignment of the ACMV, BCTV, MSV, and SNTV CPs compiled from a multiple sequence alignment of geminivirus CPs and structural alignments of the ACMV and MSV CPs to that of STNV. The N-terminal α-helix is boxed and major β-strands are labeled as described earlier (28) and underlined. Residues in boldface are conserved among the three proteins. Major insertions in the geminivirus proteins are double underlined. (D) Atomic structure of a pentameric capsomer of STNV (as recorded in PDB entry 2STV). (E) Model of a single ACMV CP in an orientation similar to that of the white monomer in panel C. The βD/βE loop is shown in red, with the six-residue ACMV insertion in violet. The βF/βG loop is depicted in blue, with the four-residue ACMV insertion in cyan. The start of each major β-strand was labeled as described earlier (29).
Fitting of the atomic model to the three-dimensional map.
First, an icosahedral capsid was generated by applying icosahedral symmetry to the atomic model of the ACMV CP. The same packing was assumed as in the template used for modeling the structure (STNV). Comparison of the modeled capsid and the capsid observed in the three-dimensional maps showed that the modeled capsid was 10 to 15% too small for matching the size of halve of a geminate particle. To allow for the difference in size, the atomic model of the ACMV CP was radially moved outward before we applied icosahedral symmetry, giving a capsid with a suitable diameter. For further analysis we took the 11 subunits forming the asymmetrical unit in the geminate particles (one CP from the upper capsomer and one peripentonal and one equatorial capsomer). These were rotated and translated to the correct position in the three-dimensional map. The position of the equatorial capsomer was slightly adjusted by tilting it slightly around its pseudo fivefold axis. This moved the top of the capsomer closer to the equator. The complete geminate particle was then generated from this unit by applying D5 symmetry.
RESULTS AND DISCUSSION
ACMV was purified by differential and isopycnic density gradient centrifugation in cesium salts. All of the gradient fractions were analyzed by Southern blotting and hybridization against viral probes (Fig. 1), as well as by Western blotting and anti-CP antibody detection (see references 27). As expected, most viral ssDNA and CP accumulated in fractions with a density of ca. 1.30 g/cm3 (Fig. 1), referred to as the bottom pool (B). Moreover, some of these materials accumulated in fractions where most of the copurified host proteins usually band, at a density of 1.23 g/cm3 (Fig. 1), referred to as top pool (T). Both pools were freed from cesium salts and analyzed by conventional electron microscopy by using negative stain or by electron cryomicroscopy with or without staining.
FIG. 1.
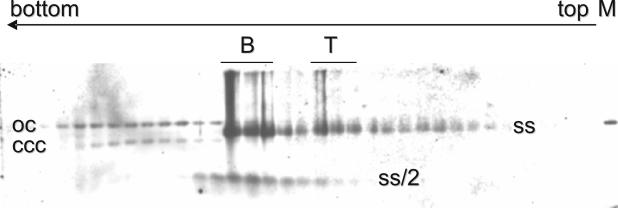
Southern blot analysis of all fractions of an isopycnic cesium sulfate gradient after centrifugation, with increasing densities from right (top) to left (bottom). Viral chromatin, including open circular (oc) and covalently closed (ccc) double-stranded DNA, is well separated from viral twin particles and solitary particles containing either genomic (ss) or subgenomic (ss/2) ssDNA. Fractions pooled for electron microscopy are indicated for the bottom pool (B) and the top pool (T). Marker (M) was linearized full-length ACMV DNA A (100 pg).
Particles from both pools spread evenly across the carbon layer (Fig. 2; see also Fig. 6) and had a bipartite shape with two parts of equal size separated by a gap. The B pool contained mostly geminate particles with some contaminating viral minichromosomes. From 47 micrographs, such as the one shown in Fig. 2, a total of 5,530 individual particle images were selected. These images were aligned in respect to each other and classified according to their similarity by using IMAGIC 5. Typical class averages are shown in Fig. 3. The class averages show particles that vary in their length but have roughly the same diameter. This variation in length is caused by different orientations of the particles rather than by variations in the shapes of the particles themselves.
FIG. 2.
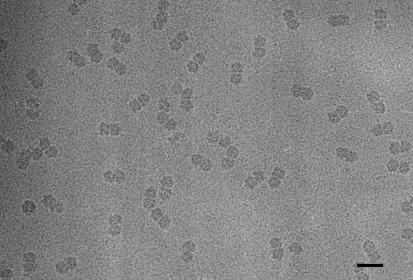
Electron micrograph of unstained, frozen hydrated ACMV particles. Particles appear as dark bipartite structures. Bar, 50 nm.
FIG. 6.
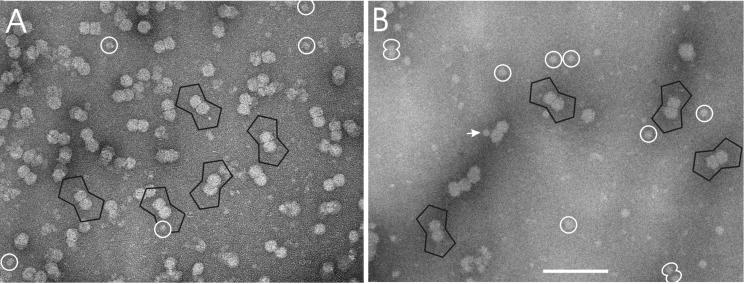
Micrographs of negatively stained, frozen ACMV B component (A) and T component (B). Some ACMV particles are lined with a black frame. In the T component small globules appeared frequently (white circles), which were sometimes paired or were attached to ACMV particles (white arrow). Bar, 100 nm.
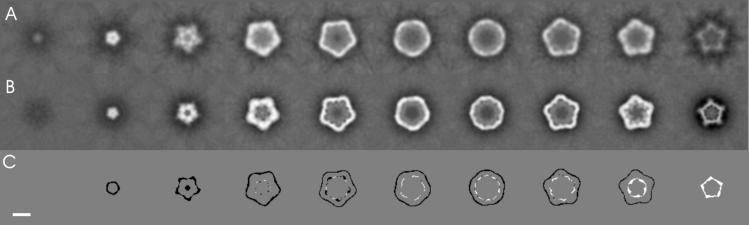
FIG. 3.
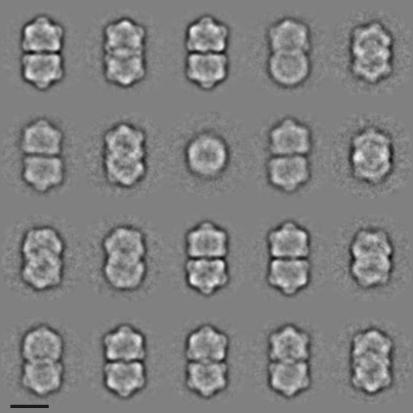
Two-dimensional projection maps of ACMV particles. Aligned particle images were sorted according to their similarity and divided into 20 classes. Class members were averaged and are shown above. Bar, 20 nm.
For calculation of the three-dimensional map, the data was divided into 300 classes and the class averages were calculated. For each of the class averages the relative spatial orientation was determined by sinogram correlation and assuming D5 symmetry, the same symmetry that was observed for the MSV (29). To confirm the chosen symmetry, particle orientations and a three-dimensional map were also determined, assuming the lower C1 symmetry. The same packing of capsomers was observed justifying the choice of the D5 symmetry (data not shown). The orientations of the class averages covered the asymmetric unit evenly (Fig. 4), which is a prerequisite for an isotropic resolution. The final map included 250 of the 300 class averages, excluding mainly classes with a smaller number of members and thus being noisier. The Fourier shell correlation dropped to 0.5 at 1/19 Å−1 and cut the symmetry-corrected 3 σ-curve (23) at 1/16 Å−1. Accordingly, the resolution of the final map was estimated to be between 16 and 19 Å. Surface representations and three orthogonal slices through the center of the map are shown in Fig. 5. The diameter of the ACMV capsid was 22 nm, as found for MSV (29).
FIG. 4.
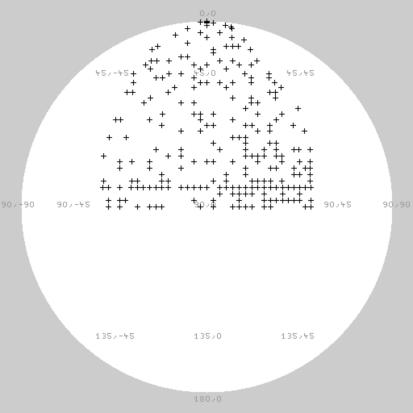
Spatial distribution of Euler angles in the asymmetric unit. Each “+” symbol corresponds to the orientation determined for an observed class average. Only the out-of-plane rotational angles are shown.
FIG. 5.
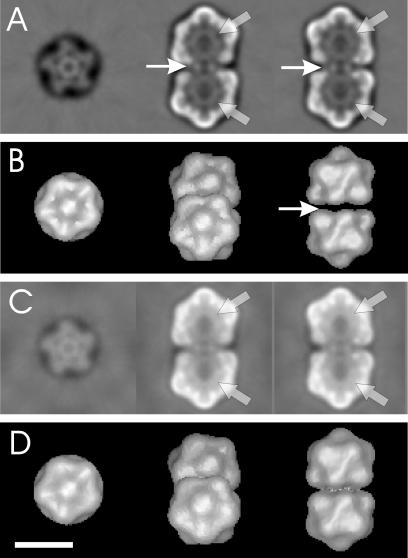
Representations of the three-dimensional map calculated from unstained, frozen hydrated ACMV particles. (A and C) Three orthogonal slices of the three-dimensional map; (B and D) three different views of the surface representation of the three-dimensional map. In panels C and D, low-resolution amplitudes were scaled to minimize negative densities. Thin arrows indicate low density in the connecting region, which leads to discontinuity in the surface representation. After appropriate amplitude scaling, the discontinuity disappears. Thick arrows mark the core density inside the capsids. Bar, 20 nm.
In the slices, the particle showed a high-density outer shell that surrounded a lower-density core structure. The shell was organized into lower and upper halves with a connecting region of lower density in between (Fig. 5A and B, thin arrows). This region did not show in surface representation and, therefore, the two parts of the virus appeared to be disconnected. We think that underestimation of the amplitudes of the data at low spatial frequencies caused this discontinuity. The dampening of the amplitudes at low spatial frequencies is caused by the high-pass filter applied during image processing and the uncorrected amplitude modulation introduced by the contrast transfer function of the electron microscope. If the amplitudes at low spatial frequencies were scaled to minimize negative densities in the map as described previously (20), the connection between the two parts and some density inside the particles became visible (Fig. 5C and D). A comparable density distribution was observed (not shown) when three-dimensional maps were calculated with frealign (13), which scales amplitudes according to the modulation of the contrast transfer function and does not apply high-pass filters. This emphasized the validity of our scaling approach.
The density inside the particle (core density) was now much more visible and appeared as ring-like structures in the slices (Fig. 5A and C, wide arrows) or as spherical densities that filled each of the incomplete icosahedra in three-dimensional maps. The core density had a dense outer rim and was less solid in its center. The outer rim lined the inner surface of the protein shell of the capsids. It is plausible that the core density accounts for the DNA of ACMV. A similar core density with an outer ring lining the inner surface of the outer shell is observed in surface representations of MSV (29).
As already shown for MSV (29) and in contrast to the earlier model for Chloris striate mosaic virus (14), the halves of the geminate particles are twisted to each other by 20° such that the capsomers of one half point into the gap between two capsomers of the other half.
To compare the T- and B-pool particles, negatively stained samples were investigated with an cryoelectron microscope (Fig. 6). The staining approach was chosen because the T component tended to aggregate and was too dilute for conventional cryoelectron microscopy. Similar to the unstained sample (Fig. 2), the negatively stained B component showed an even spread of ACMV twin particles with few smaller globules in the background (Fig. 6A). The T component had fewer ACMV particles, to which frequently globules were attached (Fig. 6B, arrow), with various positions at the outer surface of the twin capsids. In the background, similar globules with a diameter of 14 ± 2 nm were observed, which occasionally appear in pairs (Fig. 6B, white double circles). The distance between the centers of these globules was equal to the distance of the centers of the two incomplete icosahedra forming the ACMV twin particles (16.5 nm).
For further comparison of T and B ACMV particles, three-dimensional image reconstructions were calculated by using IMAGIC-5 as outlined above. Surface representations of the image reconstructions are shown in Fig. 7. Although T (Fig. 7A) and B (Fig. 7B) particles looked very similar in their overall architecture, the T component was slightly larger (4% larger in diameter). This became even more evident when slices through the density of the maps were compared. These slices extended further for the T component (Fig. 8A) than for the B component (Fig. 8B). For difference imaging, the maps were made binary by setting all gray values above a certain threshold to 1 and setting all below this threshold to 0. The difference between the binary maps (Fig. 8C) revealed differences either as black densities when only the T component was present or as white densities when only the B component was present. The difference image showed black fringes at the outer surface of the particle and white fringes at the inner surface. Both white and black fringes had similar widths, which was indicative of a swelling of the T-component particles with respect to the B-component particles without significant alteration in the thickness of the protein shells.
FIG. 7.
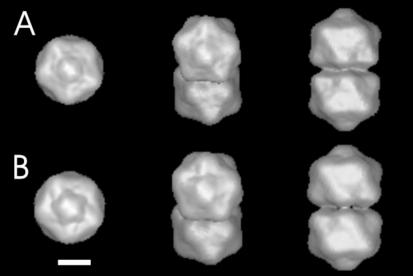
Surface representation of the stained ACMV particles of the B component (A) and T component (B). The left column shows fivefold views; the right column shows twofold views. The central column shows views straight onto one of the capsomers flanking the capsomer at the fivefold axis.
FIG. 8.
Slices of the three-dimensional map of stained ACMV particles. (A) T component; (B) B component. Slices are 4 Å thick and are spaced by 20 Å. For difference imaging, the maps were normalized in their gray values and were binarized by using the same threshold value. Binarizing set all gray values above the chosen threshold to 1 and below the threshold to 0. The binary maps were subtracted (B component minus T component). The resulting difference map is shown in panel C. Where both binary maps matched, the difference was 0 (gray). Additional density in the T component appeared black, whereas additional density of the B component was white. Bar, 10 nm.
The nature of the smaller globules of the T component (Fig. 5B) is still unclear. Since they had a diameter similar to that of the core densities inside ACMV and in pairs had the same center-to-center distance as the core density, we thought that globules and twin particles might be related. To test this hypothesis, we calculated three-dimensional maps of the paired globules assuming the same D5 symmetry that was applied to the core density during virus reconstruction. If the paired globules and the core density inside the capsids of the B component were related, this approach should result in a comparable three-dimensional reconstruction, independent of whether the chosen symmetry was correct. A superposition of such a reconstruction (Fig. 9A, red) with the reconstruction of the B capsid particles (Fig. 9A, yellow) showed that the paired globules fitted neatly into the capsid of ACMV similar to the core density. This observation was rather persuasive evidence that the paired globules had the same nature as the core density, which we thought was the ACMV DNA. If these assumptions were correct, the DNA must be able to fold into a defined structure with two spherical domains, which is stable and self-maintaining independent of the surrounding capsid protein. Whether or not other protein components are part of these structures is unknown.
In contrast to first intuition caused by the coincidence of twin capsids and bipartite genomes, only one molecule of DNA A (930 kDa) or DNA B (910 kDa) is thought to fill up one twin particle formed by 110 proteins (30.2 kDa), since ACM virions contain 22% nucleic acids (4). Solitary globules may, therefore, represent subgenomic fragments of DNA A or DNA B present in the bottom as well as in the top pool (Fig. 1, ss/2). This class of viral DNAs has been identified as defective-interfering DNA (26) and is packaged into solitary particles (10).
Whereas MSV has been prepared for structural analysis in buffer with pH 4.8 (29), we used pH 8.0, assuming that this condition is closer to the milieu of phloem (30) and plant-feeding insect saliva (7). Nevertheless, the overall structure is very similar, emphasizing that the geminate configuration is stable at different pHs. Minor difference in structural details, however, between the model created here and that of Zhang et al. (29) might therefore be attributed to the buffer conditions. One of the obvious structural differences is in the size of the capsomers, which protrude less from the shell in ACMV.
To account for this deviation, we analyzed an alignment of the ACMV and MSV CPs and obtained structural predictions for both proteins (Fig. 9C). The two CPs have diverged considerably, which precluded a direct alignment. However, iterative sequence searches (1) produced pairwise alignments of these two proteins with about 500 geminivirus CPs. No related sequence of known structure was found. A multiple sequence alignment of a selected number of sufficiently divergent sequences indicated that the latter three quarters of the illustrated alignment of the ACMV and MSV CPs are reliable. Interestingly, an essentially identical multiple sequence alignment has been used to construct a sequence profile for geminivirus CPs (PFAM profile PF00844). We then submitted the two sequences to the Structure Prediction MetaServer (11), which in both cases yielded the structure of STNV CP (PDB entry 2STV, Fig. 9C) as the only template for structural modeling with a significant score (80.29 and 57.50 for the ACMV and MSV sequences, respectively). The observation that these divergent sequences that could only be aligned in iterative sequence searches nevertheless yielded the same unique template adds to the validity of the hit.
Notably, the same structure had already been proposed as a suitable template for the MSV structure (29). For both proteins, several highly similar alignments to the STNV CP were suggested with a few variations concentrated in the loops between the main secondary structure elements. These structural alignments of the ACMV and MSV sequences with that of the STNV CP essentially agreed with the multiple sequence-based alignment of the geminivirus sequences with the exception of the N-terminal helix and the first beta-strand. This agreement lends additional weight to the structure prediction. The added sequence and structure information accounts for the deviations of our alignment from the pairwise alignment of Zhang et al. (29).
The resulting structural model (Fig. 9E) points to two interesting regions of insertion that are located near the tip of the capsomer. The six-residue insertion in the geminivirus βD/βE-loop (Fig. 9E, red loop) has been identified as essential for controlling whitefly transmission (17, 18, 22). Its predicted exposed position would be compatible with such a role. The additional 14 residues in the βF/βG-loop of the MSV CP, on the other hand, may well explain why the MSV capsomer protrudes more from the shell than the ACMV capsomer (Fig. 9E, blue loop). The insertion might be a special adaptation to leafhopper transmission. To evaluate this interesting hypothesis, we included the CP sequence of Beet curly top virus (BCTV) in the alignment (Fig. 9C) after structural alignment to STNV. BCTV infects dicotyledonous hosts as ACMV but is vectored by leafhoppers as MSV. Indeed, a similar insertion in the βF/βG-loop was predicted for BCTV.
An atomic model of the ACMV capsid was generated as described in Materials and Methods. In comparison to STNV the CP had to be moved to larger radii to generate a capsid of proper size and to avoid clashes between the subunits in the capsomers. As a reference point for expansion, the Cα-Atom of Lys 175 was used, which is located at the peripheral base of the capsomers. The radial translation was 10 Å compared to a translation of 31 Å in MSV (29). Expansion in the chosen direction also led to an increase in the diameter of the capsomers, which removed the steric clashes between the subunits in the capsomers. The modeled capsomers matched the observed density well (Fig. 9B). Only the N-terminal helices of the CPs, which point toward the center of the incomplete icosahedra, projected out of the density. On the other hand, there is unaccounted density between the capsomers, which could accommodate the N-terminal region. This would require a different intercapsomer interaction than observed in STNV. As mentioned above, for the N-terminal part STNV is not a suitable structural template. Therefore, it is conceivable that in ACMV other than in STNV the N-terminal part could mediate the intercapsomer contact similar to that proposed for MSV (29). However, because there are not sufficient data available on which the fold and the proposed interaction of the first 58 amino acids could be modeled, we left the position of the helices unaltered.
In summary, we have shown that, although ACMV resembles MSV in its overall shape, there are key differences that possibly account for the alternative transmission mode. The results provide valuable information for design mutagenesis experiments to unravel the interaction of geminiviruses with their particular insect vectors.
Acknowledgments
We thank John Stanley, Norwich, United Kingdom, for kindly providing infectious clones of ACMV, and Werner Preiss for excellent technical assistance.
H.C. is a postdoctoral fellow of the Fund for Scientific Research-Flanders. This study was supported by a grant from the Deutsche Forschungsgemeinschaft (Je 116/8-5).
REFERENCES
- 1.Altschul, S. F., T. L. Madden, A. A. Schäffer, J. Zhang, Z. Zhang, W. Miller, and D. J. Lipman. 1997. Gapped BLAST and PSI-BLAST: a new generation of protein database search programs. Nucleic Acids Res. 25:3389-3402. [DOI] [PMC free article] [PubMed] [Google Scholar]
- 2.Bateman, A., E. Birney, L. Cerruti, R. Durbin, L. Etwiller, S. R. Eddy, S. Griffiths-Jones, K. L. Howe, M. Marshall, and E. L. Sonnhammer. 2002. The PFAM protein families database. Nucleic Acids Res. 30:276-280. [DOI] [PMC free article] [PubMed] [Google Scholar]
- 3.Bellare, J. R., H. T. Davis, L. E. Scriven, and Y. Talmon. 1988. Controlled environment vitrification system: an improved sample preparation technique. J. Electron. Microsc. Tech. 10:87-111. [DOI] [PubMed] [Google Scholar]
- 4.Bock, K. R., and B. D. Harrison. 1985. African cassava mosaic virus. AAB Descr. Plant Viruses 297:1-8. [Google Scholar]
- 5.Briddon, R. W., M. S. Pinner, J. Stanley, and P. G. Markham. 1990. Geminivirus coat protein gene replacement alters insect specificity. Virology 177:85-94. [DOI] [PubMed] [Google Scholar]
- 6.Crowther, R. A., R. Henderson, and J. M. Smith. 1996. MRC image processing programs. J. Struct. Biol. 116:9-16. [DOI] [PubMed] [Google Scholar]
- 7.Fife, J. M., and V. L. Frampton. 1936. The pH gradient extending from the phloem into the parenchyma of the sugar beet and its relation to the feeding behavior of Eutettix tenellus. J. Agric. Res. 53:581-593. [Google Scholar]
- 8.Francki, R. I. B., T. Hatta, G. Boccardo, and J. W. Randles. 1980. The composition of chloris striate mosaic virus, a geminivirus. Virology 101:233-241. [DOI] [PubMed] [Google Scholar]
- 9.Francki, R. I. B., T. Hatta, N. E. Grylls, and C. J. Grivell. 1979. The particle morphology and some other properties of chloris striate mosaic virus. Ann. Appl. Biol. 91:51-59. [Google Scholar]
- 10.Frischmuth, T., M. Ringel, and C. Kocher. 2001. The size of encapsidated single-stranded DNA determines the multiplicity of African cassava mosaic virus particles. J. Gen. Virol. 82:673-676. [DOI] [PubMed] [Google Scholar]
- 11.Ginalski, K., A. Elofsson, D. Fischer, and L. Rychlewski. 2003. 3D-Jury: a simple approach to improve protein structure predictions. Bioinformatics 19:1015-1018. [DOI] [PubMed] [Google Scholar]
- 12.Golas, M. M., B. Sander, C. L. Will, R. Luhrmann, and H. Stark. 2003. Molecular architecture of the multiprotein splicing factor SF3b. Science 300:980-984. [DOI] [PubMed] [Google Scholar]
- 13.Grigorieff, N. 1998. Three-dimensional structure of bovine NADH:ubiquinone oxidoreductase (complex I) at 22 Å in ice. J. Mol. Biol. 277:1033-1046. [DOI] [PubMed] [Google Scholar]
- 14.Hatta, T., and R. J. B. Francki. 1979. The fine structure of chloris striate mosaic virus. Virology 92:428-435. [DOI] [PubMed] [Google Scholar]
- 15.Higgins, D., J. Thompson, T. Gibson, J. D. Thompson, D. G. Higgins, and T. J. Gibson. 1994. CLUSTAL W: improving the sensitivity of progressive multiple sequence alignment through sequence weighting, position-specific gap penalties and weight matrix choice. Nucleic Acids Res. 22:4673-4680. [DOI] [PMC free article] [PubMed] [Google Scholar]
- 16.Höfer, P., I. D. Bedford, P. G. Markham, H. Jeske, and T. Frischmuth. 1997. Coat protein gene replacement results in whitefly transmission of an insect nontransmissible geminivirus isolate. Virology 236:288-295. [DOI] [PubMed] [Google Scholar]
- 17.Höhnle, M., P. Höfer, I. D. Bedford, R. W. Briddon, P. G. Markham, and T. Frischmuth. 2001. Exchange of three amino acids in the coat protein results in efficient whitefly transmission of a nontransmissible Abutilon mosaic virus isolate. Virology 290:164-171. [DOI] [PubMed] [Google Scholar]
- 18.Kheyr-Pour, A., K. Bananej, G. A. Dafalla, P. Caciagli, E. Noris, A. Ahoonmanesh, H. Lecoq, and B. Gronenborn. 2000. Watermelon chlorotic stunt virus from the Sudan and Iran: sequence comparison and identification of a whitefly transmission determinant. Phytopathology 90:629-635. [DOI] [PubMed] [Google Scholar]
- 19.Kraulis, P. J. 1991. MOLSCRIPT: a program to produce both detailed and schematic plots of protein structures. J. Appl. Crystallogr. 24:946-950. [Google Scholar]
- 20.Mellwig, C., and B. Böttcher. 2003. A unique resting position of the ATP-synthase from chloroplasts. J. Biol. Chem. 278:18544-18549. [DOI] [PubMed] [Google Scholar]
- 21.Moffat, A. 1999. Geminiviruses emerge as serious crop threat. Science 286:1835.
- 22.Noris, E., A. M. Vaira, P. Caciagli, V. Masenga, B. Gronenborn, and G. P. Accotto. 1998. Amino acids in the capsid protein of tomato yellow leaf curl virus that are crucial for systemic infection, particle formation, and insect transmission. J. Virol. 72:10050-10057. [DOI] [PMC free article] [PubMed] [Google Scholar]
- 23.Orlova, E. V., P. Dube, J. R. Harris, E. Beckman, F. Zemlin, J. Markl, and M. van Heel. 1997. Structure of keyhole limpet hemocyanin type 1 (KLH1) at 15 Å resolution by electron cryomicroscopy and angular reconstitution. J. Mol. Biol. 271:417-437. [DOI] [PubMed] [Google Scholar]
- 24.Rybicki, E. P., R. W. Briddon, J. K. Brown, C. M. Fauquet, D. P. Maxwell, B. D. Harrison, P. G. Markham, D. M. Bisaro, D. Robinson, and J. Stanley. 2000. Family Geminiviridae, p. 285-297. In M. H. V. van Regenmortel, C. M. Fauquet, and D. H. L. Bishop (ed.), Virus taxonomy: classification and nomenclature of viruses. Academic Press, Inc., San Diego, Calif.
- 25.Sali, A., and T. L. Blundell. 1993. Comparative protein modeling by satisfaction of spatial restraints. J. Mol. Biol. 234:779-815. [DOI] [PubMed] [Google Scholar]
- 26.Stanley, J., T. Frischmuth, and S. Ellwood. 1990. Defective viral DNA ameliorates symptoms of geminivirus infection in transgenic plants. Proc. Natl. Acad. Sci. USA 87:6291-6295. [DOI] [PMC free article] [PubMed] [Google Scholar]
- 27.Unseld, S., T. Frischmuth, and H. Jeske. Short deletions in nuclear targeting sequences of African cassava mosaic virus coat protein prevent geminivirus twinned particle formation. Virology 318:89-100. [DOI] [PubMed]
- 28.van Heel, M., G. Harauz, E. V. Orlova, R. Schmidt, and M. Schatz. 1996. A new generation of the IMAGIC image processing system. J. Struct. Biol. 116:17-24. [DOI] [PubMed] [Google Scholar]
- 29.Zhang, W., N. H. Olson, T. S. Baker, L. Faulkner, M. Agbandje-McKenna, M. Boulton, J. W. Davies, and R. McKenna. 2001. Structure of the maize streak virus geminate particle. Virology 279:471-477. [DOI] [PubMed] [Google Scholar]
- 30.Ziegler, H. 1975. Nature of transported substances, p. 59-100. In M. H. Zimmermann and J. A. Milburn (ed.), Phloem transport, vol. 1. Springer, Berlin, Germany.