

Abstract
Biological systems remain robust against certain genetic and environmental challenges. Robustness allows the exploration of ecological adaptations. It is unclear what factors contribute to increasing robustness. Gene duplication has been considered to increase genetic robustness through functional redundancy, accelerating the evolution of novel functions. However, recent findings have questioned the link between duplication and robustness. In particular, it remains elusive whether ancient duplicates still bear potential for innovation through preserved redundancy and robustness. Here we have investigated this question by evolving the yeast Saccharomyces cerevisiae for 2200 generations under conditions allowing the accumulation of deleterious mutations, and we put mechanisms of mutational robustness to a test. S. cerevisiae declined in fitness along the evolution experiment, but this decline decelerated in later passages, suggesting functional compensation of mutated genes. We resequenced 28 genomes from experimentally evolved S. cerevisiae lines and found more mutations in duplicates—mainly small-scale duplicates—than in singletons. Genetically interacting duplicates evolved similarly and fixed more amino acid–replacing mutations than expected. Regulatory robustness of the duplicates was supported by a larger enrichment for mutations at the promoters of duplicates than at those of singletons. Analyses of yeast gene expression conditions showed a larger variation in the duplicates’ expression than that of singletons under a range of stress conditions, sparking the idea that regulatory robustness allowed a wider range of phenotypic responses to environmental stresses, hence faster adaptations. Our data support the persistence of genetic and regulatory robustness in ancient duplicates and its role in adaptations to stresses.
Biological systems are inherently robust to perturbations, maintaining the same phenotypes in the face of environmental and genetic challenges (Gu et al. 2003; Stelling et al. 2004; Wagner 2005b). Robustness is key to the emergence of biological complexity and diversification as more robust systems can explore a larger set of phenotypes, allowing greater potential for evolving novel adaptations (Draghi et al. 2010; Payne and Wagner 2014). Determining the factors that provide systems with robustness would pave the way for a more complete understanding of the origin of adaptations and biological complexity. However, despite major efforts in understanding robustness (Wagner 2012), the factors that increase robustness of biological systems and their characterization remain to be determined.
Gene duplication has been considered to have a major role in genetic robustness (Lynch and Conery 2000), as the presence of two copies performing identical or overlapping functions confers immunity to the deleterious effects of mutations occurring in one of the gene copies. Additionally, gene duplication has been credited with great importance in generating evolutionary novelties (Ohno 1999) because the selection-free exploration of the genotype space, due to genetic redundancy, allows one gene copy to probe a wider range of phenotypes (Payne and Wagner 2014). Arguably, gene duplication provides an invaluable opportunity to explore the link between genetic robustness and evolvability. Indeed, a number of studies have shown that major gene duplication events, such as whole-genome duplication (WGD) in angiosperms (Wendel 2000; Blanc and Wolfe 2004a) and animals (Otto and Whitton 2000; Hoegg et al. 2004), are concomitant with the emergence of morphological, metabolic, and physiological innovations (Otto and Whitton 2000; Holub 2001; Lespinet et al. 2002; Hoegg et al. 2004; Kim et al. 2004; Maere et al. 2005).
Despite the apparent causal link between gene duplication and evolutionary innovation, the neutral exploration of genotype space by a duplicated gene requires the persistence of both gene copies for long periods. This clashes with the evolutionary instability of genetic redundancy, illustrated by the fact that 92% of duplicates in Saccharomyces cerevisiae, originated through WGD roughly 100 million years ago (Mya) (Wolfe and Shields 1997), have returned to single gene copies in extant S. cerevisiae. The rate of preservation of genes in duplicate varies, however, among organisms, with some exhibiting up to 30% of their genes in duplicate (Blanc and Wolfe 2004b; Cui et al. 2006). Genetic robustness, along with other factors such as selection for increasing gene dosage (Conant and Wolfe 2008) and gene balance (Birchler et al. 2005; Freeling and Thomas 2006), has been proposed to allow the persistence of genes in duplicate for longer periods of time, thereby providing opportunity for innovation through mutation (Gu et al. 2003; Fares et al. 2013). This claim is supported by larger fitness effects associated with the deletion of singletons compared to duplicates in yeast (Gu et al. 2003), functional compensation of deleted gene copies (VanderSluis et al. 2010), higher robustness of duplicates to transient gene knockdowns in Caenorhabditis elegans (Conant and Wagner 2004), and the contribution of gene duplicates to provide functional back-up against deleterious human mutations (Hsiao and Vitkup 2008). Recent studies have challenged, however, the link between gene duplication and genetic robustness, revealing a more complex relationship between duplicate preservation, genetic redundancy, and robustness. For example, using synthetic lethality genetic maps, Ihmels et al. (2007) found that duplicates, although exhibiting functional compensation, account for only 25% of the mutational robustness of a system. Furthermore, Wagner (2000) analyzed a number of duplicated genes and found no evidence of compensatory effects for null mutations between gene copies with high sequence or expression similarities. Moreover, a recent study has shown that in natural populations of yeast, close duplicates are unlikely to provide substantial functional compensation (Plata and Vitkup 2013). Thus, it is unresolved whether gene duplication provides mutational robustness through genetic redundancy. Since genetic redundancy and robustness are directly linked to evolvability, finding whether or not gene duplication provides sufficient genetic robustness to overcome the energetic and metabolic cost of maintaining additional genetic material is crucial to link gene duplication with the evolution of novel traits. Also, finding appreciable genetic redundancy between the copies of ancient duplicates would support their potential for future biological innovations.
The studies conducted so far to probe the link between gene duplication, genetic redundancy, and mutational robustness have been obscured by the complex mixture of the genomic signatures of natural selection and genetic drift. These mixed signatures make it difficult to disentangle the role of genetic redundancy and mutational robustness in the emergence of novel functions from that of selection favoring adaptive mutations. Moreover, most studies ignore the role of the mechanism of duplication, WGD versus small-scale duplication (SSD), in providing mutational robustness and thus opportunity for innovation (Carretero-Paulet and Fares 2012; Fares et al. 2013). It is expected that the present genetic robustness and incomplete functional compensation of today’s duplicates are the remainders of an ancient larger genetic robustness that emerged at the time of gene duplication. Owing to the functional diversification of duplicates, quantification of preserved genetic robustness is complex and requires a direct test of the robustness of current, long-term preserved duplicates to deleterious mutations. Therefore, a definitive resolution of the controversy of whether ancient gene duplicates provide genetic robustness must come from testing the impact of deleterious mutations on duplicates in comparison with singletons. In this study, we resolved the controversy by conducting an experiment that allows the accumulation of deleterious mutations in the genome of S. cerevisiae. Using experimental evolution allows disentangling adaptive mutations from deleterious and neutral mutations and testing hypotheses under tightly controlled experimental conditions, which are not possible in comparative genomics studies. We test, for the first time, whether duplicates tolerate more deleterious mutations in their coding and regulatory regions than expected under the assumption of no genetic robustness.
Results
The deleterious mutational spectrum of experimentally evolved lines of S. cerevisiae
Starting from a single colony, five S. cerevisiae msh2-deficient haploid lineages were created (see Methods). Each line was passaged on YPD media, by restreaking a single colony every 48–72 h, for approximately 2200 generations of S. cerevisiae (Fig. 1). Twenty-eight genomes, including the ancestral genome and three to six genomes per evolved line, were resequenced (Supplemental Tables S1–S5). Single nucleotide polymorphisms (SNPs) and insertions and deletions (indels) that arose in the evolved lines were detected by subtracting them from those in the ancestral genome. Across all five experimentally evolving lines, we identified a total of 430 nonsynonymous SNPs (NSNPs) affecting 412 genes (171 affecting 160 duplicates and 259 affecting 252 singletons; Fig. 2A), 179 synonymous SNPs (SSNPs, 70 affecting 67 duplicates and 109 in 108 singletons), 527 insertions and deletions (indels: 163 affecting duplicates and 364 affecting singletons), and 2720 mutations (including SNPs and indels) in intergenic regions. A region of 600 bp upstream of the transcription start site was also examined to identify SNPs in regulatory gene regions, and 2385 mutations (including SNPs and indels) were identified, of which 1415 mutations fell upstream of 860 singleton genes and 970 mutations upstream of 598 genes in duplicate (Fig. 2B). Most indels in coding regions fell within homopolymeric and repetitive regions; hence we focused on SNPs and not indels when studying coding genes.
Figure 1.

The evolution experiment of the Saccharomyces cerevisiae haploid Δmsh2 strain. We started five independent evolution experiments from a single ancestral colony. Every 48 h, we randomly picked one colony and transferred it to another plate. The experiment involved 100 passages, corresponding to roughly 2200 generations (G) of S. cerevisiae. Single colonies were isolated for genome sequencing at passages 20, 30, 50, 70, 90, and 100, and growth was assayed at those time points of the experiment. Every 10 passages, a single colony was frozen at −80°C, obtaining a yeast fossil record.
Figure 2.

Genome-wide distribution of single nucleotide polymorphisms (SNPs) along the experimental evolution of Saccharomyces cerevisiae in singletons (blue vertical lines) and duplicates (red vertical lines). (A) Distribution of nonsynonymous SNPs (NSNPs) in protein coding regions of singletons and duplicates in the 16 S. cerevisiae chromosomes (chromosomes I to XVI). (B) Distribution of SNPs in the promoter regions of singletons and duplicates. Yellow circles refer to the chromosomal centromere. We also represent mutations in mitochondria (Mit).
Since the transfer of populations of evolving yeast was clonal (e.g., new generations were propagated from a single ancestral colony), mutations in early generations were identified within the set of mutations in later generations. This increase in mutational load and the strong genetic drift effect mostly allow the accumulation of deleterious nonlethal mutations, although some fixed mutations were very likely neutral as well. Indeed, the fitness of the strains declined with the generation time (Fig. 3). Importantly, while the rate of fitness decline decreased around passage 50 (Fig. 4), the fixation of NSNPs and SSNPs continued increasing linearly after passage 50 (Fig. 4, inner plot). The contrasting patterns of fitness decline and mutation accumulation (MA) dynamics suggest the fixation of compensatory mutations buffering the effects of deleterious mutations, either through intragene molecular interactions or by functional compensation between functionally related genes. It is noteworthy that some of the experimentally evolving lines recovered fitness after passage 70, after which the slope of the growth curve became positive (Fig. 4). The general fitness decline trend was not equivalent for all evolution lines, with appreciable differences among these lines during the exponential growth phase and diauxic shift (Fig. 3). Such differences reflect the influence of early mutations on the growth rates of the evolution lines and the subsequent ability of compensatory mutations to overcome these growth defects.
Figure 3.

Saccharomyces cerevisiae fitness declines along the evolution experiment. We represent the growth curves for six isolated colonies at different passages (p20, p30, p50, p70, p90, and p100) for each of the five independently evolved lines of S. cerevisiae (MA1 to MA5). Growth was measured using absorbance at 600 nm.
Figure 4.

Saccharomyces cerevisiae declines in fitness in the first passages of its evolution and recovers fitness in the later passages. We show the deceleration in the rate of growth decline as the experimental evolution proceeds. We took the logarithm of the optic density measured in stationary phase for cells isolated at different passage points of the experiment. Each dot is the median of four different growth curves. (Inset) Dynamic of accumulation of synonymous and nonsynonymous SNPs (SSNPs and NSNPs, respectively), across the experiment for the six passage points averaged for all five experimentally evolving lineages.
Gene duplicates are more enriched for NSNPs than singletons
We tested whether duplicates in the five experimentally evolving lines of S. cerevisiae accumulated more NSNPs than did singletons. As most NSNPs are expected to be deleterious, duplicates’ enrichment for NSNPs would support their higher tolerance to such mutations compared to singletons. Since each duplicated gene has two copies that are functionally overlapping to a larger or lesser extent (i.e., they are not independent as singletons are), we analyzed the distribution of NSNPs among duplicates in two ways: by randomly sampling a copy of a gene pair with NSNPs and testing the duplicates’ enrichment for NSNPs or by considering each gene copy an independent gene.
Random sampling yielded 95 duplicated genes out of the 1120 pairs with a NSNP, a number pointing to enrichment of duplicates with NSNPs when compared to singletons (Fisher’s exact test: odds ratio F = 1.59, P = 3.56 × 10⁻⁴). In the second analysis we considered all genes in duplicate as independent genes (e.g., 2240 genes and not 1120 duplicate pairs). Of the 430 NSNPs, 171 affected 160 duplicated genes (7.14% of all duplicates) and 259 affected 252 singletons (5.50% of singleton genes) (Fig. 5A). Duplicates were significantly more enriched for NSNPs compared to singletons (Fisher’s exact test: F = 1.32, P = 9.31 × 10⁻³). Of all the mutated genes, only 17 encode ribosomal proteins, of which six were duplicated and 11 were singletons, with no significant difference between these two data sets (Fisher’s exact test: F = 0.88, P = 1). Removal of ribosomal proteins from our data sets had no effect on the results. We examined the distribution of NSNPs in evolutionarily conserved nonsynonymous sites. The rate of NSNP per site was larger for duplicates (6.84 × 10⁻⁵ NSNPs per site) than for singletons (5.44 × 10⁻⁵ NSNPs per site; F = 1.21, P = 0.039). To analyze NSNPs with effects on gene functions, we first calculated the conservation of positions in multiple sequence alignments that comprised S. cerevisiae and the closest orthologs, and then examined the distribution of NSNPs at these positions. The conservation of each position was calculated as the conservation coefficient (CC) using the entropy equation (Cover and Thomas 2006; Halabi et al. 2009; Ruiz-Gonzalez and Fares 2013):
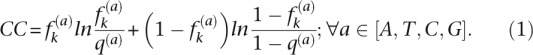 |
Figure 5.

Duplicates tolerate more nonsynonymous SNPs (NSNPs) than singletons. (A) A larger proportion of duplicates accumulate NSNPs (black portions) than singletons. (B) Most of the tolerance to NSNPs is found in duplicates originated by small-scale duplications (SSD), while those originated by whole-genome duplication (WGD) are not more enriched for NSNPs than are singletons when taking each duplicate as an independent gene.
In this equation, the conservation coefficient (CC) of a nucleotide (a) at a position (k) in a multiple sequence alignment is defined as the entropy of the observed frequency of a at k ( ) relative to the background frequency of a in all proteins (q(a)). Therefore, the more conserved the site, the higher the CC. This measure is preferable to other standard measures because CC is a nonlinear function of
  that rises more and more steeply as
  approaches one (Halabi et al. 2009). Therefore, for all but the least conserved positions, the overall conservation of each position in the alignment is well approximated by CC. We identified a total of 1.21 × 10⁵ sites that were more conserved than the mean for the protein, of which 3.95 × 10⁴ belonged to duplicates and 8.22 × 10⁴ to singletons. Roughly, we found 70 and 105 NSNPs at conserved sites and 14 NSNPs (3.54 × 10⁻⁴ NSNPs per site) and 13 NSNPs (1.58 × 10⁻⁴ NSNPs per site) at very highly conserved sites (e.g., sites that were 2 SDs from the mean) in duplicates and singletons, respectively, with the difference indicating enrichment of duplicates for NSNPs compared to singletons (Fisher’s exact test: F = 2.24, P = 0.039).
Duplicates originated by WGD and SSD (WGDs and SSDs, respectively) exhibit differences in their mutual functional dependencies and evolutionary fates. On the one hand, SSDs have been suggested to present larger genetic redundancy than WGDs, a mechanism proposed to have allowed the long-term persistence of SSDs in the genomes through genetic robustness and the opportunity to explore novel functions (Hakes et al. 2007; Carretero-Paulet and Fares 2012; Fares et al. 2013). WGDs, on the other hand, have been proposed to partition ancestral functions, making the copies of the duplicated gene less redundant (Fares et al. 2013). Given their differences, we classified the duplicates into being either WGDs or SSDs, yielding 554 pairs of WGDs and 560 pairs of SSDs (a number of duplicates were of dubious classification and were left out of the analyses). Seventy-two WGDs (12.99% of WGDs pairs and 6.49% of all WGDs) presented one copy with a NSNP, while 88 SSDs (15.71% of the pairs and 7.86% of all SSDs) were affected by a NSNP (Fig. 5B). WGDs were not enriched for NSNPs when each gene copy was taken as an independent gene (1108 genes; Fisher’s exact test: F = 1.20, P = 0.19). In contrast to WGDs, SSDs were enriched for NSNPs compared to singletons when taking gene copies independently (1120 genes; Fisher’s exact test: F = 1.47, P = 3 × 10⁻³; Fig. 5B). These results were similar when considering the number of SNPs per nonsynonymous site: WGDs were not enriched for NSNPs (Fisher’s exact test: F = 1.06, P = 0.68), while SSDs were (Fisher’s exact test: F = 1.29, P = 0.03). The difference between SSDs and WGDs was not due to SSDs’ enrichment for younger, hence more genetically redundant, gene copies, as SSDs showed similar sequence divergence levels to WGDs (e.g., see Fares et al. 2013) and thus were of the same age group as WGDs. Moreover, amino acid divergence between SSD gene copies was larger for SSDs with NSNPs (1.14) than without (0.87; Wilcoxon rank test: P = 7.02 × 10⁻⁸). Since SSDs with NSNPs were neither younger nor contained more similar gene copies, our results demonstrate higher mutational robustness of duplicates than singletons, mainly driven by SSDs and not WGDs in S. cerevisiae.
Genetically interacting duplicate gene copies are enriched for NSNPs
To test whether the enrichment for NSNPs among duplicates is the result of their robustness to mutations, we determined the distribution of NSNPs among duplicates in which both copies interact genetically and those in which gene copies do not interact. Two copies are considered to be genetically redundant if they lead to significantly larger aggravating effects when deleted than the multiplicative effect of single gene copy deletions. To identify such genetic interactions, we used the comprehensive genetic interaction network of a previous study (Costanzo et al. 2010). This network comprises 6.5 million genetic interactions covering ∼75% of the total S. cerevisiae genome, including 1682 duplicates and 2863 singletons. We identified 762,768 (11.38% of all genetic interactions tested) significant genetic interactions. Of these interactions, 416 belonged to interactions between duplicate gene copies, of which 161 (130 significant interactions and 31 synthetic lethal interactions identified from Dean et al. [2008]) pairs (38.70% of the duplicates pairs tested) were significant interactions and 255 pairs were not significant. Assuming that duplicate gene copies behaved independently, we should expect 47 of the 416 pairs of duplicates tested to present genetic interactions (11.38% × 416 pairs tested). However, the number of pairs with both copies interacting (161) is significantly larger than expected (binomial test: P < 2.2 × 10⁻¹⁶), indicating that duplicates compensate each other’s functions.
If genetic redundancy provides robustness to mutations due to the functional overlap by gene ancestry between gene copies, then duplicate pairs with genetic redundancy, and thus genetically interacting, should be more enriched for NSNPs than expected. Of all the duplicates in which both gene copies were interacting (161), 22 presented a NSNP in one gene copy (13.66% of the pairs). We tested whether duplicates with genetic interactions were more enriched for NSNPs than were pairs of genetically interacting singletons, a finding that would support a larger tolerance in duplicates than singletons for NSNPs due to genetic redundancy and not to the interaction with functions common to both gene copies (Fares et al. 2013). Unlike duplicates, in which each gene is counted once in terms of interactions, singletons with large numbers of interactions, hence present in many pairs, may enrich for NSNPs when mutated. To compare duplicates to independent pairs of singletons, we did the following: (1) listed all singletons with a known genetic interaction; (2) randomly picked 161 pairs (same as the duplicates sample size) of interacting singletons such that once a gene is present in a pair, this is removed from all subsequent samplings to avoid overrepresentation of highly interacting genes; (3) calculated the number of pairs with a NSNP; and (4) repeated this procedure 10,000 times. The distribution built from the 10,000 samples had a mean in 11.54 pairs with NSNPs and an SD of 3.25. Compared to this distribution, interacting duplicates were significantly enriched for NSNPs (Fig. 6A; under a normal distribution: P = 1.70 × 10⁻³).
Figure 6.
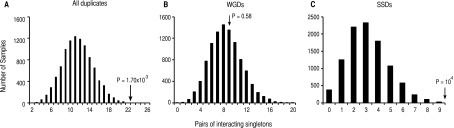
Duplicate gene copies that interact genetically are more enriched for nonsynonymous SNPs (NSNPs) than genetically interacting singletons. We built a distribution of singleton interacting pairs randomly sampled that was not biased by highly interacting singletons. (A) Duplicate interacting pairs are more enriched for NSNPs than expected (black arrow; probability of the number of observed duplicates with NSNPs is indicated above the arrow). (B) Pairs of whole-genome duplicates (WGDs) with interacting gene copies are not more enriched than expected. (C) Small-scale duplicates (SSDs) with interacting gene copies are more enriched for NSNPs than expected.
We compared the evolution of duplicates to that of distributions built from singletons, as above, for WGDs and SSDs. Of the 22 pairs of duplicates with interacting copies and with NSNPs, nine were WGDs (out of 117 WGDs with genetically interacting gene copies: 7.69% of the interacting WGDs) and 13 were SSDs (out of 44 SSDs with genetically interacting gene copies: 29.54% of SSDs). Genetically interacting WGDs were not more enriched for NSNPs than expected (Fig. 6B; under a normal distribution: P = 0.58), while SSDs were (Fig. 6C; under a normal distribution: P = 10−4). Interestingly, taking all duplicates together (WGDs and SSDs) in which gene pairs were genetically interacting, we found no significant enrichment for NSNPs when compared to duplicates with no evidence of interaction between their gene copies (Fisher’s exact test: F = 0.87, P = 0.67). However, SSDs showed strong enrichment for NSNPs among duplicates with interacting copies compared to those with noninteracting copies (Fisher’s exact test: F = 2.69, P = 0.02), while the opposite, although not significant, was true for WGDs (Fisher’s exact test: F = 0.44, P = 0.05).
Duplicate gene copies with NSNPs preserve their genetic redundancy and robustness evolving under similar selective constraints
Larger redundancy between the gene copies of duplicates, and thus mutational robustness, is expected between gene copies complementing each other’s functions to a large extent. If mutational robustness, through functional compensation, is a strong selective constraint preserving genes in duplicate, then gene copies with mutational robustness should be under similar selective constraints. While the absence of NSNPs in a fraction of genes in duplicate is not indicative of a lack of functional link between their copies, greater similarity in the selective constraints between those gene copies with NSNPs than those without NSNPs would provide additional evidence in support of functional redundancy. To test this hypothesis, we estimated the nonsynonymous-to-synonymous rates ratio (ω = dN/dS), an indicator of the strength of selection acting in protein-coding genes, for each of the genes in S. cerevisiae for which an ortholog could be found in Saccharomyces paradoxus using the model of Goldman and Yang as implemented in the program PAMLv4.7 (Yang 2007). We compared ω between the duplicate gene copies a and b (Ca,b) as
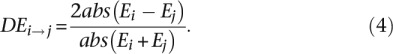
We took absolute values for the difference in the ω values to make the comparison between the set of duplicates with and without NSNPs easier to interpret. If the gene copies of a duplicate evolve similarly, then their rate of evolution (ω) should be more similar to one another, and thus Ca,b should be smaller. As expected, pairs of duplicates with NSNPs exhibited lower C values (mean C = 0.527 ± 0.035) than those without NSNPs (mean C = 0.640 ± 0.018), and this difference was significant (t-test: t = 2.18, d.f. = 263.68, P = 5 × 10⁻³). The high similarities in ω between gene copies with NSNPs could be a byproduct of the high similarities in their expression levels (Drummond et al. 2005). We therefore analyzed the difference in the expression levels (DE) between the copies (a and b) of a duplicate as
Expression levels were obtained using RNA sequencing data and are available in Supplemental Table S4 from a previous study (Nagalakshmi et al. 2008). Duplicates with NSNPs did not show higher similarity in the expression levels of their gene copies compared to duplicates without NSNPs (mean ΔEa,b for duplicates with NSNPs = 0.81; mean ΔEa,b for duplicates without NSNPs = 0.79; Wilcoxon rank test: P = 0.41).
Regulatory robustness in duplicates
Functional diversification of S. cerevisiae gene duplicates could have taken place at the level of expression regulation, protein function, or both. In a scenario in which duplicates are robust to factors perturbing their regulation, changes in the expression of a gene copy should have minimum effect on the cell as the other copy performs the functions needed. This robustness would allow the evolution of the expression of the other copy to optimize the functions of the duplicate in different conditions (e.g., under stress). Under this scenario, duplicates may have been kept not to increase the dosage of their encoded functions but to provide regulatory robustness, which in turn may have allowed the evolvability or optimization of the duplicate gene functions under a different set of growth conditions. Accordingly, duplicates should be more robust to mutations in their promoters than singletons are, while this should not necessarily be the case under selection for increased gene dosage.
To test this hypothesis, we examined whether the regulatory regions of duplicated genes have accumulated more mutations than those of singleton genes under our experimental conditions, indicating greater expression robustness of duplicates than singletons. We identified all mutations 600 bp upstream of the initiation of transcription of duplicated genes and singletons to include all the elements of the promoter (Ohler and Niemann 2001). We found 2720 mutations in intergenic regions of which 2385 mutations were in the promoter regions for the five experimental lines all together (Supplemental Tables S1–S5). Of these mutations, 970 affected upstream regions of 598 duplicated genes (26.69% of all duplicates), while 1415 fell in the upstream regions of 860 singletons (18.78% of all singletons) (Fig. 7). The number of duplicates with mutations in promoter regions was significantly larger than that of singletons (Fisher’s exact test: F = 1.58, P = 1.63 × 10⁻¹³).
Figure 7.

The number of SNPs in the promoter regions of duplicates (black column) is larger than that in the promoters of singletons (white column). This figure is built taking only those SNPs that fall within the 600 nucleotides upstream coding regions.
Since many of the mutations in promoters may fall within very variable regions that are unimportant for gene regulation, we sought to investigate whether those mutations identified in promoter regions may have an effect on gene regulation. To do so, we calculated the conservation of promoter nucleotide sites at which we observed a mutation using the entropy equation provided earlier (Equation 1). Mutations within conserved regions are generally important for gene regulation because they are sites where transcription factors bind. We generated multiple alignments for the intergenic regions upstream genes from S. cerevisiae and five other closely related yeast orthologs. Sites of duplicates’ promoters affected by SNPs were more conserved on average than those of singletons (Wilcoxon rank test: P < 2.2 × 10⁻¹⁶; Fig. 8A). Interestingly, duplicates showed SNPs at sites more conserved than expected given the alignment of duplicate promoter regions (Wilcoxon rank test: P = 0.03; Fig. 8A), while singletons showed less conservation at sites with SNPs than at those without (Wilcoxon rank test: P < 2.2 × 10⁻¹⁶; Fig. 8A). These results indicate that duplicates are more plastic in terms of expression of their genes resulting from their higher robustness to regulatory mutations, while singletons are less tolerant of changes in their regulatory regions. This observation is not the result of the different conservation levels of the promoters of duplicates compared to singletons (Fig. 8A). A case in point is PEX27, a gene encoding a peripheral peroxisomal membrane protein involved in controlling peroxisome size and number. The sites of its promoter affected by a SNP showed a conservation (C = 1.81), significantly beyond the mean conservation of the intergenic region upstream of PEX27 (Fig. 8B). Conversely, the singleton gene STE24, a highly conserved zinc metalloprotease, is very intolerant to regulatory changes, allowing mutations only at nonimportant, less conserved promoter regions (Fig. 8B).
Figure 8.

Duplicates show more expression plasticity than singletons under stress conditions. (A) Mutations at duplicate promoters occur at more conserved regions than those at singleton promoters. Conservation coefficient is calculated by measuring the amount of entropy in each nucleotide site of the alignment that comprised upstream regions of genes in S. cerevisiae and at least five other closely related orthologs. Duplicates show larger conservation in their mutated sites than expected, while singletons show less conservation than expected. (B) Two examples of the conservation of mutated sites at duplicate (PEX27) and singleton (STE24) promoter regions. Red dots represent mutated nucleotide sites during our evolution experiment. The first site from the initiation codon is also labeled (+1). (C) We analyzed 32 stress conditions from various independent studies (Supplemental Table S7). The phenotypic (expression) plasticity of genes, both the duplicates (D) and singletons (S), was calculated as the difference in the expression of the gene between two environmental conditions (Ei and Ej): 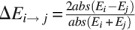 . Duplicates with larger expression plasticity are colored in red; squares are colored in blue that becomes lighter as the difference in expression decreases between the duplicates; and light yellow indicates that the corresponding information is not sufficiently large to perform statistical tests.
We also analyzed WGDs and SSDs separately, comparing each of these data sets with singletons. We found 511 mutations in the promoters of 323 WGDs, a number significantly larger than that expected when compared to singletons (Fisher’s exact test: F = 1.78, P = 1.59 × 10⁻¹³). Likewise, the number of mutations in the promoter regions of SSDs (459 mutations affecting 275 SSDs) was significantly larger than that for singletons (Fisher’s exact test: F = 1.41, P = 2.03 × 10⁻⁵). Altogether, these data support a greater regulatory robustness for duplicates than singletons and provide support to the hypothesis of functional overlap in different conditions against the prediction of neofunctionalization after gene duplication. Indeed, for 88% of duplicates with mutations in their upstream regulatory regions, both copies overlapped in their subcellular location (Supplemental Table S6), indicating the potential to perform similar functions. This subcellular colocalization of duplicates occurred significantly more often than expected by chance for any random pair of gene copies (expected: 76%; binomial test: P = 7.96 × 10⁻¹⁰).
To determine if regulatory robustness has been an important force in the evolution of duplicates, in particular to respond to various environmental challenges, we tested whether the variation in gene expression is larger in duplicates than singletons in 32 stress growth conditions (Supplemental Table S7), available from the Saccharomyces Genome Database (SGD; http://www.yeastgenome.org/download-data/expression). Variation in the expression of the copies of regulatory robust duplicates should have less effect on the cell than variations in the expression of singletons, with the former allowing adaptation to various environmental conditions without compromising the performance of the normal function. To test this, we calculated the amount of gene expression variation (DE) of singletons and duplicates between S. cerevisiae strains grown under standard conditions (Ei) and strains subjected to some stress condition (Ej) as
 |
In general, the variation in gene expression for duplicates was significantly more recurrent (24 out of the 32 conditions) than that for singletons (Fig 8C; Supplemental Table S7) (Wilcoxon signed-rank test with continuity correction: V = 384.50, P = 7 × 10⁻³). In only eight of the conditions, singletons showed similar or larger variation in their expression levels than did duplicates (Fig. 8C; Supplemental Table S7). Interestingly, there were no significant differences in the variation of gene expression between SSDs and WGDs (Fig. 8C). In conclusion, our data support larger regulatory robustness for duplicates than singletons. The relative role of SSDs and WGDs in such robustness requires, however, further investigation.
Discussion
Our results strongly support the persistence of mutational robustness in duplicates after roughly 100 My of evolution in S. cerevisiae, likely resulting from the preservation of genetic redundancy and functional compensation. First, we show that gene duplicates are more tolerant to deleterious mutations in coding regions than singletons. This tolerance to deleterious mutations is larger when duplicates interact genetically; supporting the hypothesis that functional compensation provides robustness to mutations. Importantly, SSDs are more tolerant to deleterious mutations than WGDs in agreement with a model in which SSDs are more likely to generate novel functions than WGDs, as SSDs are less constrained by dosage balance than WGDs (Hakes et al. 2007; Fares et al. 2013). Second, the gene copies of duplicates with NSNPs present more similar rates of evolution than those with no tolerance for NSNPs. This similarity in the rates of evolution is the result of stronger constraints to preserve duplicates that compensate each other’s functions and thus evolve together at the protein sequence level. It is interesting that duplicate copies with NSNPs are more similar in their selective constraints than those without NSNPs at short evolutionary times (e.g., 2200 generations). Examination of earlier time points of the evolution experiment does not provide enough statistical power to distinguish the functional divergence between duplicates with and without NSNPs, likely because the genomic target for compensatory evolution at the start of the experiment is very small. Prolonging our evolution experiment may provide stronger signatures of similar constraints between duplicates with functional complementation because the target for compensatory evolution (i.e., compensatory SNPs in functionally related duplicate copies) may be substantially larger as the number of neutral genome sites declines. Notwithstanding the possibility of stronger signatures of evolutionary homogeneity at longer evolution times, we show that duplicates with NSNPs in our evolution experiment already exhibit higher similarity in their selective constraints than those without NSNPs. Finally, genes in duplicate are more tolerant to mutations in their regulatory regions than singletons are. These hypothetically higher tolerances to regulatory changes in duplicates are consistent with the higher variation in gene expression for duplicates compared to singletons in an array of different stress conditions. Remarkably, the patterns for regulatory robustness in duplicates are a stronger signature of genes retained in duplicate than the pattern of functional robustness. This indicates that regulatory robustness may have been key in the adaptation to various stress conditions, hence favoring the preservation of both gene copies.
The different patterns of tolerance to deleterious mutations observed in our study reflect the systems’ determinants of preservation of genes in duplicate. Indeed, a number of hypotheses have been put forward to explain the survival of genes in double copy: (1) selection for increased gene dosage (Conant and Wolfe 2008); (2) increased genetic robustness (Gu et al. 2003); (3) fast functional divergence after gene duplication (Force et al. 1999; He and Zhang 2005; Des Marais and Rausher 2008; Barkman and Zhang 2009); and (4) expression divergence after gene duplication (Francino 2005). Many of these forces may have occurred simultaneously in one single organism, in particular after the duplication of the entire genome in Saccharomyces. However, mutational robustness provides the most plausible explanation for the fast adaptation to novel environmental challenges when the mechanisms of robustness become impaired. An example of such an adaptive mechanism is that of the preference of Saccharomyces species for glucose in anaerobic conditions, and thus diversion from respiration toward fermentation. It has been suggested that such a metabolism, which is characterized by an increased glycolytic flux owing to an excess of genes of energy metabolism (Kuepfer et al. 2005), is linked to WGD (Conant and Wolfe 2007). Regulatory robustness, as supported in our study, and a rapid selective advantage for growing in excess glucose through fermentation (Piskur et al. 2006; Conant and Wolfe 2007) may have allowed the survival of duplicated genes encoding glycolytic enzymes, overcoming the metabolic cost of gene duplication (Wagner 2005a; Gerstein et al. 2006). The exploration and adaptation to a new niche characterized by an excess of glucose, may have allowed the competitive colonization and the diversification of Saccharomyces species through the regulatory robustness and survival of duplicated glycolytic enzymes. Our view supports a model in which after gene duplication, one gene copy diverges very quickly in some functions but not in others. The functional overlap of gene copies provides the system with robustness to mutations for a short period of time until new functions are found by one copy and selective constraints are restored on both copies at a similar level (Fares et al. 2013). The functional overlap between both gene copies and the acquisition of new functions by one copy both contribute to the plasticity of duplicates to respond to new challenging environments. Therefore, mutational and environmental robustness are tightly linked and both are necessary for preservation and innovation through gene duplication.
The question that remains is the following: Could robustness persist for long periods once adaptations to novel environmental conditions have emerged? Gu et al. (2003) evaluated the role of gene duplication in genetic robustness using fitness measures of single gene deletions. They found that gene duplication masks the fitness effects of null mutations, confirming that duplicates provide genetic robustness, through functional compensation, even after a long period of evolutionary divergence. The masking of genetic interactions, and thus functional compensation, between the copies of gene duplicates was also confirmed in a recent study using large-scale genetic networks (VanderSluis et al. 2010). Moreover, appreciable signatures of functional compensation have also been found in another study that used genetic interaction profiles in S. cerevisiae (Ihmels et al. 2007). Finally, redundant interactions have been found between ancient duplicates in transcriptional regulation networks (Teichmann and Babu 2004). While recent studies have highlighted the lack of functional compensation in natural populations as evidence against genetic redundancy (Plata and Vitkup 2013), we find that these scenarios are not conflicting, as one—adaptation to novel environments—is the result of the other—mutational and regulatory robustness through genetic redundancy. Indeed, robustness to mutations, both in the coding and regulatory regions, provides ample opportunity for novel traits and adaptations to emerge (Wagner 2012; Payne and Wagner 2014), eventually leading to bewildering biological diversification (Wray 2007). At the molecular systems level, genetic redundancy, robustness, and divergence after gene duplication may lead to evolutionary leaps through a change in the architecture and function of molecular networks, such that different daughters of a duplicated gene may be part of different subnetworks (van Noort et al. 2003; Blanc and Wolfe 2004b; Piskur and Langkjaer 2004) or may themselves form semi-independent daughter networks (Conant and Wolfe 2006). Our analyses strongly confirm the pervasive persistence of signatures of ancient genetic redundancy that may be the source for novel adaptations yet to occur. Based on our findings, and those of previous studies, we propose that genetic and regulatory redundancy go hand-in-hand in providing robustness and opportunity for innovation. Under this hypothesis, the emergence of a novel function requires the survival of initially redundant genetic material, its functional divergence, and the fine-tuned regulation of the expression of novel functions. This divergence in a biologically complex and dynamic molecular network can provide ample phenotypic plasticity, and thus evolvability, in the face of environmental challenges (Wagner 2014). In conclusion, we resolve the controversy on the role of gene duplication in genetic robustness through functional redundancy and compensation and its role in the emergence of adaptations to various stresses.
Methods
Evolution experiments
Yeast strains, plasmids, and the evolution experiment
The yeast haploid strain Y06240 (BY4741; Mata; his3D1; leu2D0; met15D0; ura3D0; msh2∷kanMX4) was obtained from Euroscarf. This msh2 deletion strain is deficient in mismatch repair (MMR). Msh2 forms a complex with Msh6 that recognizes and initiates the repair of single-base mismatches or small one or two nucleotide insertions/deletions (Habraken et al. 1996). Strains lacking Msh2 are predicted to have an increased mutation rate of between sixfold and 40-fold compared with the wild type (Kunz et al. 1998).
Our evolution experiments started with a single-colony–founded population, from which we derived five evolving lineages of Y06240 (Fig. 1). These clonal populations were serially passaged onto YPD by repeated streaking, each passage resulting from restreaking a single colony. Since populations were clonally transmitted from generation to generation, this experiment simulated a mutation accumulation (MA) Muller ratchet dynamic. Therefore, in principle, our experiment was free of selection, allowing thereby the fixation of deleterious, or slightly deleterious, nonlethal mutations. However, since cells were growing in rich media, genes not essential under our experimental conditions may have accumulated neutral mutations. Restreaking was carried out every 48–72 h as required. Each lineage was passaged 100 times, an estimated 2200 generations in total (∼22 generations per passage × 100 passages). A glycerol stock of each lineage was prepared every 10 passages (∼220 generations) and stored at −80°C. To estimate fitness costs of mutations, each evolved lineage prepared for glycerol stock was compared for growth against the starting Y06240 ancestor. Cells were grown routinely in YPD media (2% [w/v] bacto-peptone, 1% [w/v] yeast extract, 2% [w/v] glucose). When solid media was required, 2% (w/v) bacto-agar was added. We constructed growth curves for each of the experimentally evolving lines at those passages at which we sequenced the genomes. Growth rates were estimated and adjusted for the initial cell density and medium used as in a previous study (Fares et al. 2013). Each strain was grown in triplicate in 4 mL YPD medium at 30°C. The absorbance was measured at 600 nm, and cells diluted in culture were then placed in duplicate wells of a 96-well plate and grown for 24 h at 30°C with shaking in a synergy HT plate reader (BioTek). At 30-min intervals, the absorbance at 600 nm was measured. Growth curves were generated for each strain by plotting the mean of the absorbance measurements over time.
Whole-genome sequencing
In order to map spontaneous mutations occurring during the evolution experiment, whole-genome sequencing of the ancestor and each evolved line was carried out. Genomes were sequenced for four lines at passages 20, 30, 50, 70, 90, and 100 and for one line (MA5) at passages 20, 50, and 90. Genomic DNA preparations were obtained using the Wizard genomic DNA purification kit (Promega) as recommended by the manufacturer. DNA was quantified spectrophotometrically using a NanoDrop and flurometrically using a Qubit florometer. Illumina sequencing libraries were constructed from all strains to be sequenced by sonicating 1.5 μg of DNA using a bioruptor (Diagenode) until fragment sizes <2000 bp were obtained. Following A-tail end-repair, Illumina adaptors were ligated to the fragment ends. Samples were run on a low melting temperature 2% agarose gel and were DNA excised and eluted from the 175- to 225-bp range. PCR amplification was used to enrich fragments to generate final sequencing libraries at a concentration of 10 nM. An Illumina Genome Analyzer II platform was used for sequencing, and indexed samples were run on three separate flow cells, with two strains per lane of a flow cell using the paired-end module. After removal of the index sequence, 34- or 74-bp reads were obtained.
Mapping mutations
Sequencing reads were converted from Illumina quality scores into Sanger quality scores. We then used the breseq v 0.24rc (version 4) (http://barricklab.org/twiki/bin/view/Lab/ToolsBacterialGenomeResequencing) pipeline for aligning (using Bowtie 2) (Langmead and Salzberg 2012) the Illumina reads to S. cerevisiae genome (EF2 version 59, Ensembl) (Flicek et al. 2011) and to identify SNPs and indels. Individual runs of breseq, with the junction prediction disabled but otherwise using default parameters, were performed for the ancestral sequence as well as each passage for each of the five lines. Finally, the gdtool from breseq was used to create a list containing the union of mutation in each lineage and the ancestral, and an in-house script was run to create tables containing all SNPs and indels for each lineage (including the ancestral) (Supplemental Tables S2–S5).
Identifying SSD and WGDs
Duplicate gene pairs were defined as the resulting best reciprocal hits from all-against-all BLAST-searches using BLASTP with an E-value cutoff of 1 × 10⁻⁵ and a bit score cutoff of 50 (Altschul et al. 1997). Duplicates were further classified as originated through the WGD that took place roughly 100–150 Mya according to the reconciled list provided by the YGOB (Yeast Gene Order Browser, http://wolfe.gen.tcd.ie/ygob/) (Byrne and Wolfe 2005). All other duplicates were considered to originate through SSD events. To ascertain that the set of SSDs was not enriched for younger duplicates than the set of WGDs, we measured the divergence between SSD gene copies and that of WGD gene copies using synonymous nucleotide substitutions estimated under the model of Goldman and Yang in PAMLv4.7 (Yang 2007) and Poisson-corrected amino acid distances. The final set of SSDs contained 560 pairs with equivalent synonymous and divergence levels to that of the set of WGDs (556).
Genetic interaction data
We used the latest update of the genetic functional chart of S. cerevisiae (Costanzo et al. 2010; Supplemental files S4 and S5 from http://drygin.ccbr.utoronto.ca/∼costanzo2009/). This functional map is based on the synthetic genetic array methodology (Tong et al. 2001), in which synthetic lethal genetic interactions are systematically mapped by producing single and double mutants (Tong et al. 2004). In their study, Costanzo et al. (2010) identified digenic interactions as those double mutants that show a significant deviation in fitness compared to the multiplicative fitness effects of the two single mutants, that is, epistasis (ɛ) (Mani et al. 2008). Negative interactions (ɛ−) refer to those double mutants causing more severe defects than the multiplicative effects of the single mutants, with synthetic lethality being the extreme case. Positive interactions (ɛ+) are those causing less consequence than the multiplicative effects of single mutants. Defects were measured in terms of colony sizes.
Data access
Sequenced strains have been submitted to the NCBI Sequence Read Archive (SRA; http://www.ncbi.nlm.nih.gov/sra) under accession number SRP012321.
Acknowledgments
We thank Dr. Pablo Labrador for very valuable discussions on the manuscript. This study has been supported by a grant from the Spanish Ministerio de Economía y Competitividad (BFU2009-12022) and another grant from the Science Foundation Ireland (12/IP/1673) to M.A.F. The funders had no role in study design, data collection and analysis, decision to publish, or preparation of the manuscript. C.T. was funded by an EMBO long-term post-doctoral fellowship (reference: ALTF730-2011). We also thank the anonymous reviewers who contributed to improving this manuscript.
Author contributions: M.A.F. conceived and designed the study. O.M.K. and C.T. conducted the evolution experiment and mapped genome mutations. G.W.J. and O.M.K. conducted the fitness assays. L.C.P. identified duplicates and estimated their rates of evolution. C.T., L.C.P., and M.A.F. conducted the statistical analyses. M.A.F. wrote the manuscript.
Footnotes
[Supplemental material is available for this article.]
Article published online before print. Article, supplemental material, and publication date are at http://www.genome.org/cgi/doi/10.1101/gr.176792.114.
References
- Altschul SF, Madden TL, Schaffer AA, Zhang J, Zhang Z, Miller W, Lipman DJ. 1997. Gapped BLAST and PSI-BLAST: a new generation of protein database search programs. Nucleic Acids Res 25: 3389–3402 [DOI] [PMC free article] [PubMed] [Google Scholar]
- Barkman T, Zhang J. 2009. Evidence for escape from adaptive conflict? Nature 462: E1. [DOI] [PubMed] [Google Scholar]
- Birchler JA, Riddle NC, Auger DL, Veitia RA. 2005. Dosage balance in gene regulation: biological implications. Trends Genet 21: 219–226 [DOI] [PubMed] [Google Scholar]
- Blanc G, Wolfe KH. 2004a. Functional divergence of duplicated genes formed by polyploidy during Arabidopsis evolution. Plant Cell 16: 1679–1691 [DOI] [PMC free article] [PubMed] [Google Scholar]
- Blanc G, Wolfe KH. 2004b. Widespread paleopolyploidy in model plant species inferred from age distributions of duplicate genes. Plant Cell 16: 1667–1678 [DOI] [PMC free article] [PubMed] [Google Scholar]
- Byrne KP, Wolfe KH. 2005. The Yeast Gene Order Browser: combining curated homology and syntenic context reveals gene fate in polyploid species. Genome Res 15: 1456–1461 [DOI] [PMC free article] [PubMed] [Google Scholar]
- Carretero-Paulet L, Fares MA. 2012. Evolutionary dynamics and functional specialization of plant paralogs formed by whole and small-scale genome duplications. Mol Biol Evol 29: 3541–3551 [DOI] [PubMed] [Google Scholar]
- Conant GC, Wagner A. 2004. Duplicate genes and robustness to transient gene knock-downs in Caenorhabditis elegans. Proc Biol Sci 271: 89–96 [DOI] [PMC free article] [PubMed] [Google Scholar]
- Conant GC, Wolfe KH. 2006. Functional partitioning of yeast co-expression networks after genome duplication. PLoS Biol 4: e109. [DOI] [PMC free article] [PubMed] [Google Scholar]
- Conant GC, Wolfe KH. 2007. Increased glycolytic flux as an outcome of whole-genome duplication in yeast. Mol Syst Biol 3: 129. [DOI] [PMC free article] [PubMed] [Google Scholar]
- Conant GC, Wolfe KH. 2008. Turning a hobby into a job: how duplicated genes find new functions. Nat Rev Genet 9: 938–950 [DOI] [PubMed] [Google Scholar]
- Costanzo M, Baryshnikova A, Bellay J, Kim Y, Spear ED, Sevier CS, Ding H, Koh JL, Toufighi K, Mostafavi S, et al. 2010. The genetic landscape of a cell. Science 327: 425–431 [DOI] [PMC free article] [PubMed] [Google Scholar]
- Cover TM, Thomas JA. 2006. Elements of information theory, 2nd ed. Wiley-Interscience, New York
- Cui L, Wall PK, Leebens-Mack JH, Lindsay BG, Soltis DE, Doyle JJ, Soltis PS, Carlson JE, Arumuganathan K, Barakat A, et al. 2006. Widespread genome duplications throughout the history of flowering plants. Genome Res 16: 738–749 [DOI] [PMC free article] [PubMed] [Google Scholar]
- Dean EJ, Davis JC, Davis RW, Petrov DA. 2008. Pervasive and persistent redundancy among duplicated genes in yeast. PLoS Genet 4: e1000113. [DOI] [PMC free article] [PubMed] [Google Scholar]
- Des Marais DL, Rausher MD. 2008. Escape from adaptive conflict after duplication in an anthocyanin pathway gene. Nature 454: 762–765 [DOI] [PubMed] [Google Scholar]
- Draghi JA, Parsons TL, Wagner GP, Plotkin JB. 2010. Mutational robustness can facilitate adaptation. Nature 463: 353–355 [DOI] [PMC free article] [PubMed] [Google Scholar]
- Drummond DA, Bloom JD, Adami C, Wilke CO, Arnold FH. 2005. Why highly expressed proteins evolve slowly. Proc Natl Acad Sci 102: 14338–14343 [DOI] [PMC free article] [PubMed] [Google Scholar]
- Fares MA, Keane OM, Toft C, Carretero-Paulet L, Jones GW. 2013. The roles of whole-genome and small-scale duplications in the functional specialization of Saccharomyces cerevisiae genes. PLoS Genet 9: e1003176. [DOI] [PMC free article] [PubMed] [Google Scholar]
- Flicek P, Amode MR, Barrell D, Beal K, Brent S, Chen Y, Clapham P, Coates G, Fairley S, Fitzgerald S, et al. 2011. Ensembl 2011. Nucleic Acids Res 39: D800–D806 [DOI] [PMC free article] [PubMed] [Google Scholar]
- Force A, Lynch M, Pickett FB, Amores A, Yan YL, Postlethwait J. 1999. Preservation of duplicate genes by complementary, degenerative mutations. Genetics 151: 1531–1545 [DOI] [PMC free article] [PubMed] [Google Scholar]
- Francino MP. 2005. An adaptive radiation model for the origin of new gene functions. Nat Genet 37: 573–577 [DOI] [PubMed] [Google Scholar]
- Freeling M, Thomas BC. 2006. Gene-balanced duplications, like tetraploidy, provide predictable drive to increase morphological complexity. Genome Res 16: 805–814 [DOI] [PubMed] [Google Scholar]
- Gerstein AC, Chun HJ, Grant A, Otto SP. 2006. Genomic convergence toward diploidy in Saccharomyces cerevisiae. PLoS Genet 2: e145. [DOI] [PMC free article] [PubMed] [Google Scholar]
- Gu Z, Steinmetz LM, Gu X, Scharfe C, Davis RW, Li WH. 2003. Role of duplicate genes in genetic robustness against null mutations. Nature 421: 63–66 [DOI] [PubMed] [Google Scholar]
- Habraken Y, Sung P, Prakash L, Prakash S. 1996. Binding of insertion/deletion DNA mismatches by the heterodimer of yeast mismatch repair proteins MSH2 and MSH3. Curr Biol 6: 1185–1187 [DOI] [PubMed] [Google Scholar]
- Hakes L, Lovell SC, Oliver SG, Robertson DL. 2007. Specificity in protein interactions and its relationship with sequence diversity and coevolution. Proc Natl Acad Sci 104: 7999–8004 [DOI] [PMC free article] [PubMed] [Google Scholar]
- Halabi N, Rivoire O, Leibler S, Ranganathan R. 2009. Protein sectors: evolutionary units of three-dimensional structure. Cell 138: 774–786 [DOI] [PMC free article] [PubMed] [Google Scholar]
- He X, Zhang J. 2005. Rapid subfunctionalization accompanied by prolonged and substantial neofunctionalization in duplicate gene evolution. Genetics 169: 1157–1164 [DOI] [PMC free article] [PubMed] [Google Scholar]
- Hoegg S, Brinkmann H, Taylor JS, Meyer A. 2004. Phylogenetic timing of the fish-specific genome duplication correlates with the diversification of teleost fish. J Mol Evol 59: 190–203 [DOI] [PubMed] [Google Scholar]
- Holub EB. 2001. The arms race is ancient history in Arabidopsis, the wildflower. Nat Rev Genet 2: 516–527 [DOI] [PubMed] [Google Scholar]
- Hsiao TL, Vitkup D. 2008. Role of duplicate genes in robustness against deleterious human mutations. PLoS Genet 4: e1000014. [DOI] [PMC free article] [PubMed] [Google Scholar]
- Ihmels J, Collins SR, Schuldiner M, Krogan NJ, Weissman JS. 2007. Backup without redundancy: genetic interactions reveal the cost of duplicate gene loss. Mol Syst Biol 3: 86. [DOI] [PMC free article] [PubMed] [Google Scholar]
- Kim S, Yoo MJ, Albert VA, Farris JS, Soltis PS, Soltis DE. 2004. Phylogeny and diversification of B-function MADS-box genes in angiosperms: evolutionary and functional implications of a 260-million-year-old duplication. Am J Bot 91: 2102–2118 [DOI] [PubMed] [Google Scholar]
- Kuepfer L, Sauer U, Blank LM. 2005. Metabolic functions of duplicate genes in Saccharomyces cerevisiae. Genome Res 15: 1421–1430 [DOI] [PMC free article] [PubMed] [Google Scholar]
- Kunz BA, Ramachandran K, Vonarx EJ. 1998. DNA sequence analysis of spontaneous mutagenesis in Saccharomyces cerevisiae. Genetics 148: 1491–1505 [DOI] [PMC free article] [PubMed] [Google Scholar]
- Langmead B, Salzberg SL. 2012. Fast gapped-read alignment with Bowtie 2. Nat Methods 9: 357–359 [DOI] [PMC free article] [PubMed] [Google Scholar]
- Lespinet O, Wolf YI, Koonin EV, Aravind L. 2002. The role of lineage-specific gene family expansion in the evolution of eukaryotes. Genome Res 12: 1048–1059 [DOI] [PMC free article] [PubMed] [Google Scholar]
- Lynch M, Conery JS. 2000. The evolutionary fate and consequences of duplicate genes. Science 290: 1151–1155 [DOI] [PubMed] [Google Scholar]
- Maere S, De Bodt S, Raes J, Casneuf T, Van Montagu M, Kuiper M, Van de Peer Y. 2005. Modeling gene and genome duplications in eukaryotes. Proc Natl Acad Sci 102: 5454–5459 [DOI] [PMC free article] [PubMed] [Google Scholar]
- Mani R, St Onge RP. Hartman JLt, Giaever G, Roth FP. 2008. Defining genetic interaction. Proc Natl Acad Sci 105: 3461-3466 [DOI] [PMC free article] [PubMed] [Google Scholar]
- Nagalakshmi U, Wang Z, Waern K, Shou C, Raha D, Gerstein M, Snyder M. 2008. The transcriptional landscape of the yeast genome defined by RNA sequencing. Science 320: 1344–1349 [DOI] [PMC free article] [PubMed] [Google Scholar]
- Ohler U, Niemann H. 2001. Identification and analysis of eukaryotic promoters: recent computational approaches. Trends Genet 17: 56–60 [DOI] [PubMed] [Google Scholar]
- Ohno S. 1999. Gene duplication and the uniqueness of vertebrate genomes circa 1970–1999. Semin Cell Dev Biol 10: 517–522 [DOI] [PubMed] [Google Scholar]
- Otto SP, Whitton J. 2000. Polyploid incidence and evolution. Annu Rev Genet 34: 401–437 [DOI] [PubMed] [Google Scholar]
- Payne JL, Wagner A. 2014. The robustness and evolvability of transcription factor binding sites. Science 343: 875–877 [DOI] [PubMed] [Google Scholar]
- Piskur J, Langkjaer RB. 2004. Yeast genome sequencing: the power of comparative genomics. Mol Microbiol 53: 381–389 [DOI] [PubMed] [Google Scholar]
- Piskur J, Rozpedowska E, Polakova S, Merico A, Compagno C. 2006. How did Saccharomyces evolve to become a good brewer? Trends Genet 22: 183–186 [DOI] [PubMed] [Google Scholar]
- Plata G, Vitkup D. 2013. Genetic robustness and functional evolution of gene duplicates. Nucleic Acids Res 42: 2405–2414 [DOI] [PMC free article] [PubMed] [Google Scholar]
- Ruiz-Gonzalez MX, Fares MA. 2013. Coevolution analyses illuminate the dependencies between amino acid sites in the chaperonin system GroES-L. BMC Evol Biol 13: 156. [DOI] [PMC free article] [PubMed] [Google Scholar]
- Stelling J, Sauer U, Szallasi Z, Doyle FJ 3rd, Doyle J. 2004. Robustness of cellular functions. Cell 118: 675–685 [DOI] [PubMed] [Google Scholar]
- Teichmann SA, Babu MM. 2004. Gene regulatory network growth by duplication. Nat Genet 36: 492–496 [DOI] [PubMed] [Google Scholar]
- Tong AH, Evangelista M, Parsons AB, Xu H, Bader GD, Page N, Robinson M, Raghibizadeh S, Hogue CW, Bussey H, et al. 2001. Systematic genetic analysis with ordered arrays of yeast deletion mutants. Science 294: 2364–2368 [DOI] [PubMed] [Google Scholar]
- Tong AH, Lesage G, Bader GD, Ding H, Xu H, Xin X, Young J, Berriz GF, Brost RL, Chang M, et al. 2004. Global mapping of the yeast genetic interaction network. Science 303: 808–813 [DOI] [PubMed] [Google Scholar]
- van Noort V, Snel B, Huynen MA. 2003. Predicting gene function by conserved co-expression. Trends Genet 19: 238–242 [DOI] [PubMed] [Google Scholar]
- VanderSluis B, Bellay J, Musso G, Costanzo M, Papp B, Vizeacoumar FJ, Baryshnikova A, Andrews B, Boone C, Myers CL. 2010. Genetic interactions reveal the evolutionary trajectories of duplicate genes. Mol Syst Biol 6: 429. [DOI] [PMC free article] [PubMed] [Google Scholar]
- Wagner A. 2000. Robustness against mutations in genetic networks of yeast. Nat Genet 24: 355–361 [DOI] [PubMed] [Google Scholar]
- Wagner A. 2005a. Energy constraints on the evolution of gene expression. Mol Biol Evol 22: 1365–1374 [DOI] [PubMed] [Google Scholar]
- Wagner A. 2005b. Robustness, evolvability, and neutrality. FEBS Lett 579: 1772–1778 [DOI] [PubMed] [Google Scholar]
- Wagner A. 2012.The role of robustness in phenotypic adaptation and innovation. Proc Biol Sci 279: 1249–1258 [DOI] [PMC free article] [PubMed] [Google Scholar]
- Wagner A. 2014. Mutational robustness accelerates the origin of novel RNA phenotypes through phenotypic plasticity. Biophys J 106: 955–965 [DOI] [PMC free article] [PubMed] [Google Scholar]
- Wendel JF. 2000. Genome evolution in polyploids. Plant Mol Biol 42: 225–249 [PubMed] [Google Scholar]
- Wolfe KH, Shields DC. 1997. Molecular evidence for an ancient duplication of the entire yeast genome. Nature 387: 708–713 [DOI] [PubMed] [Google Scholar]
- Wray GA. 2007. The evolutionary significance of cis-regulatory mutations. Nat Rev Genet 8: 206–216 [DOI] [PubMed] [Google Scholar]
- Yang Z. 2007. PAML 4: phylogenetic analysis by maximum likelihood. Mol Biol Evol 24: 1586–1591 [DOI] [PubMed] [Google Scholar]